Overview
The continuous decline of the cryptocurrency market in early November 2026 was triggered by a deleveraging process influenced by a reversal in macro interest rate expectations, spillover risks from tech stocks, and net outflows from U.S. spot ETFs: from November 5 to November 9, the derivatives market experienced two waves of forced liquidations totaling $2.08 billion, pushing Bitcoin (BTC) to flash crash from $75,690 to a new low of $73,477 within 15 minutes on the night of November 8 (trading at $74,133.11 as of November 9, 18:31 Singapore time), which led to Ethereum (ETH) plunging over 5% in a single day, breaking the critical support at $2,157 down to $2,104.42. The core watershed determining the future direction of both cryptocurrencies is that Bitcoin has currently fallen below the realized price of short-term holders on-chain ($75,820) and the average holding price for the world's largest corporate treasury ($75,451); bulls must reclaim the cost zone of $75,450 to $75,820 on a daily level to alleviate the risk of dipping to $70,000, while Ethereum needs to recover $2,242 under the premise of holding the psychological level of $2,000 to reverse the weakness against Bitcoin.

Key Points
This round of retracting the crypto market is not an isolated negative event for a single currency, but rather a chain reaction resulting from the tightening of macro liquidity signals and institutional fund redemptions combined. As of November 9, 2026, the total market capitalization of global cryptocurrencies has fallen from $2.62 trillion in early November to approximately $2.52 trillion, and the crypto fear and greed index has dropped to the fear range of 28 to 29. Analyzing the decline trajectory reveals three major core drivers: First, the U.S. non-farm payrolls surged by 165,000 in October (far exceeding market expectations of 65,000), reinforcing the hawkish expectations that the Federal Reserve will maintain high interest rates or even discuss rate hikes at the December meeting; second, $1.3 billion net outflow occurred in the U.S. spot Bitcoin ETF over the first five trading days of November (with a single-day outflow of $430.2 million on November 5), officially turning the cumulative net inflow for the entire year 2026 from positive to negative (a net outflow of $416 million to $502 million year-to-date), while holders of the spot Ethereum ETF are facing an average cost line pressure around $3,200; third, the investigation into Nvidia executives and stagnant U.S.-Iran negotiations caused a major market upset on the night of November 8, triggering a series of liquidations over $1 billion in a single session, with Ethereum's single-currency liquidation amount reaching $448 million, surpassing Bitcoin's $272 million. In the current high-volatility environment, traders can observe the turnover strength in key cost areas by tracking real-time Bitcoin market prices and Ethereum spot quotes.
Reviewing the Two Waves of Crypto Market Sell-offs in Early November: From the Impact of 165,000 Non-farm Jobs to the Flash Crash on Sunday Night
Looking back at the complete evolution of the market from November 3 to 9, 2026, the cryptocurrency market did not decline at a steady pace but experienced two waves of impulse deleveraging directly triggered by external macro and cross-market events.
The first wave of selling occurred between November 5 (Thursday) and November 6 (Friday). On November 5, the Nasdaq Composite Index plummeted 5.52% due to newly elected governors in Texas and three other states promising to suspend approvals for the construction of AI data centers after the U.S. midterm elections, creating a massive sell-off that quickly infected crypto assets. Following this, on November 6, the U.S. Bureau of Labor Statistics released the October non-farm employment report showing a significant increase of 165,000 jobs, which not only surpassed the consensus market expectation (65,000) by more than 2.5 times but also far exceeded the previous twelve-month average monthly increase of 48,000 jobs, with the unemployment rate slightly falling to 4.1%. Since two members voted in favor of raising rates by 25 basis points during the FOMC meeting on October 28 while the Fed maintained the 3.75% to 4.00% rate unchanged with a 10 to 2 vote, this strong employment report directly undermined the market's fantasy of imminent rate cuts. According to November 6 market clearing statistics, the total market value of cryptocurrencies fell 7.32% in a single day to $2.58 trillion, with 78 out of the top 100 tokens dropping, triggering $1.08 billion in forced liquidations in 24 hours, with long positions accounting for $954.38 million (88.2%) and short positions only $127.30 million.
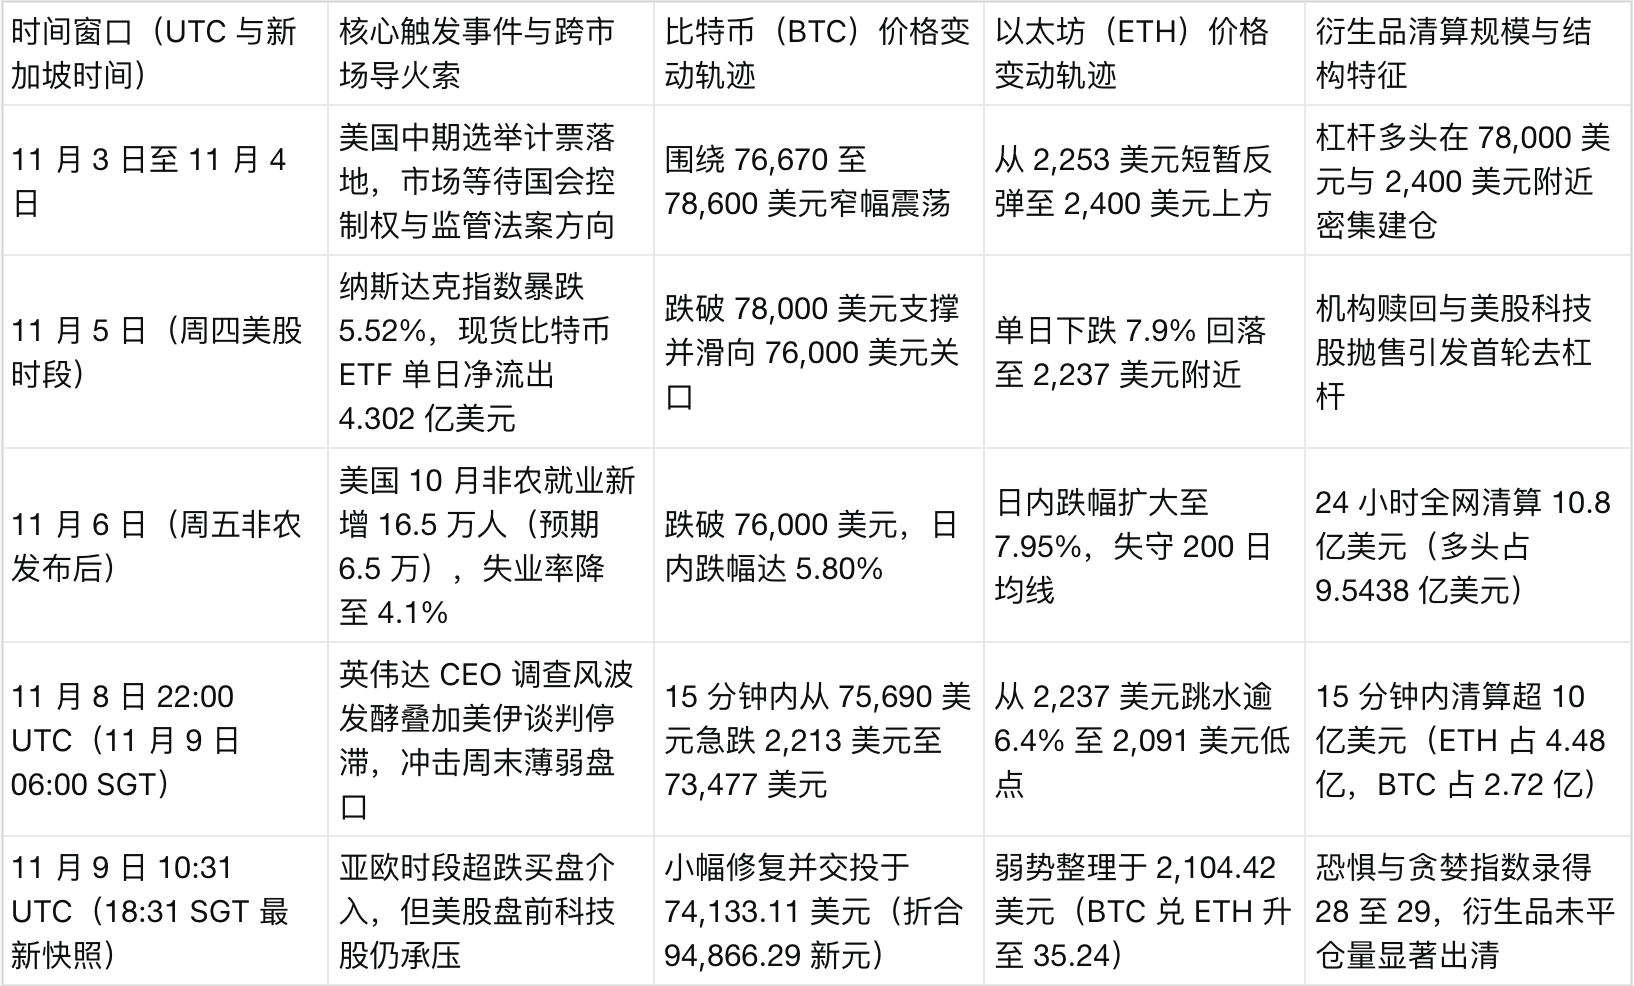
The second and more destructive wave of selling occurred on November 8 (Sunday) at 22:00 UTC (corresponding to 06:00 Singapore time on November 9). In the period when traditional financial markets had not yet opened, and with the thinnest bid thickness from market makers on weekends, Nvidia's board announced an independent investigation concerning CEO Jensen Huang involving an $4.8 billion chip procurement in Southeast Asia. Combined with geopolitical news of stagnant U.S.-Iran negotiations, this triggered quantitative funds across assets to start selling off in the crypto market first. According to the Sunday night flash crash and liquidation report, Bitcoin plummeted vertically from $75,690 to $73,477 in just 15 minutes (creating the lowest price since August 2026), and Ethereum broke through both the $2,200 and $2,157 defenses, hitting a low of $2,091. This liquidity vacuum in 15 minutes reignited forced liquidations exceeding $1 billion and exhibited an extraordinarily rare inverted structure: Ethereum's single-currency liquidation amounted to $448 million, 64.7% higher than Bitcoin's $272 million, reflecting that leveraged long positions that had tried to bottom fish Ethereum over the weekend faced concentrated liquidation. As noted by Morningstar Dow Jones Market News on November 9, although Bitcoin had rebounded to around $74,133 after the flash crash, the market's active buying confidence remained fragile.
Institutional Fund Drain: Why Did Bitcoin ETF's Cumulative Net Inflows Turn Negative in November?
If the contract liquidations explain the speed of short-term declines, then the continued net redemptions from U.S. spot ETFs explain why every rebound lacks sustained buying support.
According to the daily ledger verified by Farside Spot ETF Flow Table and TFTC November ETF Statistics as of November 7, the twelve U.S. spot Bitcoin ETFs recorded a total net outflow of $1.3 billion within the first five trading days of November (with net outflows on 4 out of the past 5 days, only November 4 recorded a net inflow of $74.6 million). Among them, on November 5 (Thursday), the net outflow reached $430.2 million, with none of the 12 funds recording net inflows; BlackRock's iShares Bitcoin Trust (IBIT) saw cumulative net outflows of $1.2 billion since the beginning of the month (including $95 million outflow on November 3, $201.2 million on November 4, and $105 million on November 5), while Fidelity's FBTC managed to record a net inflow of $93.1 million during the month but fell far short of offsetting the redemptions from IBIT.
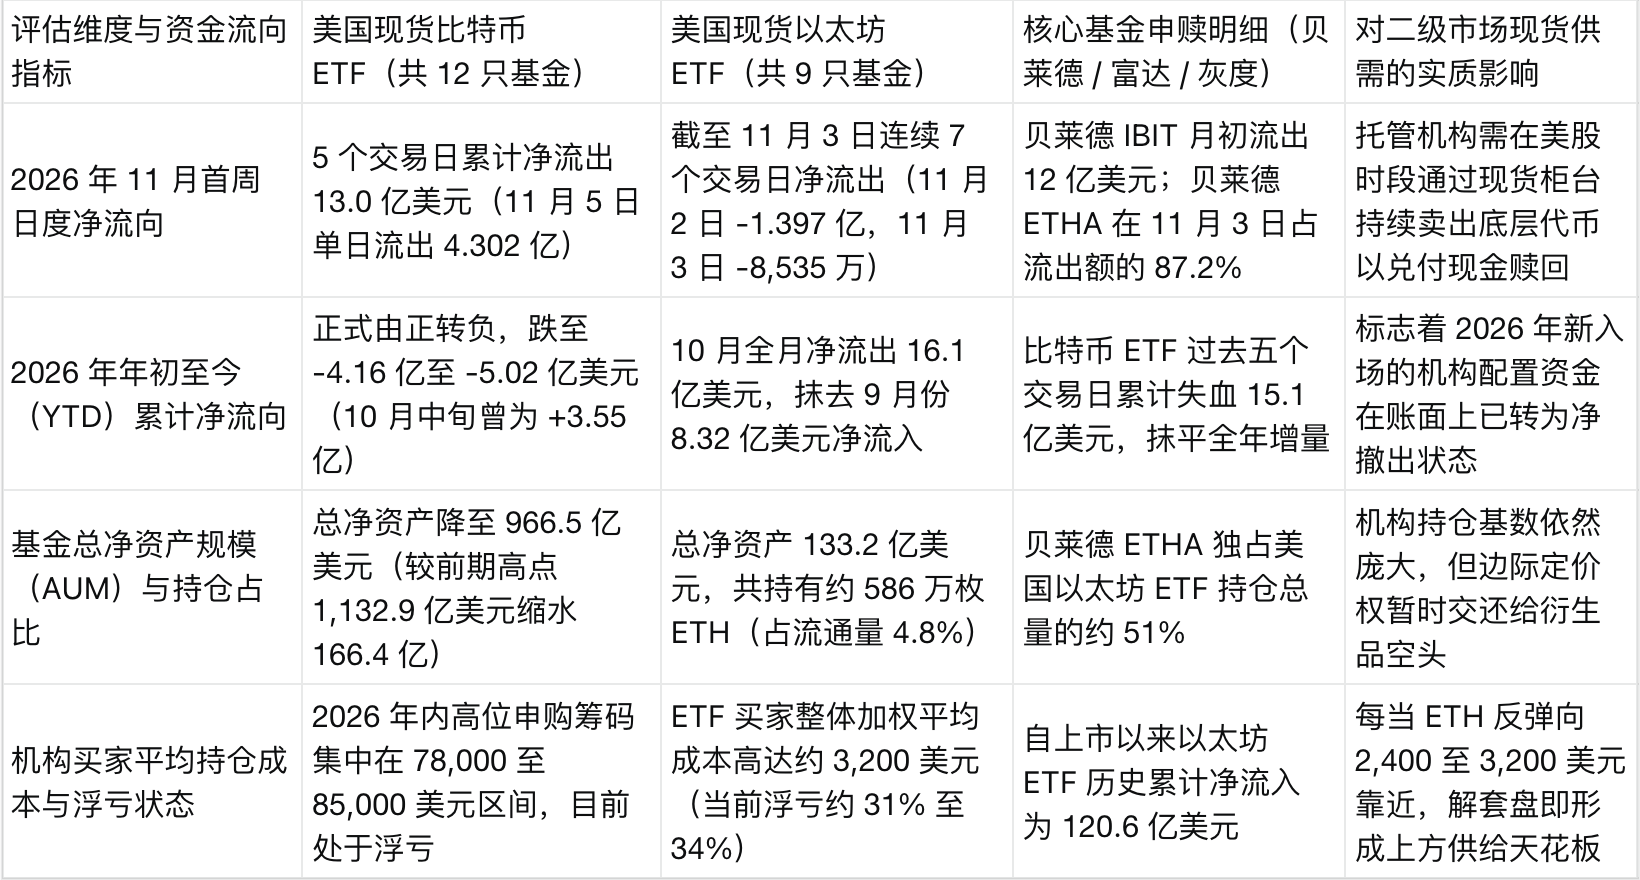
A more concerning milestone signal comes from SoSoValue Crypto ETF Tracking: with $643.3 million outflow on October 30, $398.62 million on November 2, $115.56 million on November 3, and $430.2 million on November 5, the cumulative net inflow of U.S. spot Bitcoin ETFs for the entire year 2026 has officially dropped below zero, decreasing to negative $416 million to negative $502 million (total assets under management shrank from $113.29 billion to $96.65 billion). Investors can see the redemption transmission mechanism of the spot ETF capital flow, when ETFs experience consecutive net redemptions of several hundred million dollars, authorized participants (AP) must sell an equivalent amount of spot Bitcoin in the secondary market to reclaim cash in USD, which directly creates continuous selling pressure during U.S. stock trading hours.
On the Ethereum side, the cost inversion faced by institutional holdings is even more severe. According to computational assessments from Ethereum ETF cost basis and staking reports, currently, the nine U.S. spot Ethereum ETFs collectively hold approximately 5.86 million ETH (accounting for 4.8% of the total circulating supply, total net assets $13.32 billion, with BlackRock's ETHA accounting for about 51%), but the average entry cost of these ETF buyers is approximately $3,200. At the price of $2,104.42 on November 9, U.S. Ethereum ETF holders are collectively experiencing an approximate 34% unrealized loss. However, in stark contrast to the capital withdrawals from the ETF channel, the on-chain native staking demand for Ethereum has conversely heated up amidst the plunge: as of early November, there were as many as 986,847 ETH waiting to be staked in the activation queue for Ethereum validators, while only 4,320 ETH waiting to exit, indicating that long-term whales on-chain are not following Wall Street ETF fund managers in panic selling but instead are locking in chips into staking contracts at low coin prices.
Where Is Bitcoin (BTC) Headed? Repair Conditions and Tests at $70,000 After Breaking $75,451 Support
Following the drop from November 8 to 9, Bitcoin faces the most severe support test in the second half of 2026 in both technical and on-chain valuation aspects: the current price of $74,133.11 has dropped below two core cost defenses that had sustained for several weeks.
According to the on-chain cost accounting framework of MVRV and realized price, the realized price of short-term holders holding for less than 155 days (STH Realized Price) is at $75,820; meanwhile, the company holding the most Bitcoin globally, Strategy, increased its holding to 849,327 BTC as of November 1, with the overall average purchase price precisely at $75,451. Prior to Bitcoin plummeting from $75,690 to $73,477 on the night of November 8, the $75,451 to $75,820 range had been fiercely defended by the bulls; now, with the price at $74,133, it means that the positions of both the on-chain active buyers who entered within the last five months and Strategy company holding over $64 billion in Bitcoin have all slightly turned to unrealized losses on the books.
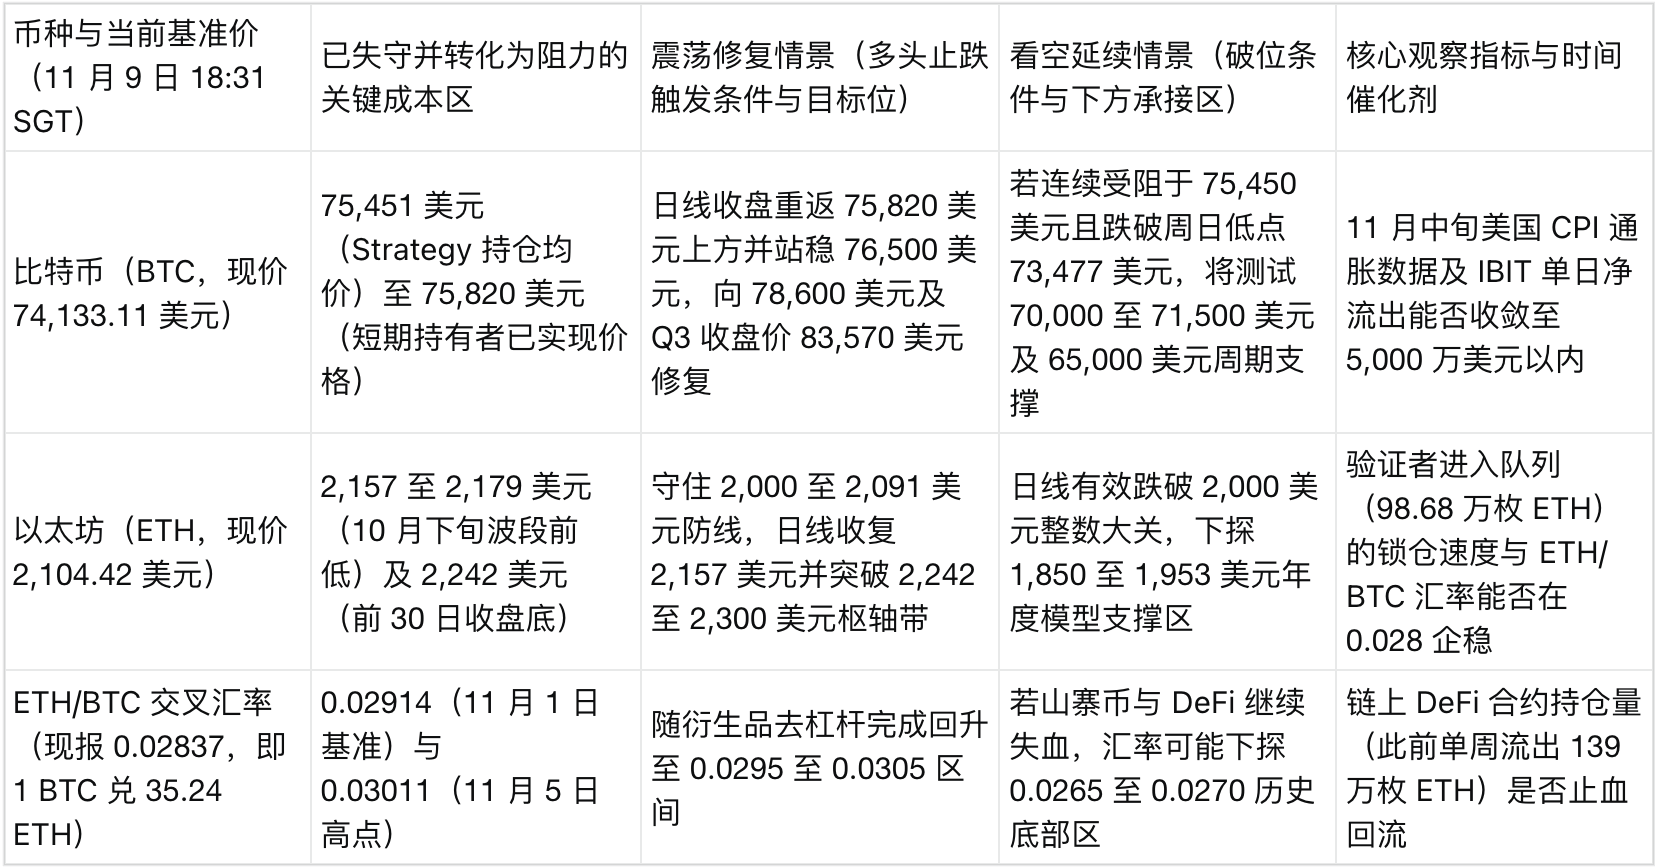
Looking ahead to the next two weeks until the end of November, Bitcoin's price path will revolve around the critical battlefield of $75,451 to $75,820 with three potential scenarios:
The first scenario is a rapid recovery fake breakdown (bear trap). In historical mid-bull cycles, Bitcoin has frequently experienced brief overshoots below the realized price of short-term holders to wash out highly leveraged longs (as seen with the total liquidation of over $2.08 billion on November 6 and November 8). Should Bitcoin attract off-market dollar-cost averaging purchases rapidly after the U.S. stock market opens this week, pushing the daily close back above $75,820 and breaking $76,500, then the dip to $73,477 seen on Sunday night may be confirmed as a liquidity clearance bottom, with prices likely returning to the range of $78,600 to $83,570 in the second half of November.
The second scenario is a deep search for the $70,000 integer level. According to real-time contract pricing on the decentralized prediction market Polymarket as of November 9, market traders currently assign a 46.5% implied probability that Bitcoin will reach $70,000 before the end of November. If this week the U.S. spot Bitcoin ETF continues to maintain a net outflow of $200 million to $400 million daily, causing BTC’s pullback to be resisted in the $75,451 to $75,820 range and breaking below the Sunday low of $73,477, the primary support area below will shift down to $70,000 to $71,500; while a deeper macro safety net is indicated by the $65,000 cyclical support noted in Fidelity's macro model, along with the average on-chain production cost for miners ranging from $53,136 to $58,544 as a hard bottom.
Where Is Ethereum (ETH) Headed? The $2,000 Defense Battle After Losing $2,157 and Trading Strategies
Compared to Bitcoin, which has only retreated about 4.4% since early November, Ethereum has faced greater structural pressure in this round of declines. With Ethereum dropping below the $2,157 to $2,179 low support from late October on the night of November 8 (and the previously defended daily close floor of $2,242), ETH traded at $2,104.42 on November 9, causing the amount of Ethereum that can be exchanged for one Bitcoin to surge from 33.21 ETH on November 5 to 35.24 ETH (the ETH/BTC exchange rate dropping to 0.02837).
The core reasons pressuring Ethereum’s relative performance are threefold: first, its high Beta tech stock characteristic means it was the first line of impact when the Nasdaq index plunged 5.52%; second, the Layer 2 overflow effect has compressed net revenue from the mainnet EIP-1559 (with single-day destruction volume in late October sinking to a single-digit ETH, putting the mainnet in a slight net increase state); third, as previously mentioned, the $448 million in single-day long position liquidations and redemption pressures on ETF buyers below the $3,200 cost line.
Therefore, Ethereum's trajectory in mid to late November completely depends on the success or failure of defending the integer demand zone between $2,000 and $2,100:
In a bearish test scenario, because the daily line has already closed below $2,157, the $2,000 to $2,091 ($2,091 being the Sunday low point) range constitutes a psychological defense line with nowhere left to retreat for the bulls. If the net outflows from ETFs do not slow after the U.S. stock market opens, leading to a breach of the $2,000 integer level, technical selling pressure could push prices toward the annual average support area of $1,850 to $1,953.
In a bottoming reversal scenario, two positive leading indicators for Ethereum are currently functioning: first, the queue of validators waiting to enter staking contracts has reached as high as 986,847 ETH, continuously locking up circulating chips on-chain; second, the $448 million weekend plummet liquidation has thoroughly washed out high-leverage long positions. As long as ETH can hold its ground in the $2,050 to $2,100 range and subsequently reclaim the first resistance at $2,157 and the core pivot area of $2,242 to $2,300 on a daily basis, a significant rebound backed by Citigroup's maintained 12-month target price of $3,028 may be initiated.
In facing the intense competition near critical cost lines for both core assets, investors should strictly control single leverage and transaction fee losses when executing their accumulating or reallocating strategies. On the MEXC platform, traders can use ETH spot trading pairs to place gradual buy orders in the $2,000 to $2,157 range with zero limit order fees, and can also adjust their Bitcoin spot positions near the core cost band of $73,500 to $75,820 with no order fees, allowing them to respond calmly to macro and institutional funding turning points without incurring negative slippage and high order fees.
Exclusive Views from the MEXC Editorial Team
Piercing through the $2.08 billion in derivatives liquidation over the past five days and a plethora of panic-driven headlines, the real structural change occurring in the current crypto market can be summarized in one sentence: the market is undergoing an institutional deleveraging clearance driven by both “delayed expectations of Federal Reserve rate cuts” and “valuation corrections of U.S. AI tech stocks.”
To understand the essence of this downturn, it is essential to recognize two seemingly contradictory yet fundamentally intertwined hard data sets. The first set of data reveals that the cumulative net inflow of U.S. spot Bitcoin ETFs fell below zero on November 5 (turning into a net outflow of $416 million to $502 million). Many commentators interpret this as institutions completely abandoning crypto assets, but in light of the macro backdrop of the Nasdaq's 5.52% plunge on November 5 and the 165,000 surge in U.S. non-farm jobs on November 6 (pressing the unemployment rate back to 4.1%), this actually reflects Wall Street's multi-strategy funds synchronously reducing their exposures in tech stocks and high-volatility risk assets ahead of year-end assessments. As long as the 10-year U.S. Treasury yields remain elevated and expectations for December rate cuts cool, institutions are reclaiming cash in USD by redeeming the most liquid IBIT (with $1.2 billion outflow at the beginning of the month) and ETHA.
The second set of data reflects the divergence between long-term on-chain holdings and short-term leveraged derivatives. In the flash crash on Sunday night, which pushed Bitcoin to $73,477 and Ethereum to $2,091, all $1 billion positions that were forcibly liquidated (with Ethereum accounting for $448 million) consisted of high-leverage contract funds that attempted to capitalize on a short-term rebound over the weekend; meanwhile, on the underlying Ethereum blockchain, there is a staggering 986,847 ETH waiting to enter staking contracts while only 4,320 ETH are queuing to exit, indicating a demand for staking that is 228 times greater than the exit volume.
This means the market has not entered a fundamental collapse but is in a typical “leverage washout and cost turnover period.” The three leading indicators that will determine when the market stabilizes are very clear: first, whether Bitcoin can reclaim the pivotal defense line between $75,451 (Strategy’s average holding price) and $75,820 (short-term holder cost line) within the next three to five trading days, confirming a fake breakdown; second, whether the daily net outflow from BlackRock’s IBIT can converge from the typical $100 million to $400 million down to zero; third, whether Ethereum can hold the $2,000 integer defense point and retake $2,157. Until right-side reversal signals are fully confirmed, abandoning high-leverage market orders and opting for zero-fee limit orders for gradual accumulation at key support gradients is the safest strategy through this macro tumultuous period in November.
Frequently Asked Questions
Why Did the Cryptocurrency Market Experience Consecutive Crashes in Early November 2026?
This round of decline was caused by a quadruple combination of macroeconomic data, tech stock sell-offs in the U.S., net redemptions of spot ETFs, and a weekend liquidity flash crash. The Nasdaq Composite Index plummeted 5.52% on November 5 due to regulatory worries over AI data centers, and on November 6, the U.S. non-farm payrolls surged by 165,000 (well above the expected 65,000 and lowering the unemployment rate to 4.1%), which dampened expectations for Fed rate cuts and triggered the first wave of $1.08 billion in liquidations; later, on the night of November 8, Nvidia's CEO investigation news and stagnant U.S.-Iran negotiations impacted the weak weekend market, causing Bitcoin to drop to $73,477 in just 15 minutes and Ethereum to $2,091, triggering another series of massive long position liquidations exceeding $1 billion.
How Severe Are the Recent Fund Outflows from U.S. Spot Bitcoin and Ethereum ETFs?
According to statistics from Farside Investors, TFTC, and SoSoValue as of November 7, 2026, the U.S. spot Bitcoin ETFs recorded a net outflow of $1.3 billion within the first five trading days of November (including a single-day net outflow of $430.2 million on November 5, with BlackRock IBIT accumulating a $1.2 billion outflow since the start of the month), totaling $1.51 billion in outflows over the past five trading days, officially turning the cumulative net inflow for the entire year 2026 from positive to negative (with net outflows of $416 million to $502 million year-to-date). The U.S. spot Ethereum ETFs also experienced a net outflow of $1.61 billion in October, with seven consecutive trading days of net outflows by November 3, and the average cost for ETF buyers was as high as about $3,200, facing significant unrealized losses.
Why Was the Liquidation Amount for Ethereum Higher Than That for Bitcoin During the Flash Crash on November 8?
During the 15-minute drop on the night of November 8, CoinGlass recorded that Ethereum (ETH) had a liquidation amount of $448 million within the total liquidation exceeding $1 billion, while the much larger market-cap Bitcoin (BTC) had a liquidation amount of $272 million. This inverted result occurred because Ethereum dropped over 6.4% on that day after losing the critical supports at $2,242 and $2,157 (significantly larger than Bitcoin’s approximate 2.4% drop), leading to concentrated liquidations of previously high-leverage ETH long positions that had been trying to bottom fish on surges above $2,200.
After Bitcoin Falls Below $75,000, What Are the Key Support Levels and Rebound Trigger Levels Below?
As of November 9, 2026, Bitcoin was trading at $74,133.11, having fallen below the realized price of short-term holders ($75,820) and the average holding price of the world's largest corporate Bitcoin treasury Strategy ($75,451). For bulls to reverse the downward trend, they must close above the $75,451 to $75,820 range on a daily basis, after which they can target a recovery toward $78,600 and $83,570; if they continue to be blocked below $75,450 and fall below the Sunday low of $73,477, the key support below will be at $70,000 to $71,500 (with a 46.5% probability that it will reach $70,000 before the end of November, according to Polymarket) and then the $65,000 cyclical support level.
Will Ethereum Continue to Fall Towards $2,000 After Dropping to Around $2,100?
As of November 9, 2026, Ethereum was trading at $2,104.42, in a weak bottom-fishing phase after dropping below the prior low at $2,157. The $2,000 integer level to $2,091 (the Sunday low point) constitutes the most critical short-term buying defense area; if the daily line effectively breaks below $2,000, it would test the support range of $1,850 to $1,953 below. However, on-chain data shows that there are currently as many as 986,847 ETH waiting to enter staking contracts (with only 4,320 ETH queueing to exit), and if ETH can hold the $2,000 level and retake $2,157 and $2,242, a rebound is likely to be initiated.
How Do the U.S. October Non-farm Employment Figures (165,000 New Jobs) Affect the Federal Reserve's Decisions in December and the Crypto Market?
The U.S. Bureau of Labor Statistics reported on November 6 that the non-farm employment population increased by 165,000, far exceeding the market expectation of 65,000 and the average of 48,000 over the past year, while the unemployment rate dropped to 4.1%. As two members had already voted in favor of rate hikes while maintaining the 3.75% to 4.00% interest rate on October 28, this overheated employment data boosted the U.S. dollar index and Treasury yields, reducing the possibility of the Fed loosening monetary policy during its meeting on December 8 and 9, thus suppressing the valuations of interest-free or low-interest-risk assets like Bitcoin and Ethereum in the short term.
Disclaimer
This article is for general informational reference only and does not constitute investment advice, financial advice, legal advice, tax advice, or any trading recommendations. The prices of crypto assets, stocks, and other related financial assets may experience significant volatility. Historical data, company disclosures, and third-party expectations cited in the text do not guarantee future results, and the market expectations and third-party estimates do not represent actual results; relevant figures may change with subsequent disclosures and revisions. Readers should conduct their own research and make independent judgments based on their financial situation, investment goals, and risk tolerance, and consult qualified professionals as necessary. The MEXC Crypto Pulse team is not liable for any direct or indirect losses resulting from the use of information contained in this article.
免责声明:本文章仅代表作者个人观点,不代表本平台的立场和观点。本文章仅供信息分享,不构成对任何人的任何投资建议。用户与作者之间的任何争议,与本平台无关。如网页中刊载的文章或图片涉及侵权,请提供相关的权利证明和身份证明发送邮件到support@aicoin.com,本平台相关工作人员将会进行核查。


