Crypto Circle Academician: On November 14, the oversold rebound in the bearish trend of Ethereum (ETH), why position and exit are more important than direction
This article provides a structured review of the current situation of Ethereum. It presents a technical analysis that is suitable for friends who want to clarify their thoughts. First, I will explain the current market background in plain language; then, I will analyze the price, moving averages, MACD, and Bollinger Bands data from the daily timeframe; I will provide two sets of reference plans for bulls and bears, indicating their respective stop-loss and target levels; if you can clearly judge "what trend we are in now, what the key positions are, and what to do if we are wrong" after reading, this article will have been worth writing.
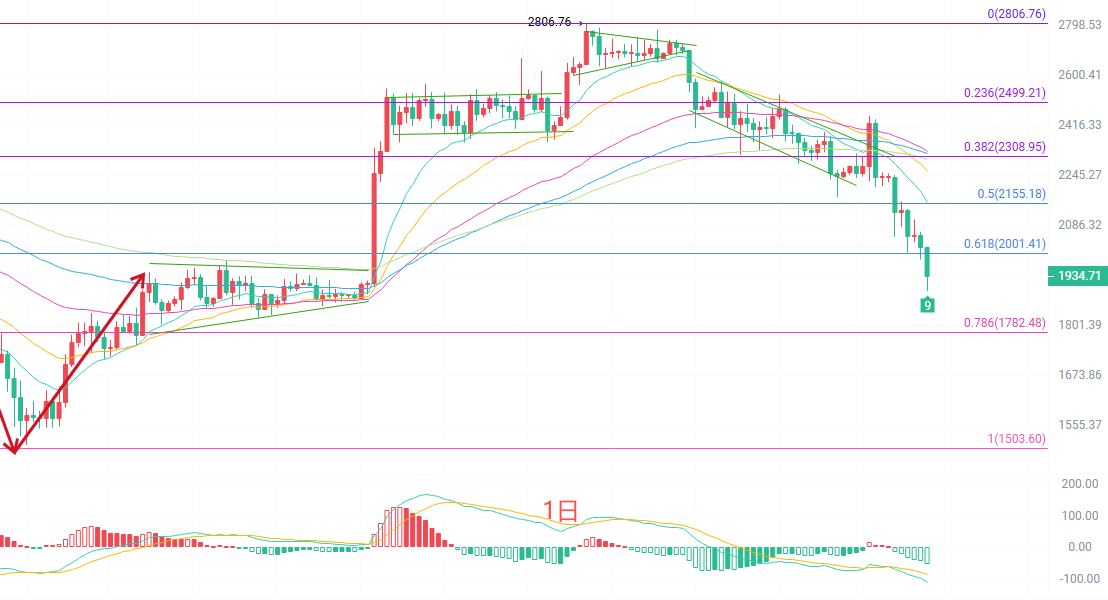
The daily candlestick TD structure has formed a 9. The price has fallen below all EMAs, with the short, medium, and long-term moving averages in a bearish arrangement. The MACD double line continues to open downwards below the zero axis. The Bollinger Bands are diverging downwards, with the middle band at 2218, the upper band at 2464, and the price having dropped below the lower band at 1972. Overall, the daily chart is still in a clear downward trend, and the rebound has not changed the structure; the low point of 1893 is presently the closest defensive line for both bulls and bears.
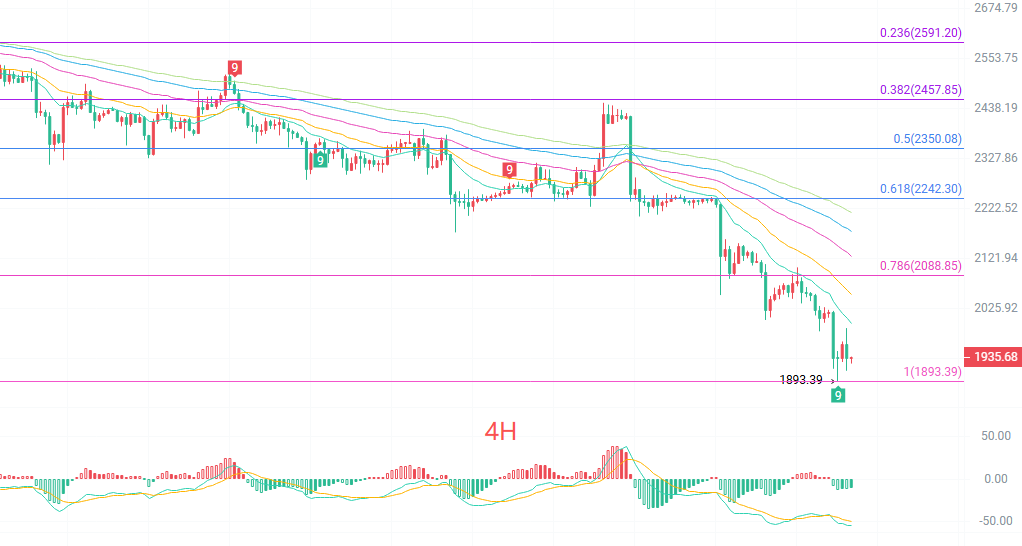
The four-hour candlestick moving averages are still pressing down on the price: EMA15 reports 1997, EMA30 reports 2052, EMA60 reports 2126, EMA90 reports 2175, EMA120 reports 2214, and the bearish arrangement has not changed. The MACD's downward momentum has weakened, but the double line is still below the zero axis. The Bollinger Bands' lower band is at 1918, the middle band at 2018, and the upper band at 2119, with the price operating close to the lower band. There is weak stabilization above 1893 in the short term, but to confirm a rebound, it needs to first return above the middle band and the EMA15, otherwise it can only be regarded as a consolidation during a decline.
Short-term references:
For upward movement from 1920 to 1880 facing resistance, stop-loss at 30 points, target from 1980 to 2030.
For downward movement from 2020 to 2060 experiencing stagnation, stop-loss at 30 points, target from 1980 to 1930.
Specific operations should be based on real-time data on the market; for more information, please consult the author. The article may have delays in publication; it is recommended for reference only, and risks are to be taken by yourself.
Kind reminder: The above content is updated simultaneously by Crypto Circle Academician across major trading platforms such as Binance, OKEx, and Huobi. More content can be accessed by adding me as a friend in Binance OKEx and joining my fan group.
免责声明:本文章仅代表作者个人观点,不代表本平台的立场和观点。本文章仅供信息分享,不构成对任何人的任何投资建议。用户与作者之间的任何争议,与本平台无关。如网页中刊载的文章或图片涉及侵权,请提供相关的权利证明和身份证明发送邮件到support@aicoin.com,本平台相关工作人员将会进行核查。