Crypto Circle Scholar: On November 14, the oversold signal for Bitcoin (BTC) appeared, but will the bearish pattern really come to an end?
When a large bearish candle drops, the two most common mistakes are: either panicking and selling at the lowest point, or rushing to buy halfway up the slope. The points on the chart are fixed, but human emotions are fluid. For short-term trading, strictly enter and exit based on signals; for swing trading, take the 4-hour fluctuations less seriously. Do not borrow money, do not increase positions to average down, do not place all margin in one direction. The text is merely a review of the market and does not constitute any investment advice; contracts carry high risks. Think clearly before entering with real money, and take responsibility for your own profits and losses.
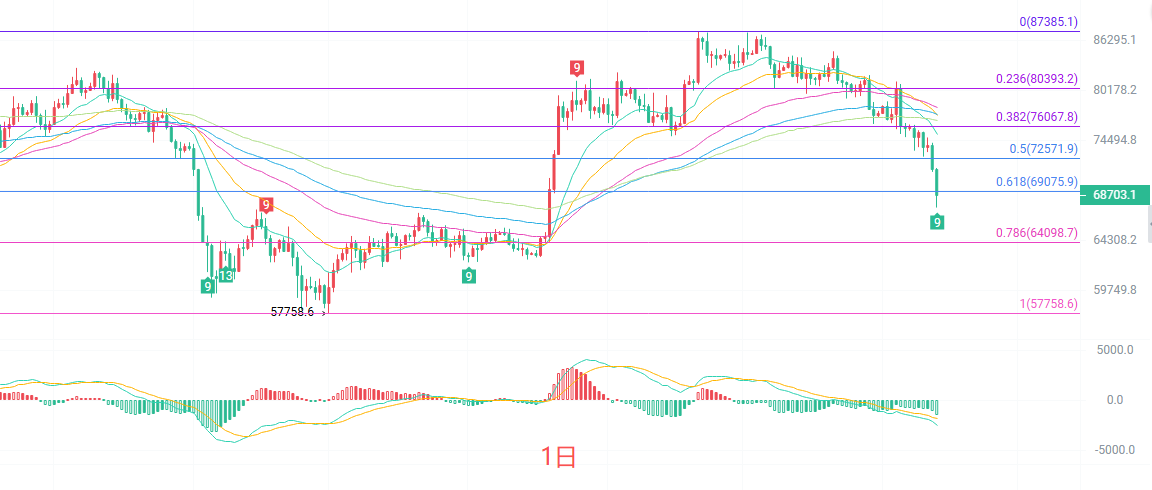
The daily candlestick has fallen below all the short- and medium-term moving averages such as EMA15, EMA30, and EMA60, with the moving averages in a bearish arrangement exerting pressure; the lower Bollinger Band at 70432 has been broken, with prices running outside the lower band. In terms of MACD, bullish momentum continues to be suppressed. The TD sequence has appeared as 9 on the daily chart, indicating short-term oversold signs, but without regaining key moving averages and the lower Bollinger Band, the daily level remains weak; any potential rebounds should be viewed more as a correction following the decline.
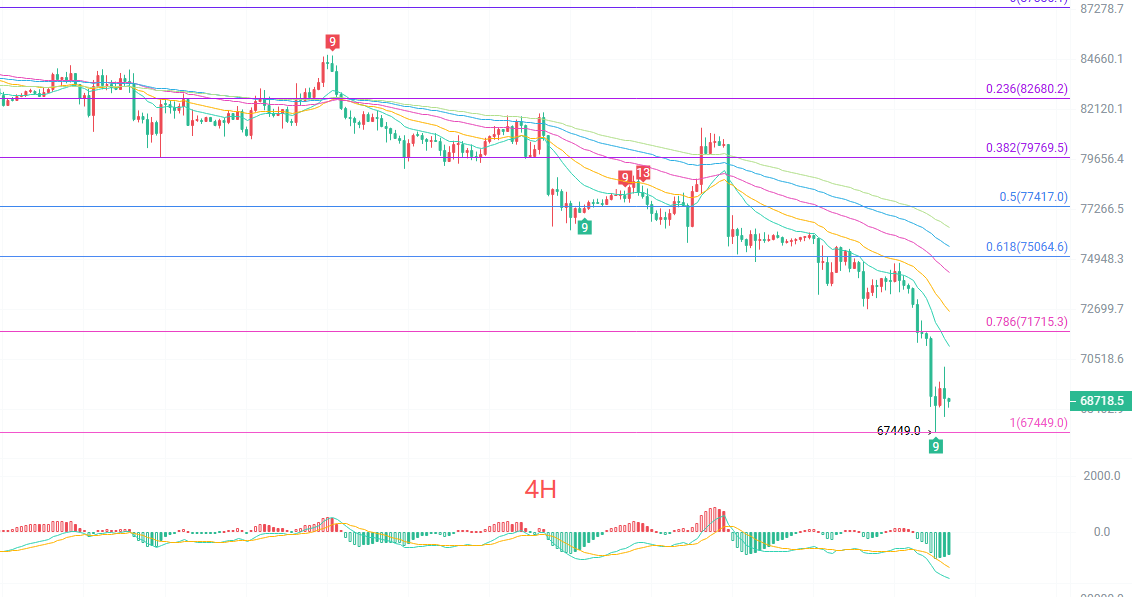
The four-hour candlestick is below EMA15 at 71093, EMA30 at 72598, and EMA60 at 74345, with short- and medium-term moving averages diverging downwards, creating multiple layers of resistance above for any potential rebounds. The Bollinger Bands are opening downwards, with prices near the lower band at 68044, and the middle band at 76353 moving downward. The MACD's rate of decline has slowed; the TD sequence has shown a 9 at a low level, which is a signal to observe after short-term overselling, indicating possible technical rebounds after continued downward movement, but whether these rebounds can sustain will depend on volume and the recovery of the moving averages.
Short-term Reference:
For the upward move from 67500 to 67000 that faced obstacles, stop loss at 500 points, target at 68500 to 70000.
For the downward move from 71200 to 71700 that stagnated, stop loss at 500 points, target at 70000 to 69000.
Specific operations should be based on real-time market data. For more detailed information, you can consult the author. There may be delays in article publication; the suggestions are for reference only, with risks borne by the reader.
Friendly reminder: The above content is synchronized and updated on major trading platforms such as Binance, Ouyi, Huobi, etc. For more content, you can add me as a friend in Binance Ouyi to join my fan group.
免责声明:本文章仅代表作者个人观点,不代表本平台的立场和观点。本文章仅供信息分享,不构成对任何人的任何投资建议。用户与作者之间的任何争议,与本平台无关。如网页中刊载的文章或图片涉及侵权,请提供相关的权利证明和身份证明发送邮件到support@aicoin.com,本平台相关工作人员将会进行核查。