Original author: Glassnode Insights
Original translation: Shenchao TechFlow
Introduction: After more than a month of narrow fluctuations, the cryptocurrency market experienced a new round of brutal deleveraging washout last weekend. Bitcoin fell about 13% in a week, briefly piercing $63,000, marking the most extreme single-day volatility in months.
Glassnode pointed out in the Week 47 Market Pulse report that although the overheated leverage in the derivatives market has been largely cleared, the continuous withdrawal of spot ETF investors is pushing the entire sector towards a critical tipping point. The average holding MVRV of ETFs has approached the break-even line of 1.0.
On-chain micro data shows that loss pressure is mainly concentrated among new players who recently entered the market, with short-term holders overall facing unrealized losses. This article provides a panoramic view of off-chain derivatives and on-chain fundamental indicators, clarifying the true chip structure after this substantial drop.

Market Overview: Deleveraging Storm and Chip Liquidation Tide
Bitcoin maintained fluctuations around $64,000 on Monday, after a cumulative decline of about 13% in the previous week's close. This sharp decline began last Thursday and accelerated over the weekend. On Saturday, the price briefly dropped below $63,000, marking a new low since late August.
This concentrated selling wave quickly cleared the substantial leverage that had accumulated in the derivatives market over the past few weeks. The total open interest in perpetual contracts has slid down to the lower edge of the statistical range, while the funding rate for longs, which had remained in a high warning zone for several weeks, finally significantly cooled down to a neutral range.
Meanwhile, U.S. spot ETF investors continued to experience net outflows, recording capital withdrawals on every trading day over the past week. The overall MVRV metric of the ETF quickly declined to 1.06, extremely close to the comprehensive break-even benchmark for holders.
On-chain underlying activity remains relatively active, with the number of daily active addresses and the scale of large transfers showing resilience. However, the paper losses are almost entirely borne by the group of holders who entered the market in recent months, with short-term holders fully transitioning to unrealized losses, and the scale of realized losses reaching the highest peak since July this year.
Off-chain Derivatives Indicators: Contract Holdings Drop to Freezing Point and Put Options Surge
From the perspective of aggregated monitoring of off-chain spot and derivatives, the market shows significant risk release characteristics after enduring a selling baptism.
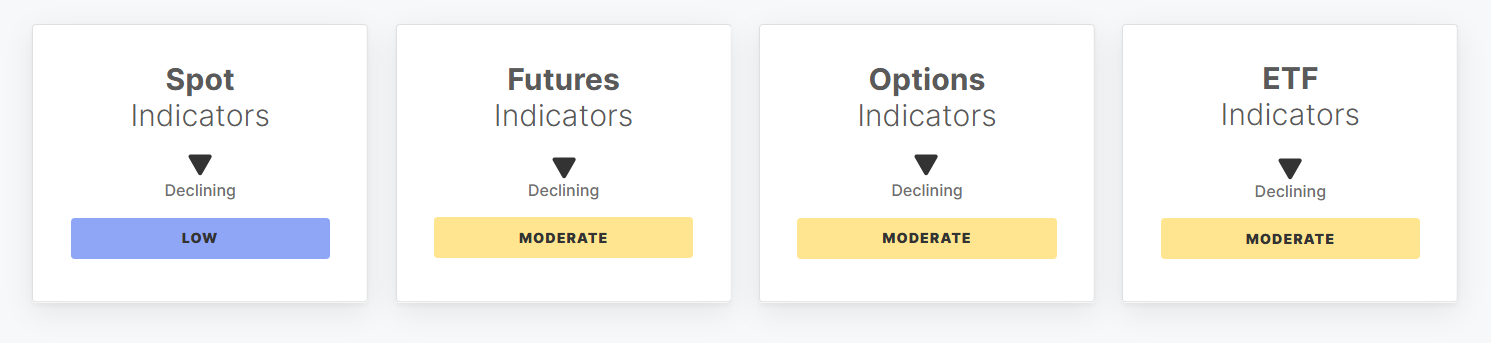
Figure: Key Indicators Overview of Bitcoin Off-chain Spot, Futures, Options, and Spot ETF
The spot momentum indicator (Price Momentum) plummeted 36.1% from 35.6 a week ago to 22.8, continuously probing lower after breaking below the lower limit range last Wednesday, recording its weakest reading since August.
The spot cumulative trading volume difference (Spot CVD) further deteriorated from -$51.5 million to -$133.7 million, with active sell orders showing strong downward pressure from last Thursday to Saturday, only gradually slowing down by Sunday.
The total open interest in futures contracts (Futures Open Interest) fell by 7.2% from the previous week to $34.2 billion, also hitting the lower boundary of the range. The active selling pressure of perpetual contracts (Perpetual CVD) expanded from -$493 million to -$1.4 billion, reflecting the dual stampede faced by speculative longs experiencing forced liquidation and active stop-loss.
In the options market, the 25-Delta skew rate (Skew) soared by 30.9% to 13.7%, setting a record for bearish premiums since August, reflecting strong demand for out-of-the-money put options to hedge against downside risks.
Despite the weekly net outflow scale of the U.S. spot ETF narrowing slightly to -$995.4 million, it still remains at the bottom of the range; the total weekly trading amount dropped to $11.5 billion, with institutional allocations still opting for cautious defense at the turning point.
On-chain Fundamental Insight: Short-term Holders' Unrealized Losses and Hot Capital Proportion Peaks
Delving into on-chain underlying data, network security and asset transfer continue to maintain basic operations, but the liquidity and profit-loss structure of capital stock have undergone profound reversals.
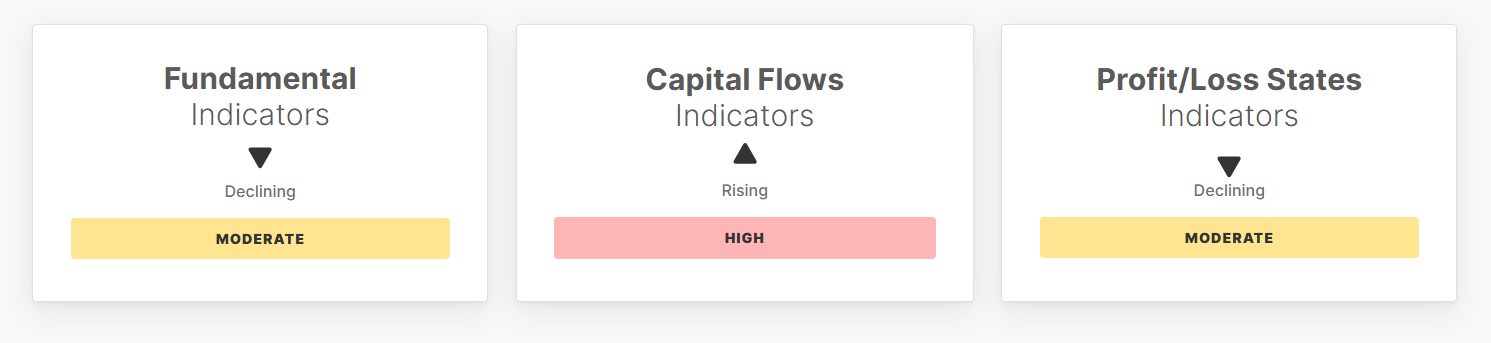
Figure: Key Dashboard of Bitcoin On-chain Fundamentals, Capital Flows, and Unrealized Profit and Loss Status
On-chain transfers and activity scale remain high, with daily transfer volume increasing by 3.6% to $5.4 billion, approaching the upper limit of the range; the number of daily active addresses across the network is approximately 659,700, slightly retreating after mid-week peaks, but overall remains within a healthy range.
However, the monthly growth rate of realized market capitalization has nearly stagnated, plummeting from 0.43% a week ago to 0.04%, indicating a significant slowdown in the inflow of new external funds.
The supply ratio of short-term holders to long-term holders (STH to LTH Supply Ratio) has slightly risen to 15.1%, and the proportion of hot capital in the total market capitalization (Hot Capital Share) remains high at 22.0%, suggesting that young chips bought in the last three months still hold considerable trading weight.
In terms of profit and loss status, the proportion of tokens in profit across the network dropped from 60.4% to 55.3%. The unrealized net profit and loss ratio of short-term holders (STH-NUPL) has shifted from positive to negative, dropping to -7.4%, which historically corresponds to typical zones of capitulatory turnover.
Outlook and Key Observation Tipping Points
From a comprehensive perspective of on-chain and derivatives, this round of crash is essentially a deleveraging process triggered by continuous reduction of spot ETF holdings, short-term speculative long liquidations, and macro risk aversion sentiment.
Currently, both the contract open interest and funding rates have detached from the dangerous overheated highs, and the pure leverage risk at the derivatives level has been significantly cleaned up. However, the timing of the net outflow of the spot ETF turning positive, and whether the stop-loss liquidation among short-term holders will spread to long-term investors, will be the decisive forces in determining whether the $64,000 level can be established as a solid bottom structure.
免责声明:本文章仅代表作者个人观点,不代表本平台的立场和观点。本文章仅供信息分享,不构成对任何人的任何投资建议。用户与作者之间的任何争议,与本平台无关。如网页中刊载的文章或图片涉及侵权,请提供相关的权利证明和身份证明发送邮件到support@aicoin.com,本平台相关工作人员将会进行核查。


