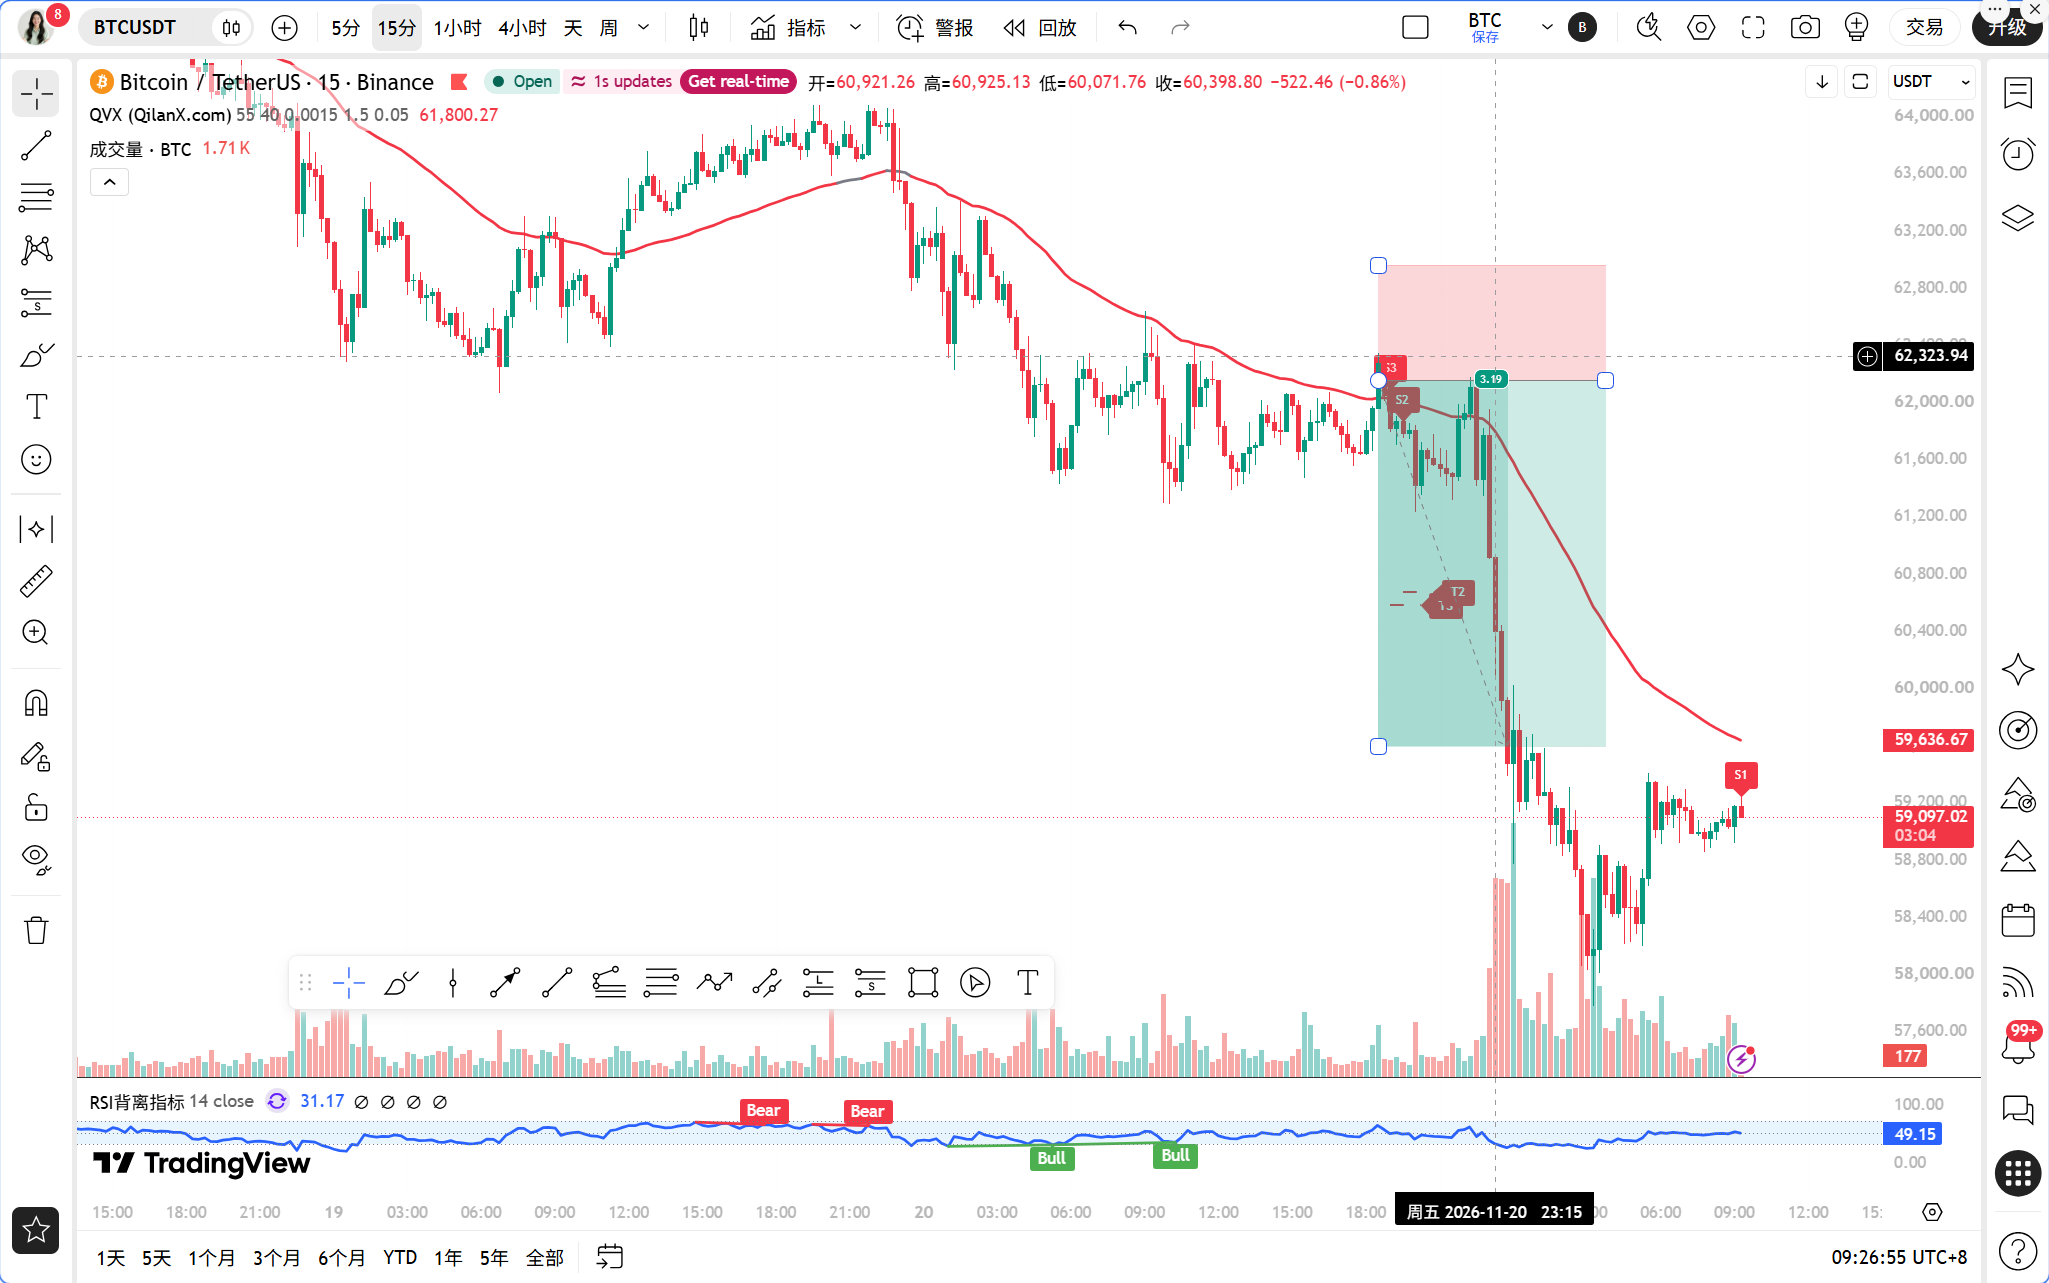
Dear teammates, this morning when I opened the market, two pieces of news hit hard. The first is that Bitcoin has fallen below $59,000, with $770 million liquidated in one hour, leading to large-scale liquidation of long positions and a sharp rise in market panic. The second news is that Tether has destroyed $8 billion USDT in 20 days, with the stablecoin market cap shrinking by $23.25 billion, clearly indicating capital withdrawal. These two pieces of news together basically define the nature of today's market: this is not an ordinary correction but a chain reaction of liquidity contraction combined with leveraged liquidation. Qinglan Crypto Classroom has always emphasized that news determines sentiment, and technical aspects determine positions; when the two resonate, the credibility of trading signals is highest. Today is such a resonance day.
Current Price and Time
The time is November 21, 09:24, with BTC quoted at 59124 USDT. The 24-hour decline is 5.32%, with a market share of 57.84%. The Fear and Greed Index is at 12, in the extreme fear zone. This reading is not itself a buy or sell signal, but it indicates that market sentiment has entered an irrational area, and any rebounds and declines will be amplified.
Multi-Timeframe Overview
First, let’s look at the daily chart. The daily MA5 is at 61615.52, MA10 is at 64223.55, MA30 is at 73292.41, the moving averages are in a very standard bearish arrangement. The daily MACD’s DIF is at -5037.23, DEA at -3989.42, and the histogram at -1047.82, indicating that bearish momentum is still expanding. The daily RSI is only 10.31, which is an extremely oversold reading; historically, such values are often followed by technical rebounds, but a rebound does not equal a reversal, and the direction remains downward.
Next, let's look at the 4-hour chart. The 4-hour MA5 is at 59583.49, MA10 is at 60939.48, MA30 is at 63142.23, and the price operates below all moving averages. The 4-hour MACD’s DIF is at -1625.46, DEA is at -1323.49, and the histogram at -301.97, indicating a complete bearish structure. The 4-hour RSI is at 25.82, also in the oversold area, but no bullish divergence has appeared yet.
The 1-hour level is the core reference of the TPV system. The 1-hour MA5 is at 59059.09, MA10 at 58945.05, and MA30 at 60827.13, and the short-term moving averages are beginning to flatten, indicating a slowdown in the downtrend. The 1-hour MACD’s DIF is at -916.39, DEA at -884.17, and the histogram at -32.22; note that this histogram has become very small, indicating that bearish momentum is diminishing. The 1-hour RSI is at 25.56, showing a slight rebound from lower levels. The key data is that the 1-hour EMA55 is at 61473.88, with the current price at 59124, which still has a gap of 3.82% from the EMA55.
The 15-minute level has shown some signs of short-term stabilization. The 15-minute MA5 is at 59097.08, MA10 is at 59057.19, and MA30 is at 58853.39, with the price standing above the short-term moving averages. The 15-minute MACD’s DIF is at -59.33, DEA at -124.52, and the histogram at +65.20, which has turned red, indicating that short-term rebound momentum is present. The 15-minute RSI is at 55.31, returning to the neutral zone.
TPV Signal Verification
According to the rules of the Qinglan TPV system, we will check them one by one. In terms of trend positioning, the current price of 59124 is clearly below the 1-hour EMA55 at 61473.88, falling into the bearish trend area, which is undisputed.
The conditions to go long need to meet three criteria simultaneously. First, the price must stabilize above the 1-hour EMA55; this requires two consecutive 1-hour candlestick closing prices to be above 61473.88, which is currently not satisfied. Second, there needs to be a stabilization pattern; the 15-minute level is showing short-term stabilization, but the 1-hour level has not yet produced an effective bottom formation or volume increase to halt the decline. Third, the downward momentum must be exhausted; the 1-hour MACD histogram at -32.22 is indeed shortening, and the RSI has rebounded from low levels, this condition is partially satisfied. However, only one of the three is satisfied, making the long signal invalid.
The conditions to go short also require all three criteria to be satisfied. First, the price must face pressure below the 1-hour EMA55, with two consecutive 1-hour candlestick closing prices below 61473.88; this condition is completely satisfied. Second, there must be a resistance pattern where the price has encountered resistance multiple times during the rebound, with upper shadows on the 1-hour level, basically meeting this condition. Third, the rebound's weakness; the shortening of the 1-hour MACD histogram indicates diminishing bearish momentum, and the RSI has rebounded from low levels, this condition is not satisfied, leaning instead towards momentum exhaustion. Therefore, the short signal is also incomplete.
In terms of judging whether the market is in a range, out of the last 8 1-hour candlesticks, the number of closing prices above EMA55 is 0/8, with 0 crosses; the price is 3.82% away from EMA55, far exceeding the threshold of 0.3%, not fitting the definition of a range, and the system judges it to be in a one-sided trend. However, note that this is the end area of the bearish one-sided trend, not the starting point.
In summary, the TPV system currently indicates the following signals: the bearish trend is clear, but signs of momentum exhaustion have appeared; long conditions are insufficient, and short conditions are also incomplete, falling into a vacuum signal area. At this time, it is crucial not to chase rises or falls; one should wait for the price to approach EMA55 or for a clear stabilization pattern to act.
On-chain/Fundamentals
On-chain data is bearish but shows extreme values. The Fear and Greed Index is 12, indicating extreme fear; historically, this position often corresponds to a phase bottom region, but a bottom is a range, not a point. BTC's 24-hour decline is 5.32%, categorized as a sharp fall. The market share is 57.84%, indicating that funds are concentrating on BTC, which suggests that the market is seeking safety rather than a complete withdrawal.
There are a few details in the fundamentals worth noting. Tether has destroyed $8 billion USDT, with the stablecoin market cap shrinking by $23.25 billion, which signals a tightening of liquidity. BlackRock has deposited $456 million of BTC and ETH into Coinbase Prime; significant deposits into exchanges are usually interpreted as potential selling pressure. Strategy's position is at a floating loss of $13.57 billion, with an average price of $75,452; deep floating losses for whales can raise concerns about market liquidation. The liquidation map indicates that dropping below $57,000 will trigger the liquidation of 180 million long positions, with a dense liquidation area below representing the biggest risk in the short term. Funding rates indicate strong bearish sentiment in the market; this, in extreme situations, could trigger short covering.
Key Resistance and Support Levels
The first resistance level above is in the range of 59583 to 59600, which is the position of the 4-hour MA5 and the first resistance for a short-term rebound. The second resistance level is at 60827, which is the 1-hour MA30. The core resistance level is at 61473.88, which is the 1-hour EMA55; this position serves as the dividing line for bulls and bears in the TPV system. If the price does not stand above this level, all rebounds can only be defined as corrections.
The first support level below is at 58853, the position of the 15-minute MA30. The second support level is near 58500, representing a short-term lower low area. The critical support level is at 57000, which is marked as the dense liquidation area on the liquidation map; if this level is lost, the risk of a chain sell-off will significantly increase.
Trading Ideas
Direction judgment: Momentum exhaustion phase in a bearish trend; do not chase shorts or attempt to catch a bottom, wait for signals.
Long idea: Consider entering if either of the two conditions is met. The first is that the price pulls back to the 58500 to 58800 range, producing a long lower shadow at the 1-hour level or a bottom formation, while the 1-hour MACD histogram continues to shorten. A small position can be tested long, entering around 58500 to 58800, with a stop-loss at 57800 and targets first at 59600, then at 60800. The second is that the price strongly stands above the 1-hour EMA55 at 61473.88; if two consecutive 1-hour candlestick closing confirmations occur, and the pullback does not break, one can go long with the trend, entering near 61500, stop-loss at 60800, and a target of 62500 to 63000. The second signal is more stable but at a higher position; the first signal is earlier but carries more risk, so teammates should choose according to their positions and risk preferences.
Short idea: Currently, it is not recommended to chase shorts. If the price rebounds to the 60800 to 61400 area, producing a long upper shadow or top formation at the 1-hour level while the 1-hour RSI falls from high levels, one may consider shorting, entering between 60800 and 61400, with a stop-loss at 61800 and targets at 59600 to 59000. Note that this short is a counter-trend rebounding short, not a trend short, so take profits when achieving a good position.
Range idea: If the price hovers between 58800 and 59600 for more than 8 1-hour candlesticks and the number of closing prices crossing EMA55 increases, the system will switch to a range mode, and at that time, only high sell and low buy within the range will be made, without actively chasing positions.
Risk Reminder
Rebounds may happen at any time with extreme fear readings, but before the trend reverses, any long position is a counter-trend operation, and strict stop-loss is the baseline.
Follow Qinglan Crypto Classroom to grasp more trading opportunities! Welcome to visit the official website www.qinglan.org
📊 Qinglan TPV Trading Strategy Backtesting Reference
🕒 Last Backtest Time 11-21 07:00:06
Total Analysis: 5311 Backtests: 5139 Accuracy: 75.9% (3899/5139)
免责声明:本文章仅代表作者个人观点,不代表本平台的立场和观点。本文章仅供信息分享,不构成对任何人的任何投资建议。用户与作者之间的任何争议,与本平台无关。如网页中刊载的文章或图片涉及侵权,请提供相关的权利证明和身份证明发送邮件到support@aicoin.com,本平台相关工作人员将会进行核查。