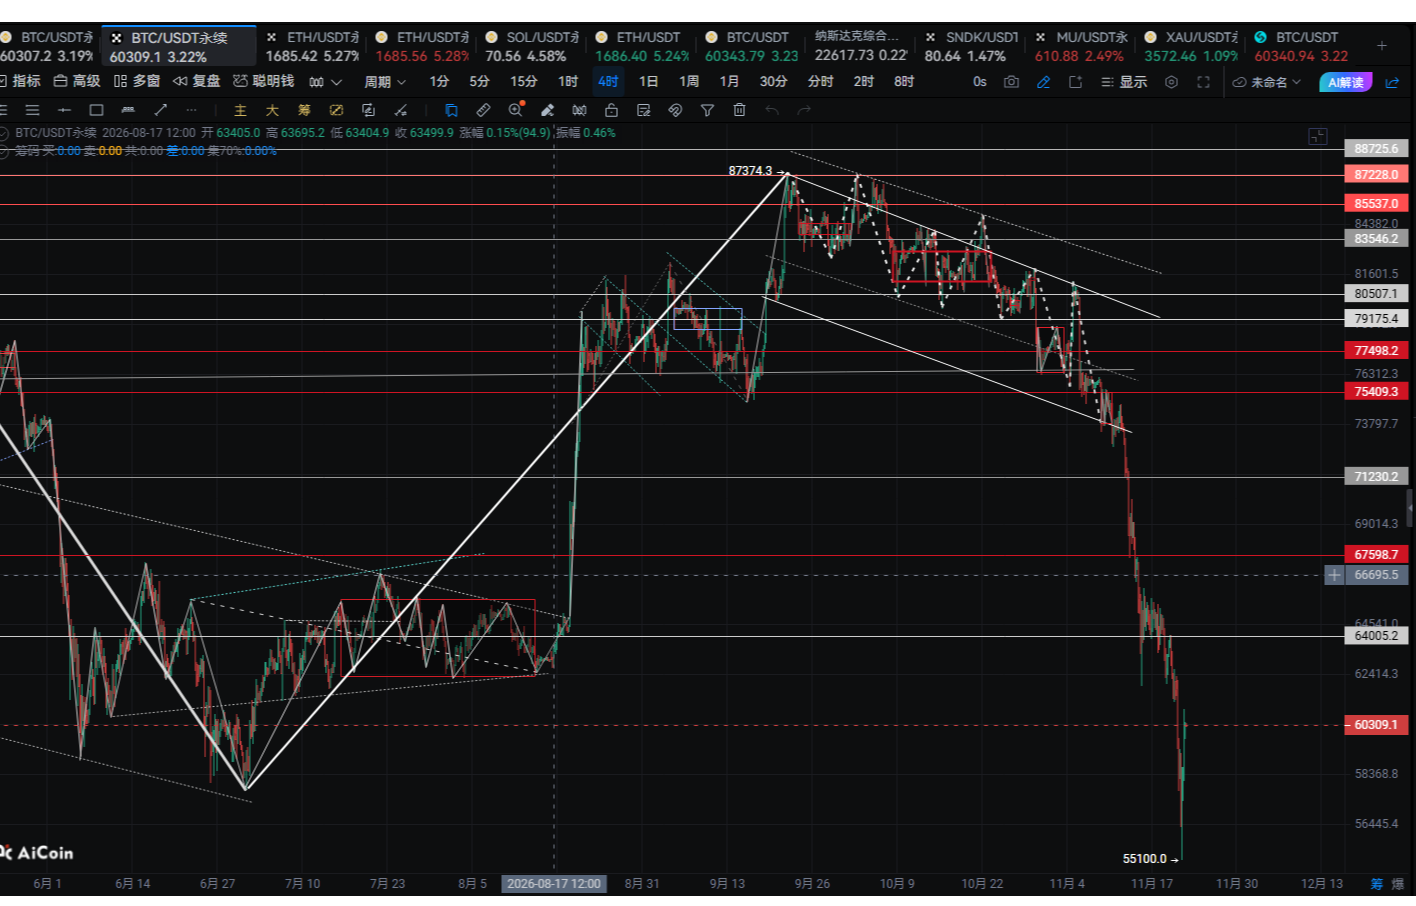
Today, there are two pieces of news that must be viewed together. The first is that whale Garrett Jin has deposited 65 million US dollars in stablecoins into Binance, publicly stating that the time to enter the market has come, which is a real buy signal. The second piece is even more explosive; there is an imbalance in the Bitcoin futures market, with the potential liquidation amount for shorts reaching up to 23.5 billion US dollars, while longs have almost been cleared out. Additionally, with the Fear and Greed Index dropping to 11, indicating an extreme fear zone, and a realized loss of 11.3 billion US dollars over the past week reaching a new high for this round, the market is in a typical capitulatory sell-off ending. But don’t get too excited; the 10.4% weekly drop in the Nasdaq 100 index, a rare sell-off in 40 years, is still pressuring risk assets, and the drop of ETH's market cap out of the global top 100 is also dragging down overall sentiment. The logic for both bulls and bears is very strong, and now it is most important not to act impulsively; we must let the data speak for itself.
Current Price and Time
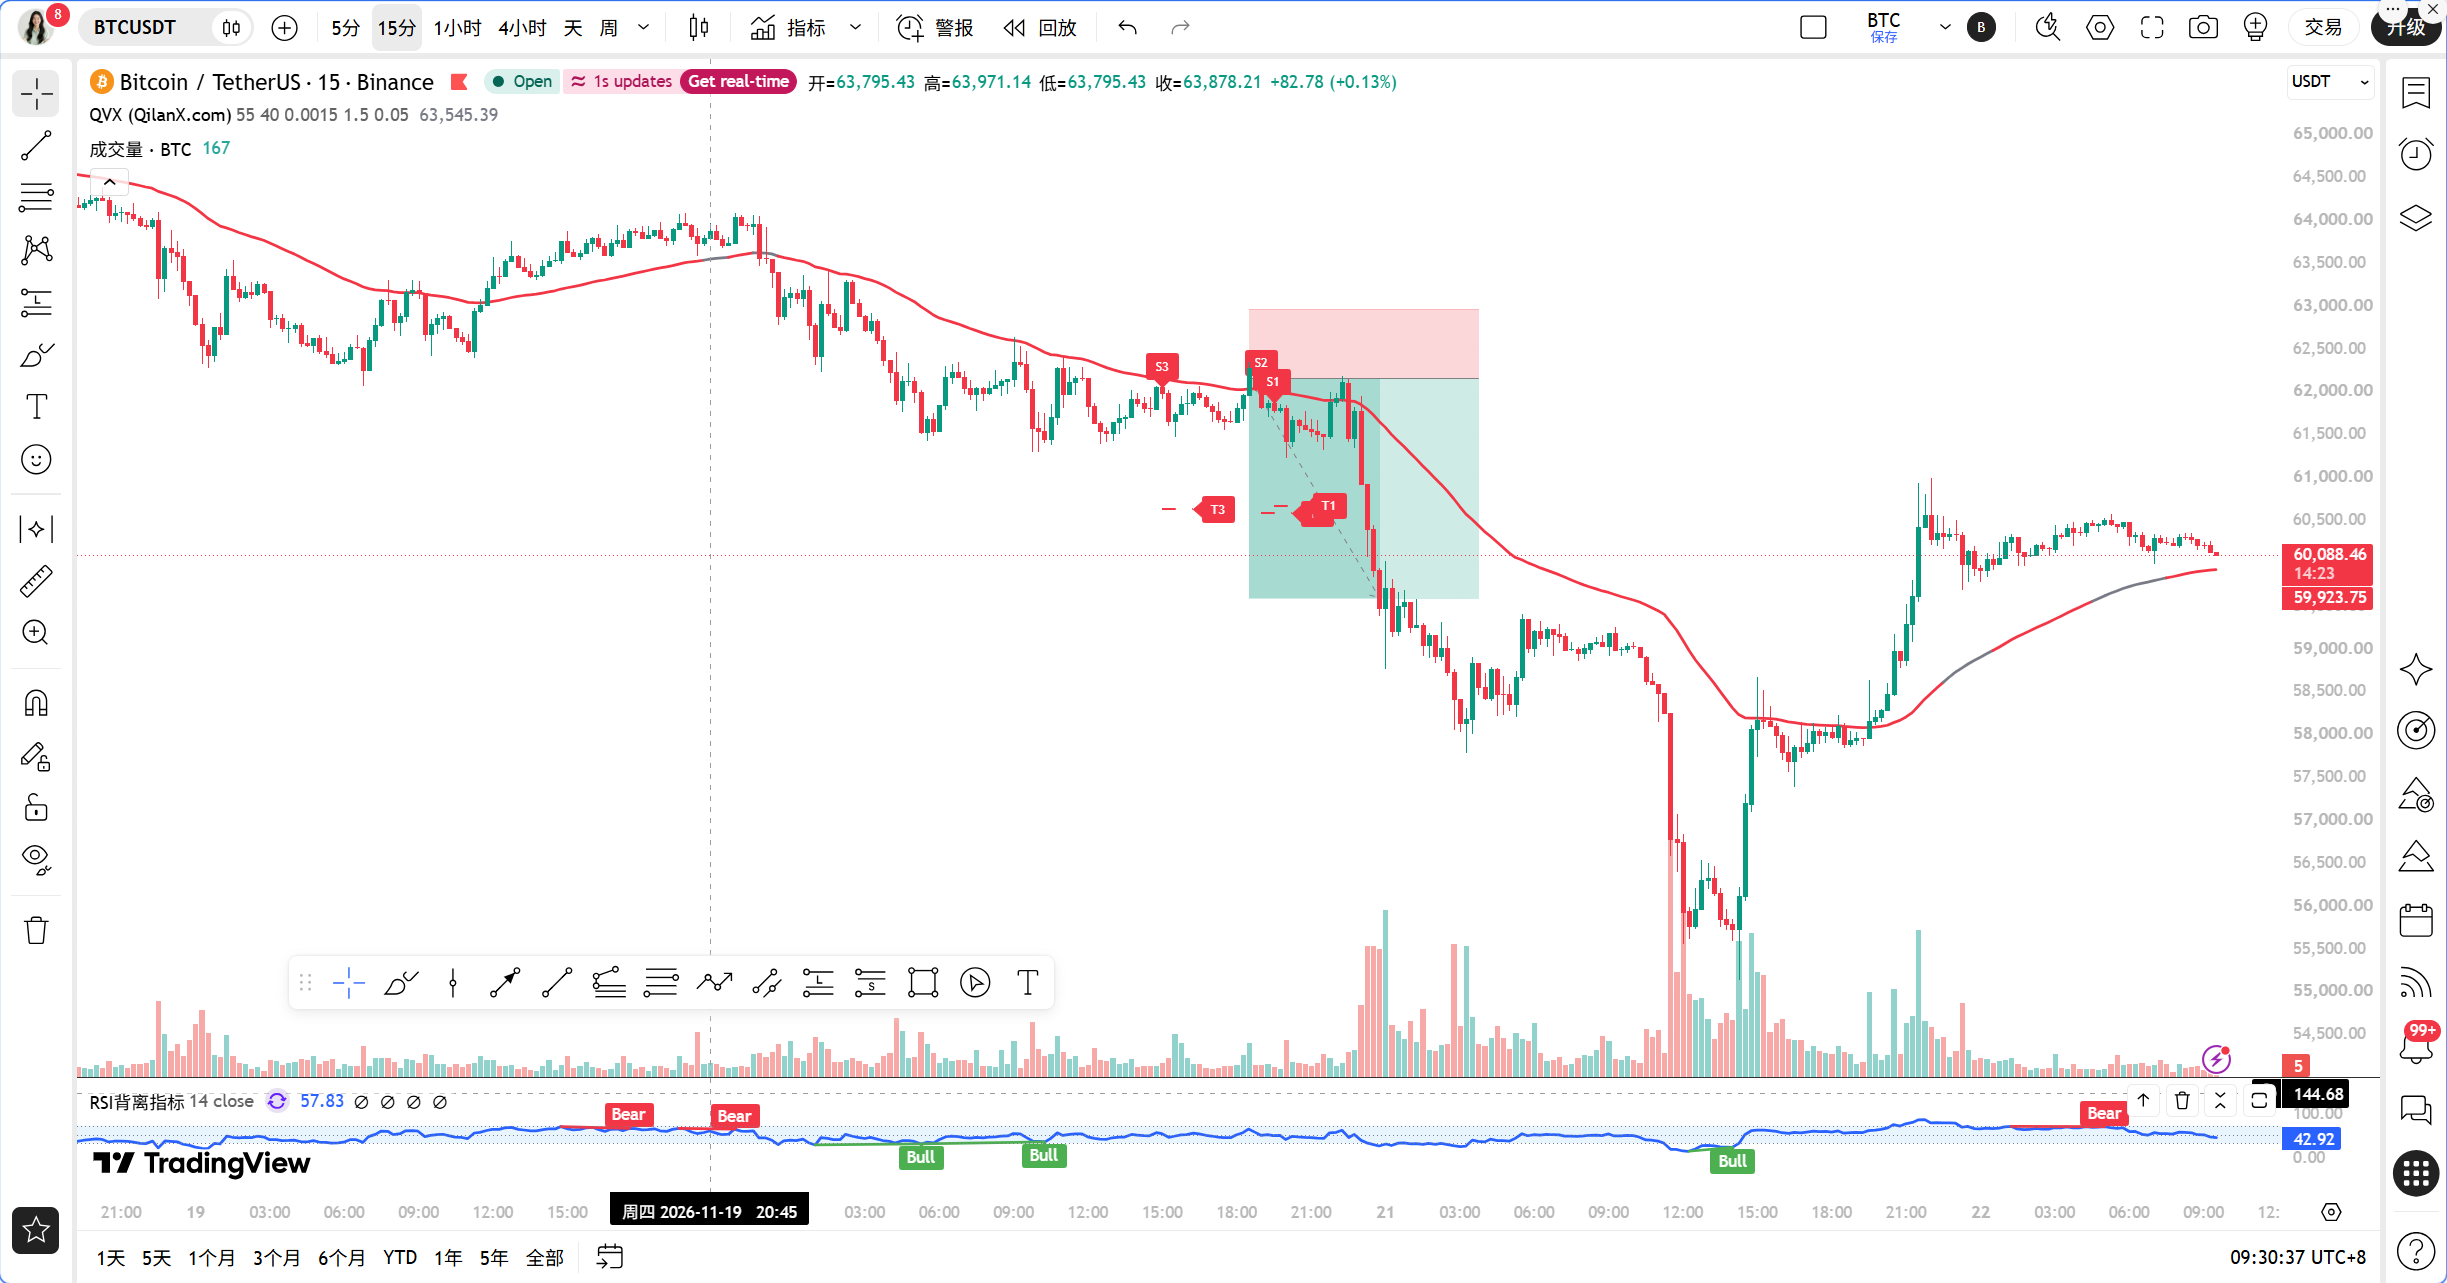
It is now November 22 at 09:29, with BTC priced at 60126 USDT, a 24-hour increase of 1.69%, and a market share of 57.88%. Note this price level; it is just slightly below the 1-hour EMA55 at 60192.84 USDT, with only a 0.11% distance, representing a typical line-sticking fluctuation. This position is most prone to deceiving people; looking like it is about to break out, it drops back when chased; looking like it is about to break down, it rebounds when shorted.
Overview of Multi-Cycle Status
The bearish pattern at the daily level is without suspense. The MA5 is at 60869.75, MA10 at 63199.40, and MA30 at 72626.71, with the moving averages in a bearish arrangement pressing down hard. The MACD’s DIF is at -5000.42, DEA at -4173.36, and the bar value is -827.07, still running underwater. But the RSI is only 15.36, which is deeply oversold, and the rebound momentum at the daily level is accumulating, just not yet at the point of reversal.
There is a glimmer of warmth at the 4-hour level. The MACD bar value is 184.99, has turned positive, with the DIF at -1329.71 and DEA at -1514.70, showing signs of convergence. The MA5 at 59771.22 has already crossed above the MA10 at 59057.92, indicating a short-term moving average start to create a bullish arrangement. But the price is still below the MA30 at 61993.96, with the RSI at 39.43, indicating weak repair, not a strong reversal.
The 1-hour level is currently the most conflicted. The MA5 is at 60236.20, MA10 at 60231.03, and MA30 at 59038.31, with the price sandwiched between MA5 and MA30. The MACD’s DIF is at 256.67, DEA at 127.02, and the bar value at 129.65, with bullish momentum still present. But the RSI has surged to 74.08, entering the overbought zone, indicating a short-term pullback requirement. The EMA55 is at 60192.84, and the price of 60126 is just 66 points below it, a step away.
The 15-minute level has begun to weaken. The MACD bar value at -43.39 has turned green, with the DIF at 28.80 and the DEA at 72.18, and the fast and slow lines have crossed downwards. The RSI is at 29.32, close to being oversold. The MA5 is at 60225.86, MA10 at 60241.47, and MA30 at 60302.12, with the moving averages in a bearish arrangement, indicating clear short-term pressure.
TPV Signal Verification
Let’s first look at trend positioning. The current price of 60126 USDT is less than the 1-hour EMA55 at 60192.84 USDT. According to TPV system rules, it is currently in a bearish trend area. However, there is a key detail here; the price is only 0.11% away from the EMA55, indicating a line-sticking state, which greatly reduces the certainty of the trend.
Next, let’s see the conditions for going long. The first condition requires two consecutive 1-hour candlesticks to have closing prices greater than the EMA55, but the current price is below the EMA55, so this does not meet the requirement. The second condition is stabilization of support; the 15-minute RSI at 29.32 is close to being oversold and has a pullback requirement, but there has not yet been a clear signal of a long lower shadow or bottom formation at the 1-hour level. The third condition is that the downward momentum exhausts; the 1-hour MACD bar value of 129.65 is still expanding, without two consecutive periods of contraction, and the RSI has declined from 74.08 high but has not yet dropped below 30. All three conditions for going long are incomplete.
Now turning to conditions for going short. The first condition requires two consecutive 1-hour candlesticks to have closing prices less than the EMA55; currently, there is only one below it, and by just 0.11%, which does not meet the requirement. The second condition is that pressure encounters resistance; the 1-hour RSI at 74.08 is in the overbought zone and shows signs of a pullback, but there has not yet been a confirmation of a long upper shadow or top formation. The third condition is weak rebound; the MACD bar at the 15-minute level has turned green, but the MACD bar at the 1-hour level is still expanding, not meeting the requirement. All three conditions for going short are also incomplete.
The most critical aspect is the determination of the oscillation. Among the last 8 1-hour candlesticks, the number of closing prices greater than the EMA55 is 5 out of 8, with 4 crosses. The absolute distance of the current price from the EMA55 is 0.11%, which is below the 0.3% threshold. According to the rules of the TPV system, this clearly meets the oscillation market assessment, so we do not actively go long or short but provide a range. This is the most important conclusion today; the system says oscillation, so don’t force a direction.
On-chain/Funds Situation
The Fear and Greed Index is at 11, indicating extreme fear. Historically, this range often corresponds to a phase bottom, but a bottom is an area, not a point. The whale's deposit of 65 million US dollars in stablecoins is a real buy preparation squad, but just because stablecoins are deposited does not mean they are immediately bought, they may just have pending orders waiting for lower prices. The short liquidation amount of 23.5 billion US dollars is a bomb hanging overhead; once the price breaks through key levels upwards, forced liquidations could accelerate rebounds, but the premise is that the price must first break through. The realized loss of 11.3 billion US dollars over the past week reached a new high for this round, indicating that selling pressure has already been released to a large extent, and the cluster of long liquidations between 59000 to 62000 US dollars has been completely cleared, eliminating the sources of forced selling below, albeit the overall structure is improving. However, external pressure from the Nasdaq's 10.4% drop is still present, and ETH’s liquidation risk is also holding back sentiment; the financial situation is mixed with both bullish and bearish factors, showing no one-sidedness.
Key Defense Positions
The first line of defense above is the 1-hour EMA55 at 60192.84 USDT, which is the boundary between bullish and bearish. The price must stand above it and close two consecutive 1-hour candlesticks above it to discuss a bullish trend. The second line is the dense area of the 1-hour MA5 and MA10 from 60231 to 60236 USDT; breaking through this zone could open up upward space. The third line is the 4-hour MA30 at 61993.96 USDT, which is the mid-term pressure point and also the frontline of the bearish liquidation zone.
The first line of support below is the 1-hour MA30 at 59038.31 USDT, which is the last defense line for short-term bulls. The second line is the 4-hour MA5 at 59771.22 USDT; dropping below this level means the restoration trend at the 4-hour level has ended. The third line is around the previous low of 55000 USDT, which is a psychological barrier in extreme cases.
Trading Thought
Direction: Treat as oscillation, do not actively chase longs or shorts, wait until the range boundary to react.
Conditions for Long Entry: Two consecutive 1-hour candlesticks must close firmly above the EMA55, meaning the closing price must be greater than 60192.84 USDT; at the same time, the 1-hour MACD bar value must begin to contract before expanding again, or there must be a confirmation signal of a bullish bottom formation plus a bullish engulfing on the 15-minute chart. The entry reference range is 60250 to 60300 USDT, do not chase high.
Long Stop Loss: Set below the 1-hour MA30, meaning below 59000 USDT; dropping below this indicates the failure of the oscillation range support, and the long logic is invalidated.
Long Target: The first target is 61900 USDT, corresponding to the 4-hour MA30 pressure position; the second target is 62800 USDT, corresponding to the daily MA10 nearby.
Conditions for Short Entry: Two consecutive 1-hour candlesticks must close under pressure below the EMA55, meaning the closing price must be less than 60192.84 USDT; at the same time, the 1-hour RSI must drop from above 74 to below 60, or there must be a confirmation signal of a bearish top formation plus a bearish engulfing on the 15-minute chart. The entry reference range is 60100 to 60000 USDT, do not chase low.
Short Stop Loss: Set above the 1-hour EMA55, meaning above 60400 USDT; if it stands, it indicates that the short logic is invalidated.
Short Target: The first target is 59038 USDT, corresponding to 1-hour MA30; the second target is 58000 USDT, corresponding to below the 4-hour MA10.
Range Operation Thoughts: High sell and low buy between 59038 and 60236 USDT, reduce long positions near the upper edge, reduce short positions near the lower edge, control positions within 30%, and wait to add positions in the direction of the breakout of the range.
Risk Warning
Extreme fear does not mean an immediate reversal; line-sticking oscillations are most susceptible to two-way pin bars, and strict stop-loss is the only lifeline.
Pay attention to the Qinglan Crypto Classroom for more trading opportunities! You are welcome to visit the official website www.qinglan.org
📊 Qinglan TPV Trading Strategy Backtest Reference
🕒 Last Backtest Time 11-22 07:00:02
Total Analysis: 5335 Backtest: 5139 Accuracy: 75.9% (3899/5139)
免责声明:本文章仅代表作者个人观点,不代表本平台的立场和观点。本文章仅供信息分享,不构成对任何人的任何投资建议。用户与作者之间的任何争议,与本平台无关。如网页中刊载的文章或图片涉及侵权,请提供相关的权利证明和身份证明发送邮件到support@aicoin.com,本平台相关工作人员将会进行核查。