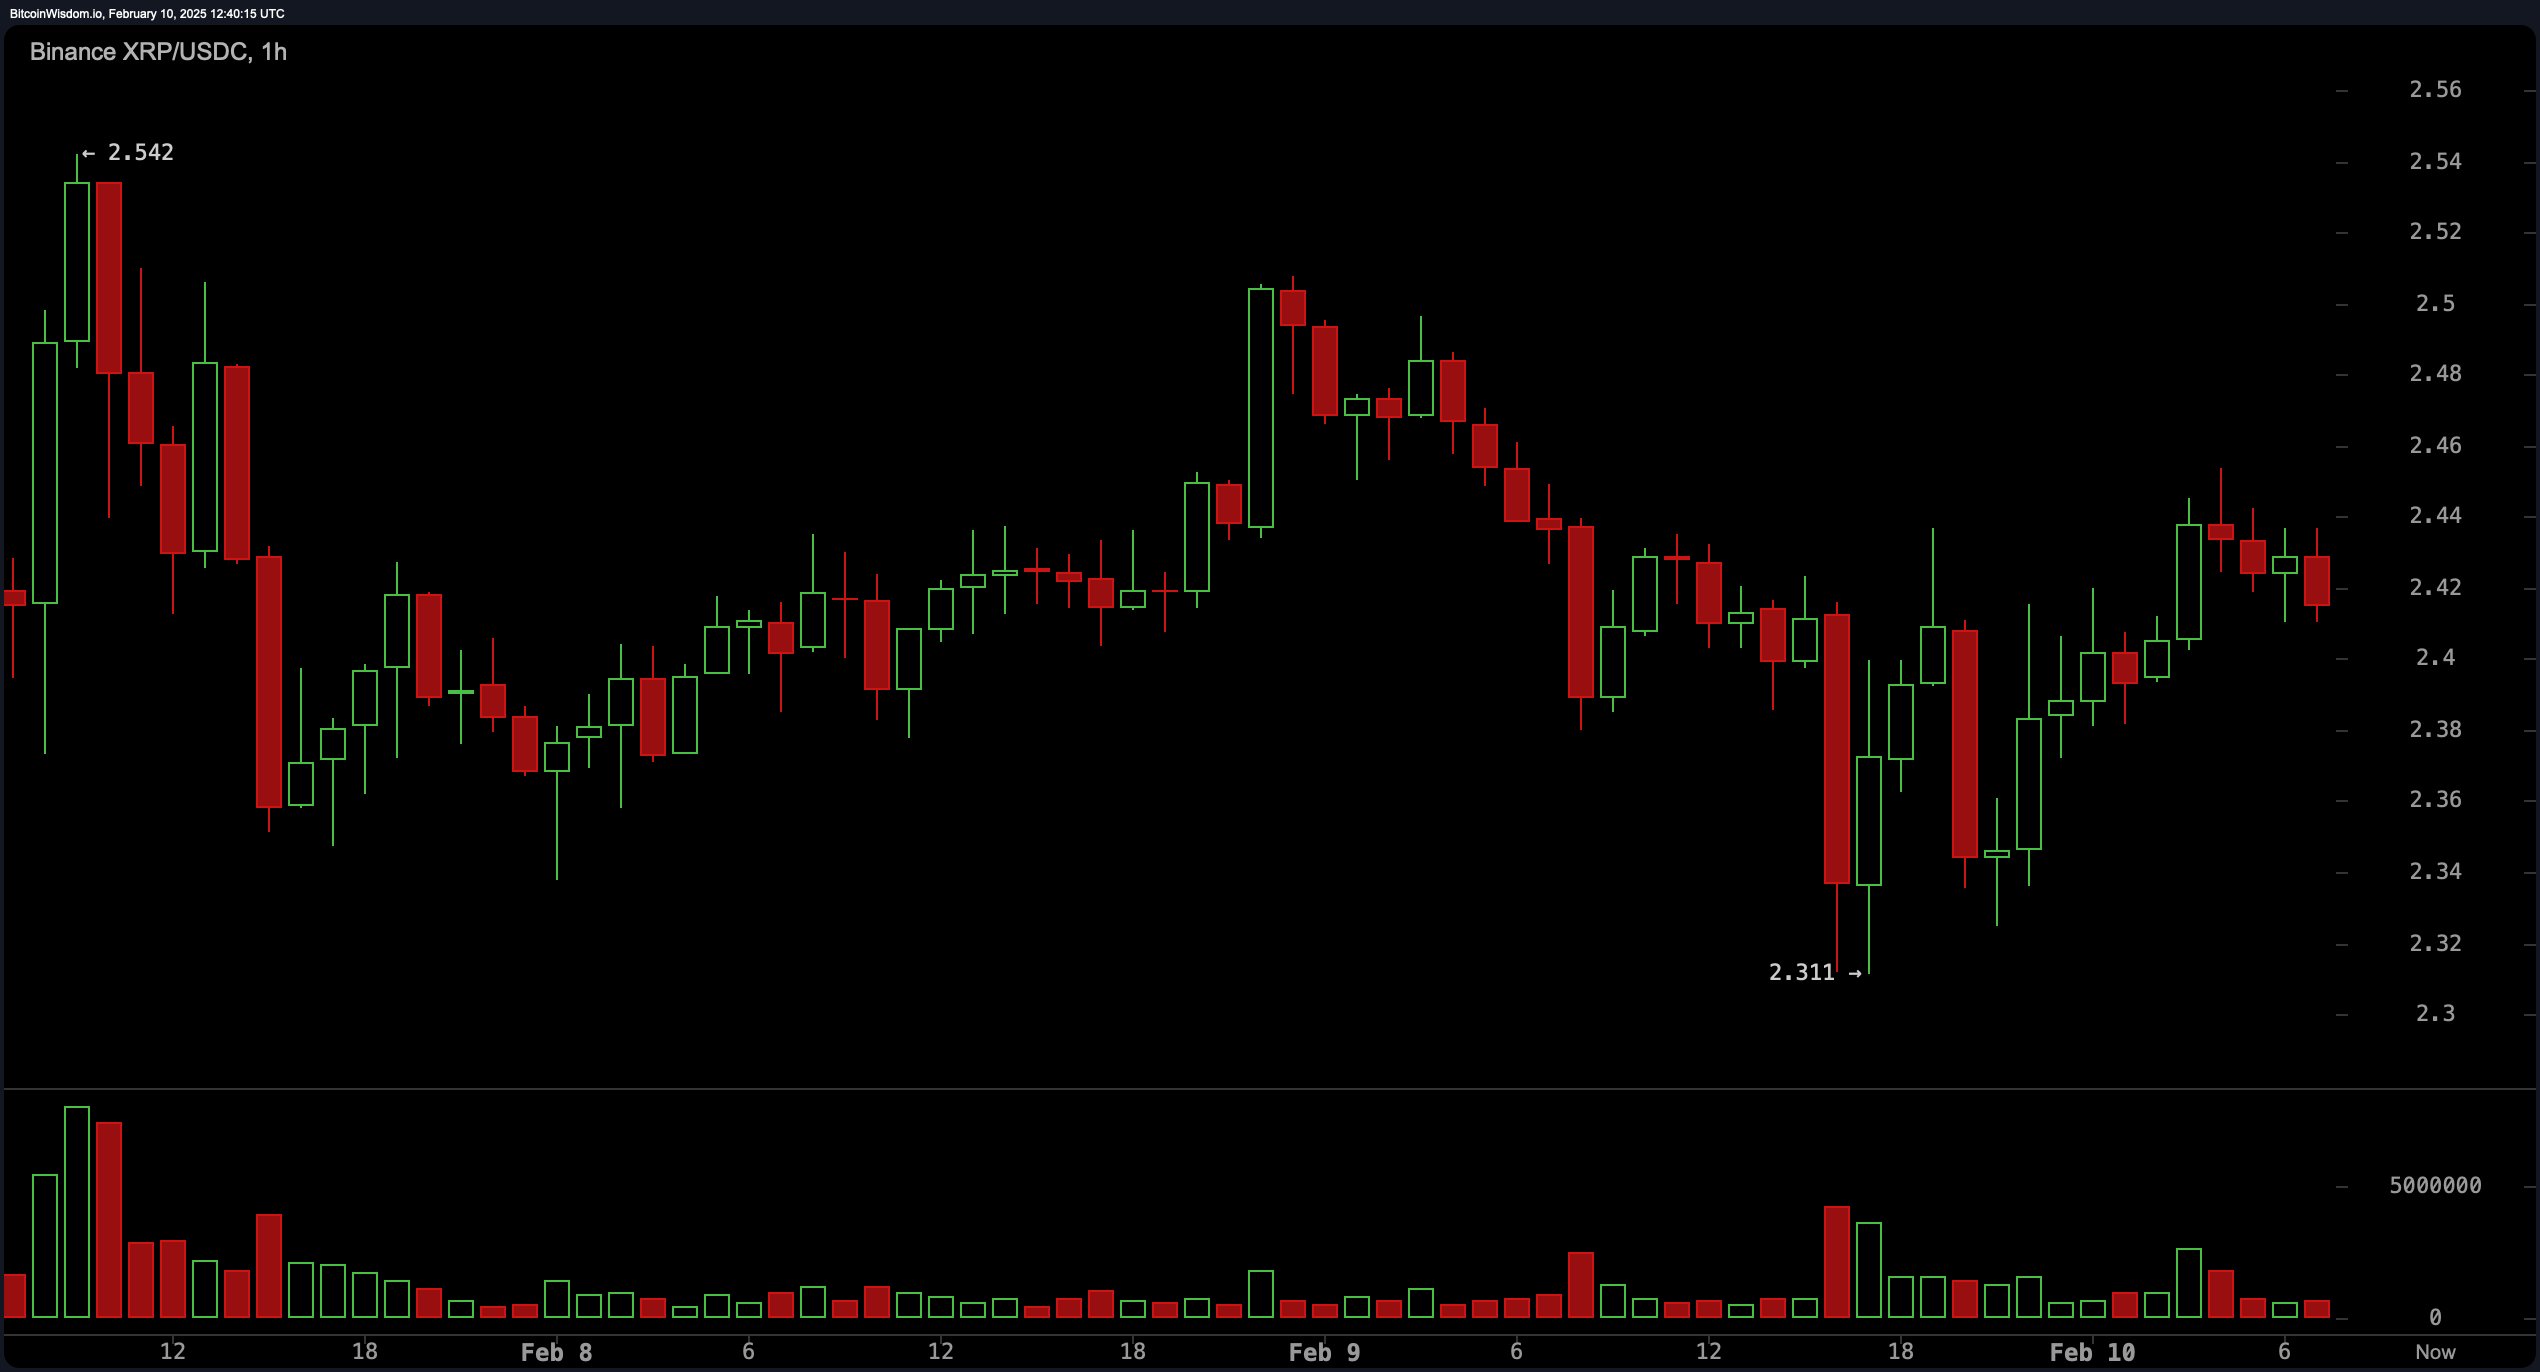
XRP’s hourly chart reveals horizontal equilibrium, bracketed by resistance at $2.45–$2.50 and support at $2.30–$2.35. Subdued transactional activity implies hesitancy among traders, as prices hover within a compressed corridor. A decisive push past $2.50 might ignite upward movement toward $2.60, whereas a dip below $2.30 could invite steeper declines. Nimble traders might exploit these boundaries, harvesting gains from rhythmic oscillations.

XRP/USDC 1H chart on Feb. 10, 2025.
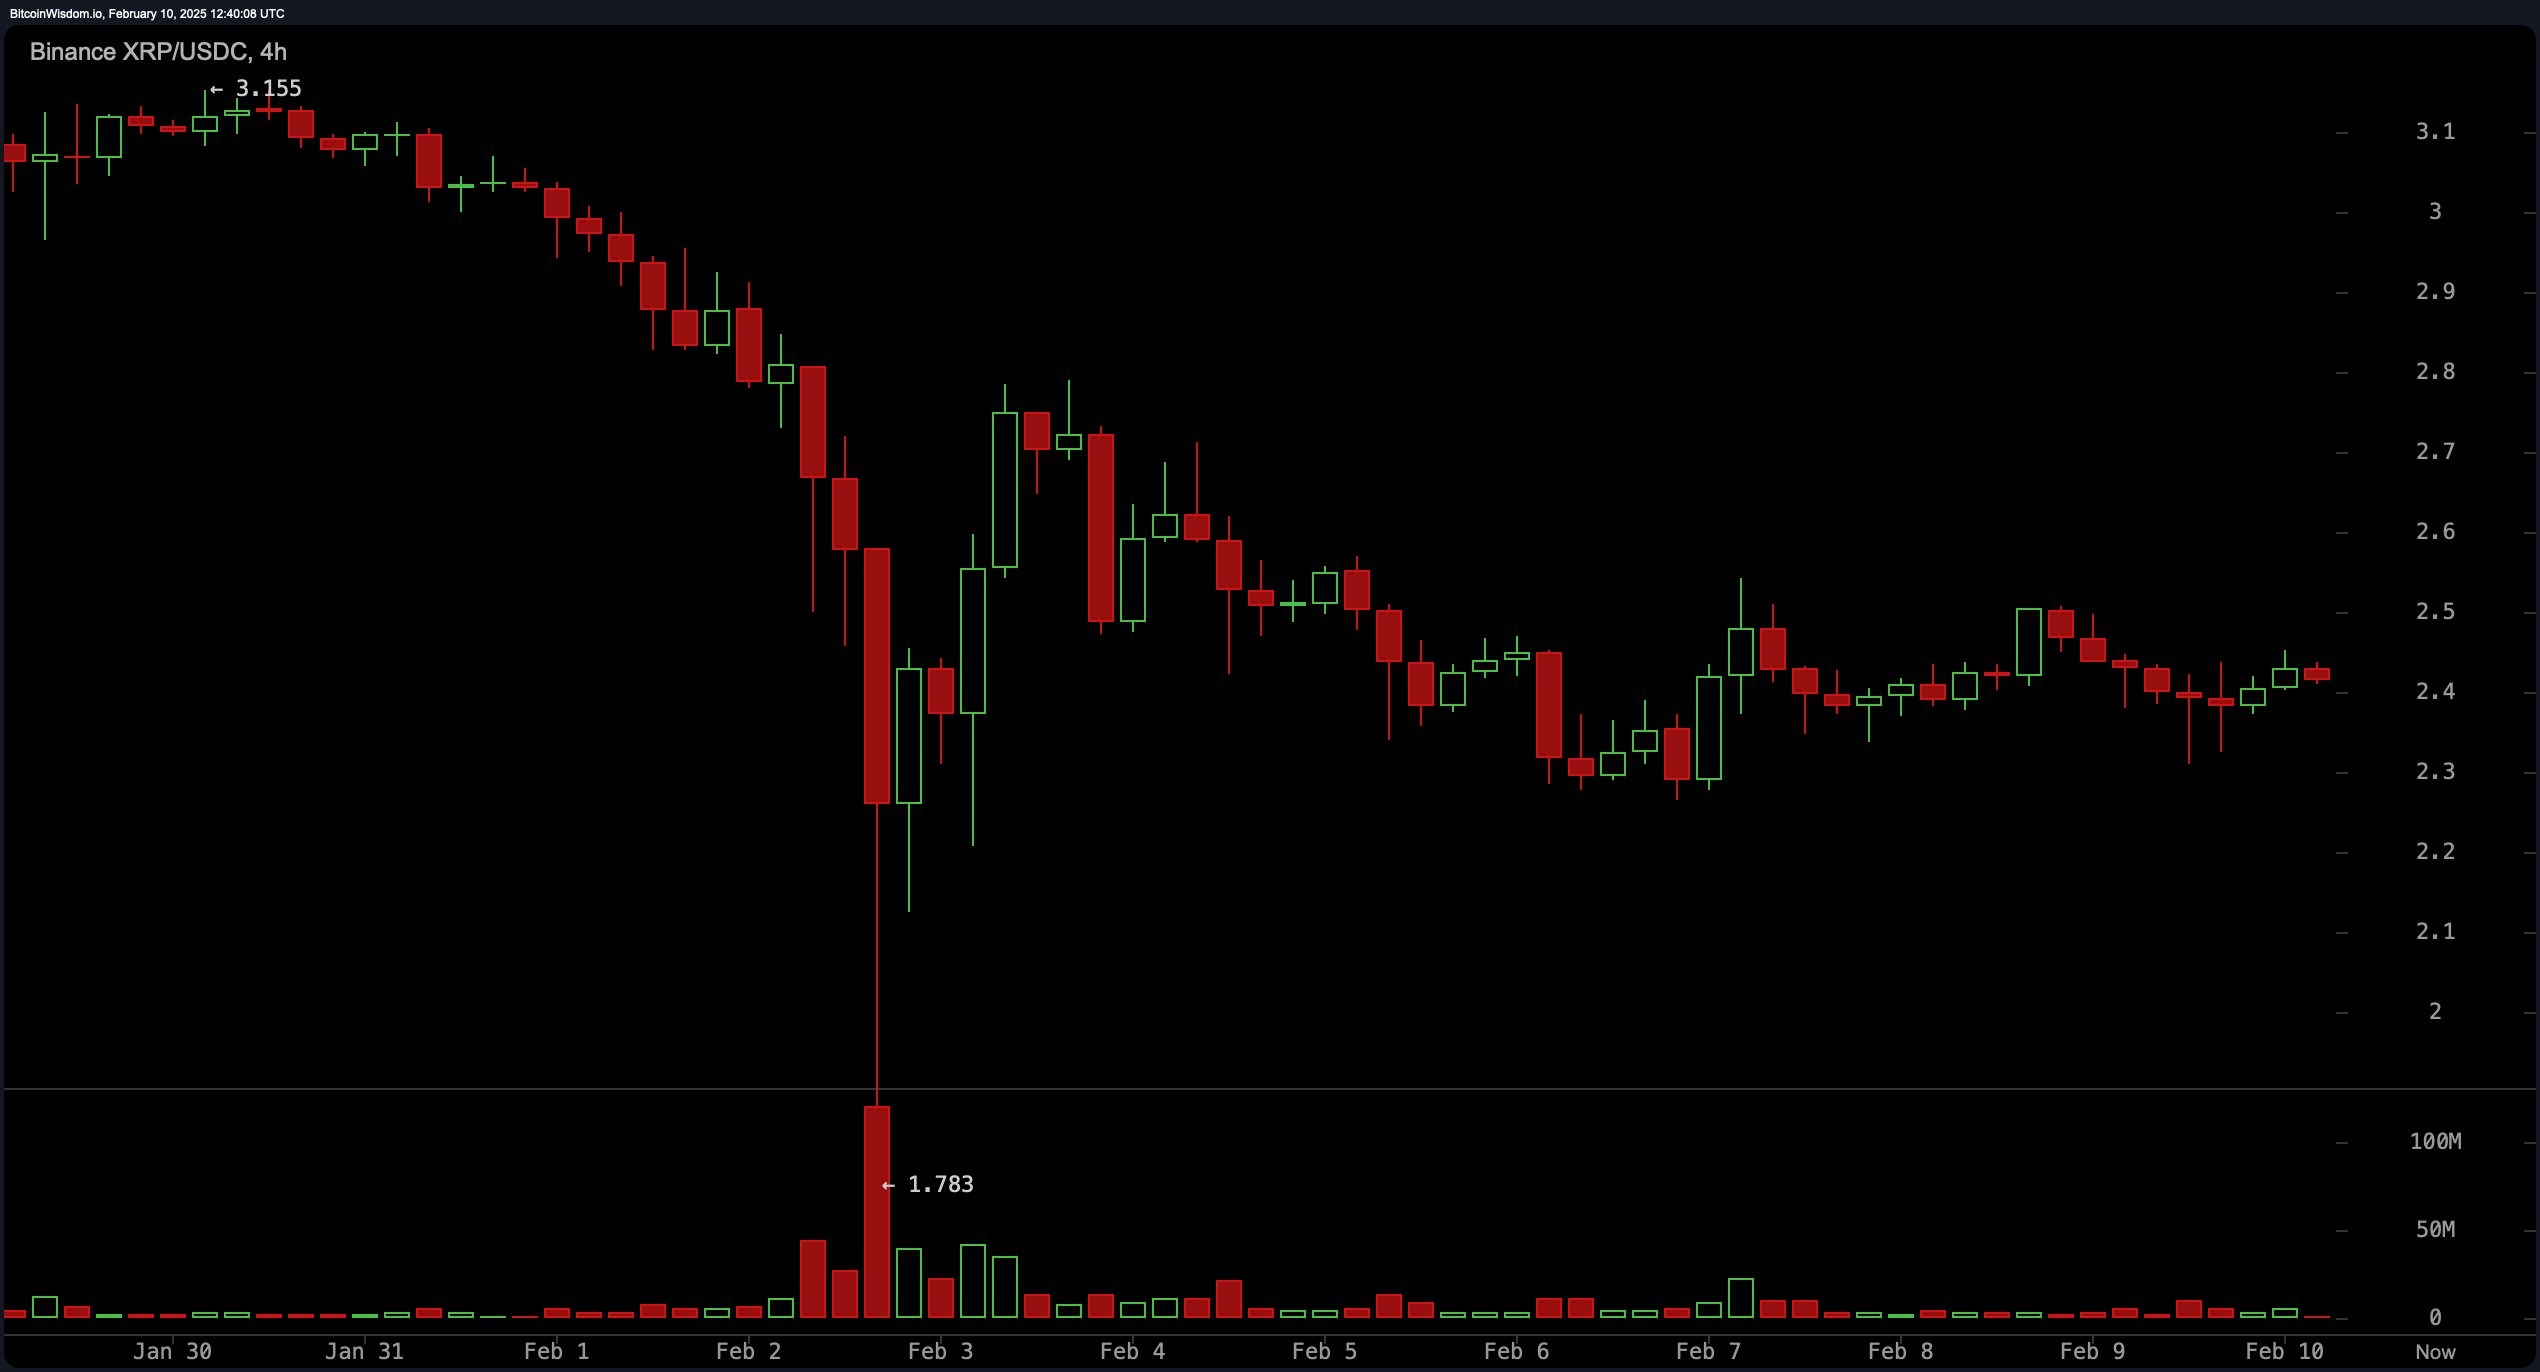
On the four-hour timeframe, XRP stabilizes following a prior descent, with resistance clustered at $2.60–$2.70 and critical support anchored at $2.30. After retreating from a climactic $3.10 peak, the asset now seeks equilibrium between $2.30 and $2.50. Diminished activity post-correction implies latent positioning. Overcoming $2.50 may propel prices toward $2.70, while a breach of $2.30 risks renewing downward pressure.

XRP/USDC 4H chart on Feb. 10, 2025.
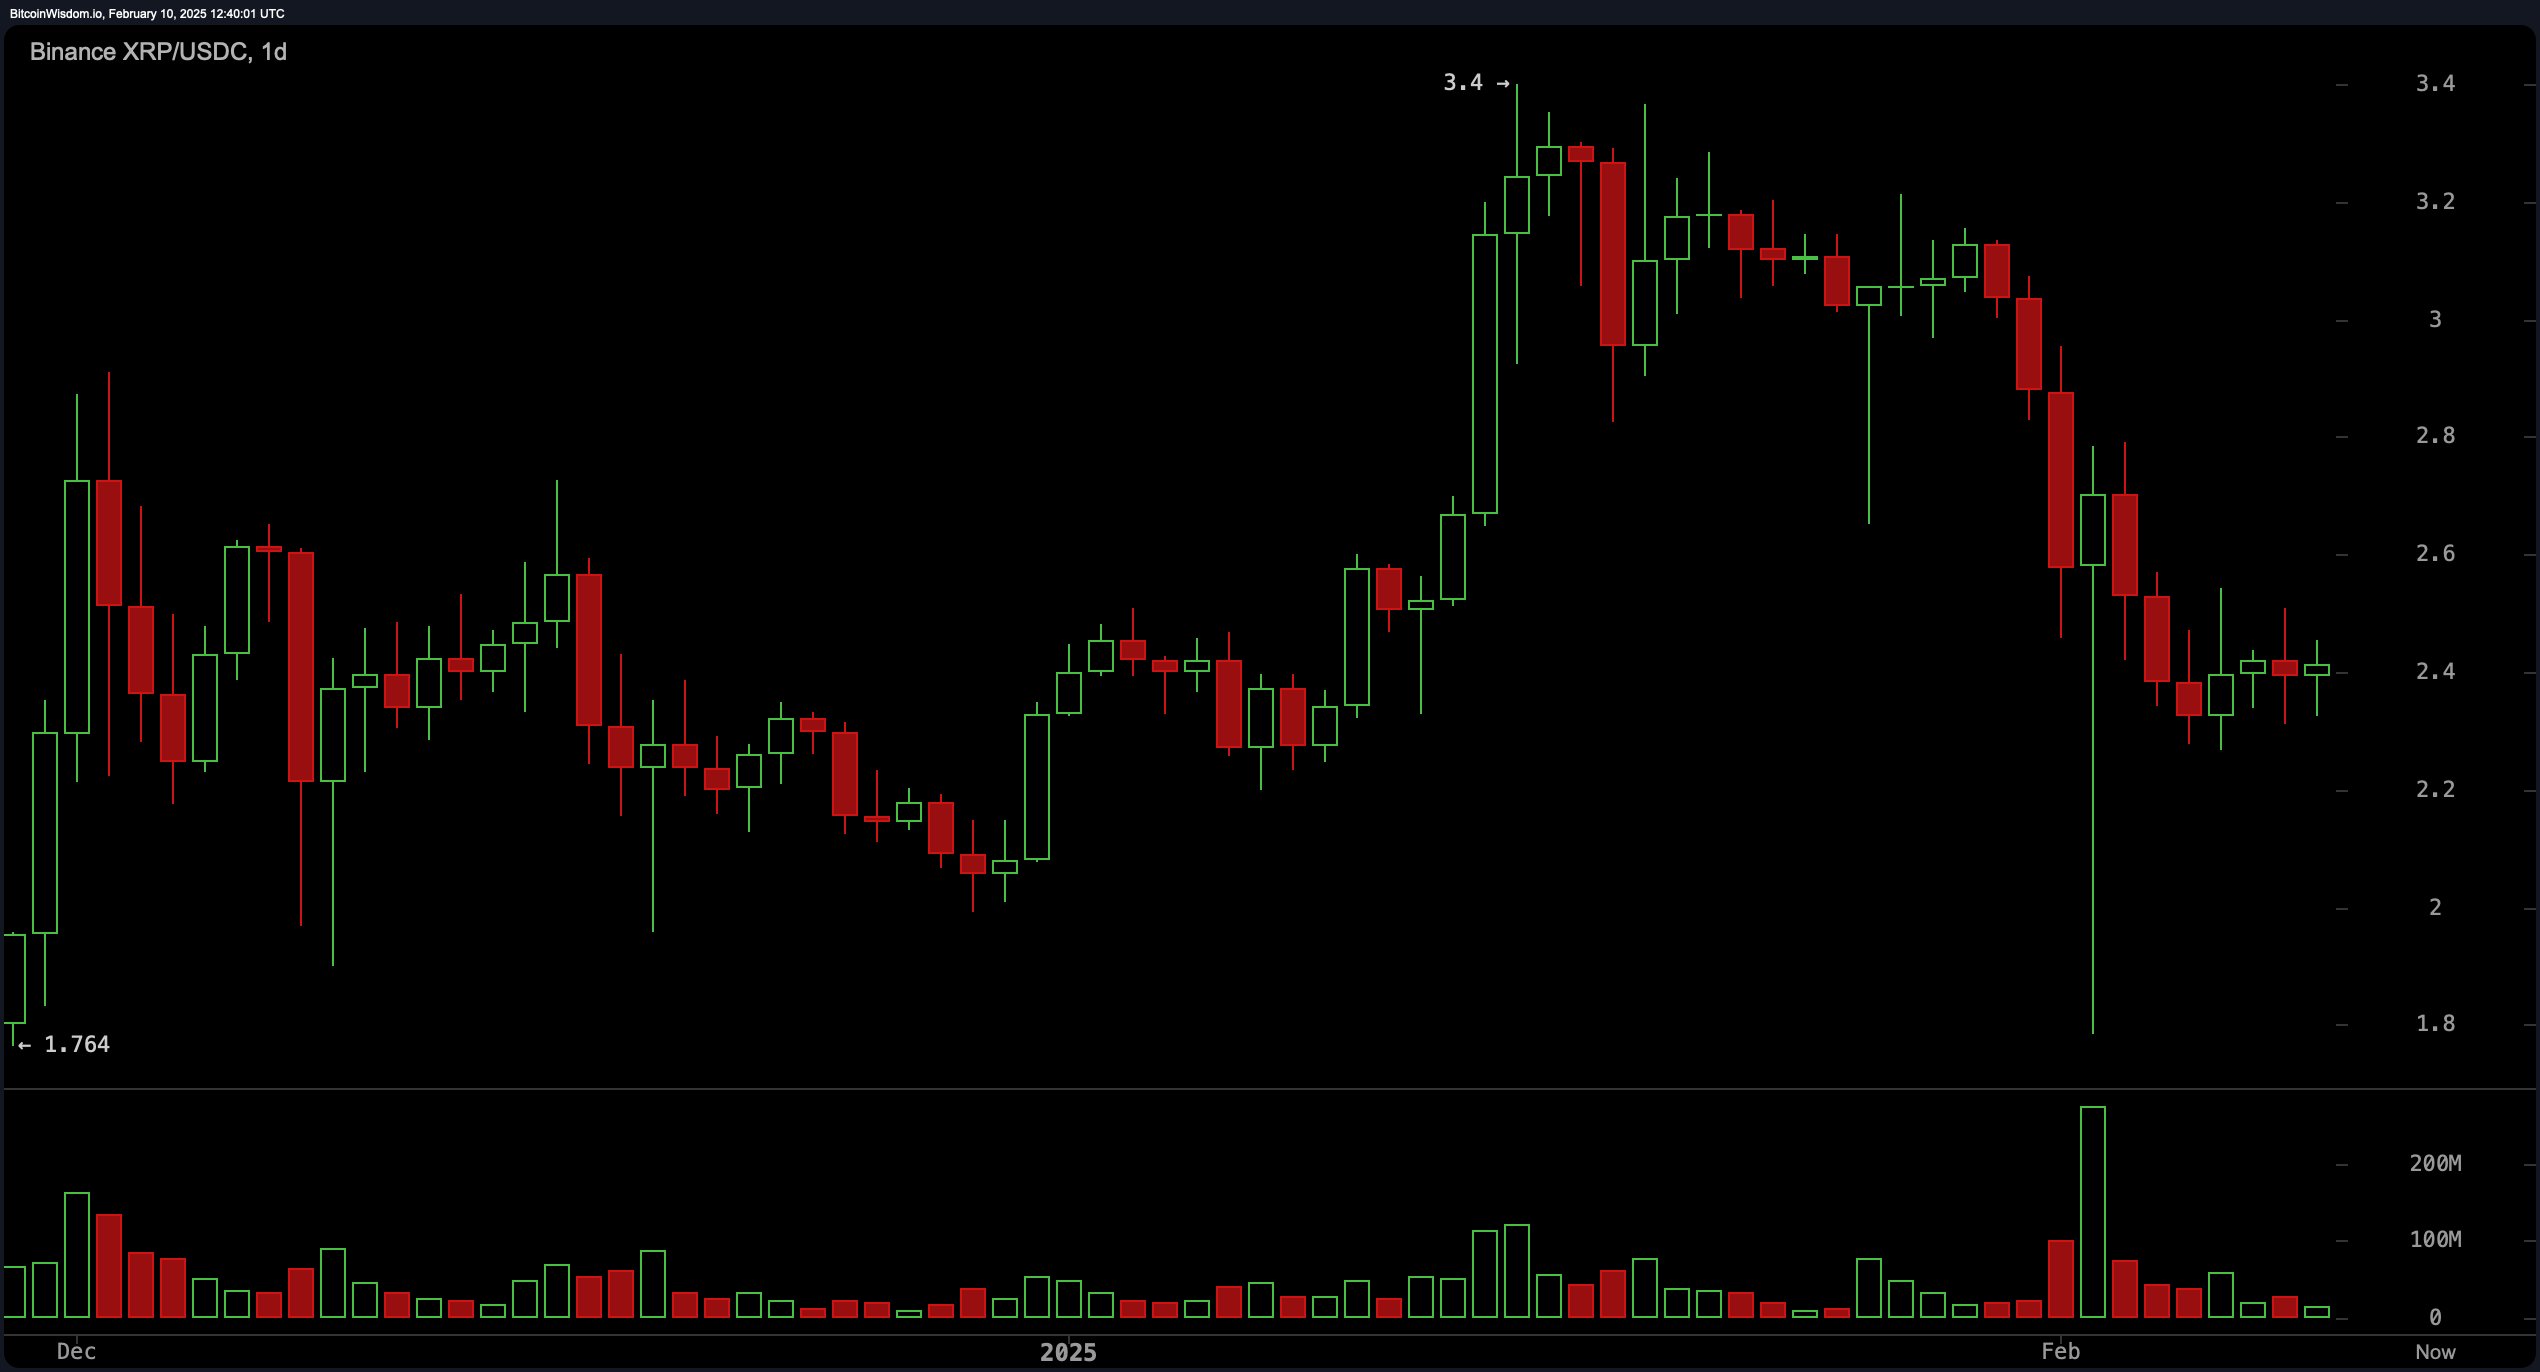
XRP’s daily perspective captures a broader correction after the digital asset’s parabolic ascent to $3.40, now consolidating near $2.40. Foundational support resides at $2.20–$2.40, while the $3.00 threshold looms as resistance. Intensified transactional flows during the sell-off revealed fervent profit-taking, yet recent steadiness hints at latent bullish resolve. Holding above $2.40 may catalyze recovery, whereas slippage could prompt tests of lower supports.

XRP/USDC 1D chart on Feb. 10, 2025.
Momentum indicators offer divergent cues: the RSI (38.46), stochastic %K (44.34), and CCI (-85.96) reflect balanced momentum. The ADX (34.87) implies modest trend vigor, while the awesome oscillator (-0.38) and momentum (-0.62) tilt toward cautious optimism. The MACD (-0.10), however, leans bearish, flagging downside potential.
Short-term moving averages bolster a bearish outlook, with EMAs and SMAs (10–30 periods) signaling sell conditions. Longer-term metrics remain constructive: the EMA (100) at $2.18 and SMA (100) at $2.12 advocate accumulation, reinforced by the EMA (200) at $1.65 and SMA (200) at $1.34. This dichotomy frames a pivotal juncture, with XRP’s trajectory hinging on reclaiming decisive thresholds to reignite its upward dance.
Bull Verdict:
Despite short-term bearish pressure, XRP’s ability to hold above $2.40 while showing signs of accumulation suggests a potential breakout. If price action clears the $2.50 resistance with increasing volume, it could trigger a rally toward $2.70 and beyond. The longer-term moving averages indicate underlying strength, reinforcing the possibility of bullish continuation.
Bear Verdict:
XRP remains under pressure, with multiple short-term moving averages signaling a sell. The failure to reclaim $2.50 and the bearish moving average convergence divergence (MACD) suggest downside risks. If support at $2.30 breaks, XRP could extend losses toward $2.20 or lower, confirming a continued downtrend in the near term.
免责声明:本文章仅代表作者个人观点,不代表本平台的立场和观点。本文章仅供信息分享,不构成对任何人的任何投资建议。用户与作者之间的任何争议,与本平台无关。如网页中刊载的文章或图片涉及侵权,请提供相关的权利证明和身份证明发送邮件到support@aicoin.com,本平台相关工作人员将会进行核查。


