# I. Super Band Tracking · Core Principles of Short Selling Strategy
In quantitative trading, successful strategies are often built on the precise capture of market laws and the optimization of risk-reward ratios. The core principle of Super Band Tracking · Short Selling Strategy is to capture significant downward momentum at important market peaks through mathematical modeling and data analysis, automate short selling operations to reduce holding risks, and enhance capital utilization efficiency. This method is particularly suitable for highly volatile assets, allowing for the identification of high-probability trading opportunities during adjustment bands.
1. Analysis of Core Ideas
The design inspiration for the Super Band Tracking strategy comes from the theoretical assumptions of mean reversion and momentum reversal. The core idea is that after a price rebounds from a high level, quantitative indicators capture signals of weakening price rebounds and convert these signals into clear short entry/increase points. In this way, investors can avoid risk exposure after strong price increases and achieve precise short selling operations driven by data.
From the perspective of strategy objectives, Super Band Tracking emphasizes three core advantages:
- Reducing Holding Costs:
Short selling in the area of market high-level rebound weakness, locking in profits during price retracement trends. Band retracements are often accompanied by high market panic, and by quantitatively analyzing changes in price trend reversals or fluctuations, suitable short selling opportunities can be accurately identified, thus avoiding the cost pressure and holding risks caused by hidden price differences at high levels.
- Enhancing Capital Efficiency:
Automatically identifying signals of weakening rebounds and avoiding frequent trial and error caused by inefficient fluctuations through set quantitative conditions. Compared to traditional subjective trading methods, automated quantitative strategies can gain deeper insights into market mechanisms and band reversal patterns while avoiding excessive participation in ineffective fluctuating markets, thereby improving the overall return on capital utilization.
- Precisely Capturing Trend Lows:
Opening short positions at trend highs reduces blind exposure to price retracement losses. In a weakening market, the market often presents linear declines or horizontal fluctuations, while quantitative strategies identify weak price rebounds. The Super Band Tracking strategy accurately models data such as retracement amplitude, candlestick structure, and trading volume, helping investors lock in retracement profit space.
👉 Advantages:
Good Opportunities: The combination of market rhythm—when a trend high-level retracement encounters a precise short selling signal from the quantitative model, it gathers higher probability trading opportunities.
Good Risk Control: Starting to lay out short positions in the top price range can quickly avoid floating losses after price stabilization, while precise trading timing through quantitative control and risk-hedging strategies effectively reduces the burden on capital utilization.
2. Detailed Explanation of Core Indicators
This strategy relies on the following key quantitative indicators to assist in signal capture and operational decision-making:
1) Recent 50 Candlestick Highs, Lows, and Averages:
Utilizing historical price data to calculate interval extremes and averages, thereby determining the current price range of the band.
The relative position of highs and lows can reveal whether the market is in an overbought or oversold state, providing a reference for subsequent judgments.
2) Candlestick Price Increases and Decreases:
By calculating the price amplitude of single or multiple candlesticks, capturing the intensity of market fluctuations to identify potential trend reversal signals.
A significant increase in amplitude often indicates a heightened divergence between bulls and bears, marking a key entry point for the strategy.
3) Trading Volume Rebound Lows:
The combination of volume and price is an important means to enhance strategy effectiveness. Abnormal expansion or contraction of trading volume often signals that the market is approaching a critical turning point.
Setting the low points of trading volume as a reference can further filter out noise signals and accurately locate the rebound buying points of "super-level" bands.
3. Causes of Signal Logic
This strategy is derived from statistical logical analysis, indicating that when prices reach highs in key pressure areas, significant changes in trading volume typically release signals of short-term or medium-term capital outflows. This market behavior exhibits the characteristic of "Bullish Momentum Decline":
As bullish buy orders gradually exhaust, market trading becomes sluggish, and capital gradually retreats to seek low-risk areas, which often triggers rapid price reversals. Based on this logic, the strategy can capture short selling opportunities with higher win rates and better risk-reward ratios.
Through the rigorous setting of quantitative conditions, the Super Level Tracking Short Selling Strategy relies on high-precision indicators to automatically filter out core operational signals of "Relative High-Level Weakness." If combined with set take-profit points, the strategy can exhibit strong adaptability in different fluctuating market conditions.
4. Practical Significance and Unique Advantages
Eliminating Emotional Trading: The precise short selling signals generated by quantitative indicators allow trading decisions to be free from subjective emotional interference, preventing investors from falling into losses due to chasing highs and cutting losses or blindly entering long positions.
Dealing with Complex Markets: In a market environment characterized by fluctuations or unclear trends, this strategy relies on "high-level weakness" band signals to capture opportunities for short-term market pullbacks or trend reversals.
Reducing Trading Costs: The design of indicators combining volume and price allows the strategy to effectively filter out low-quality signals at high levels where the market rebounds weakly, avoiding frequent attempts to short in fluctuating markets, thereby reducing operational frequency, optimizing trading costs, and improving overall return efficiency.
# II. Signal Effectiveness of Super Band Tracking · Short Selling Strategy
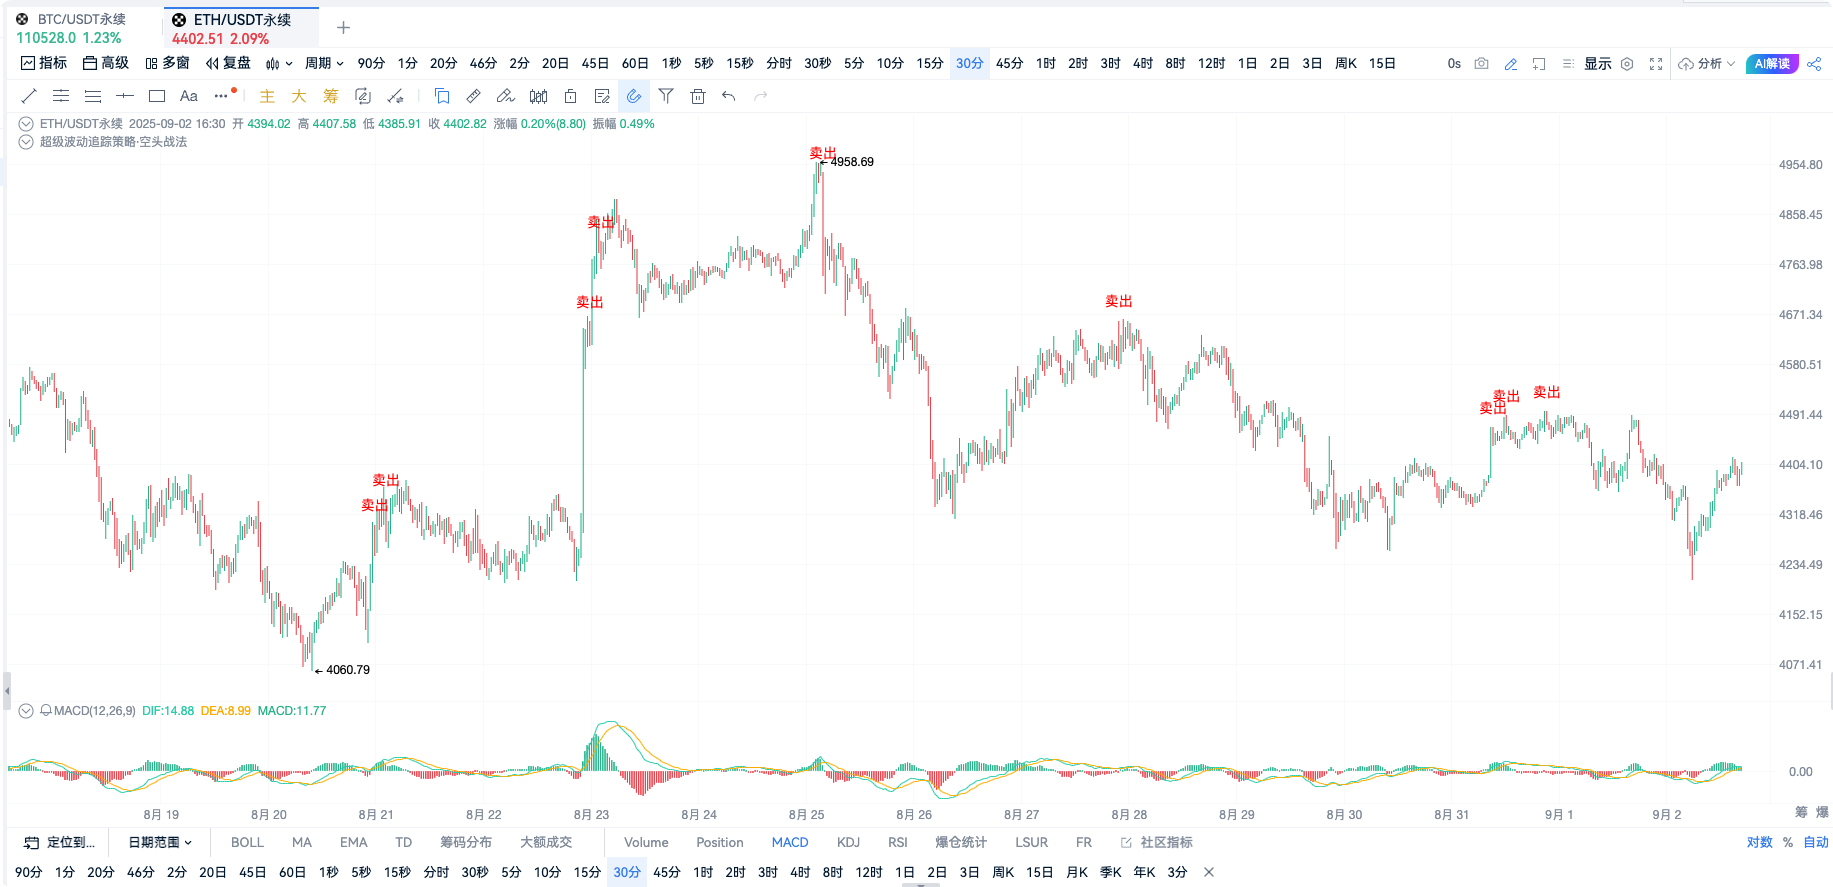
Chart OKX-ETHUSDT Perpetual Contract 30-Minute Cycle
Signal Highlights: In fluctuating markets, each high point can issue a sell signal
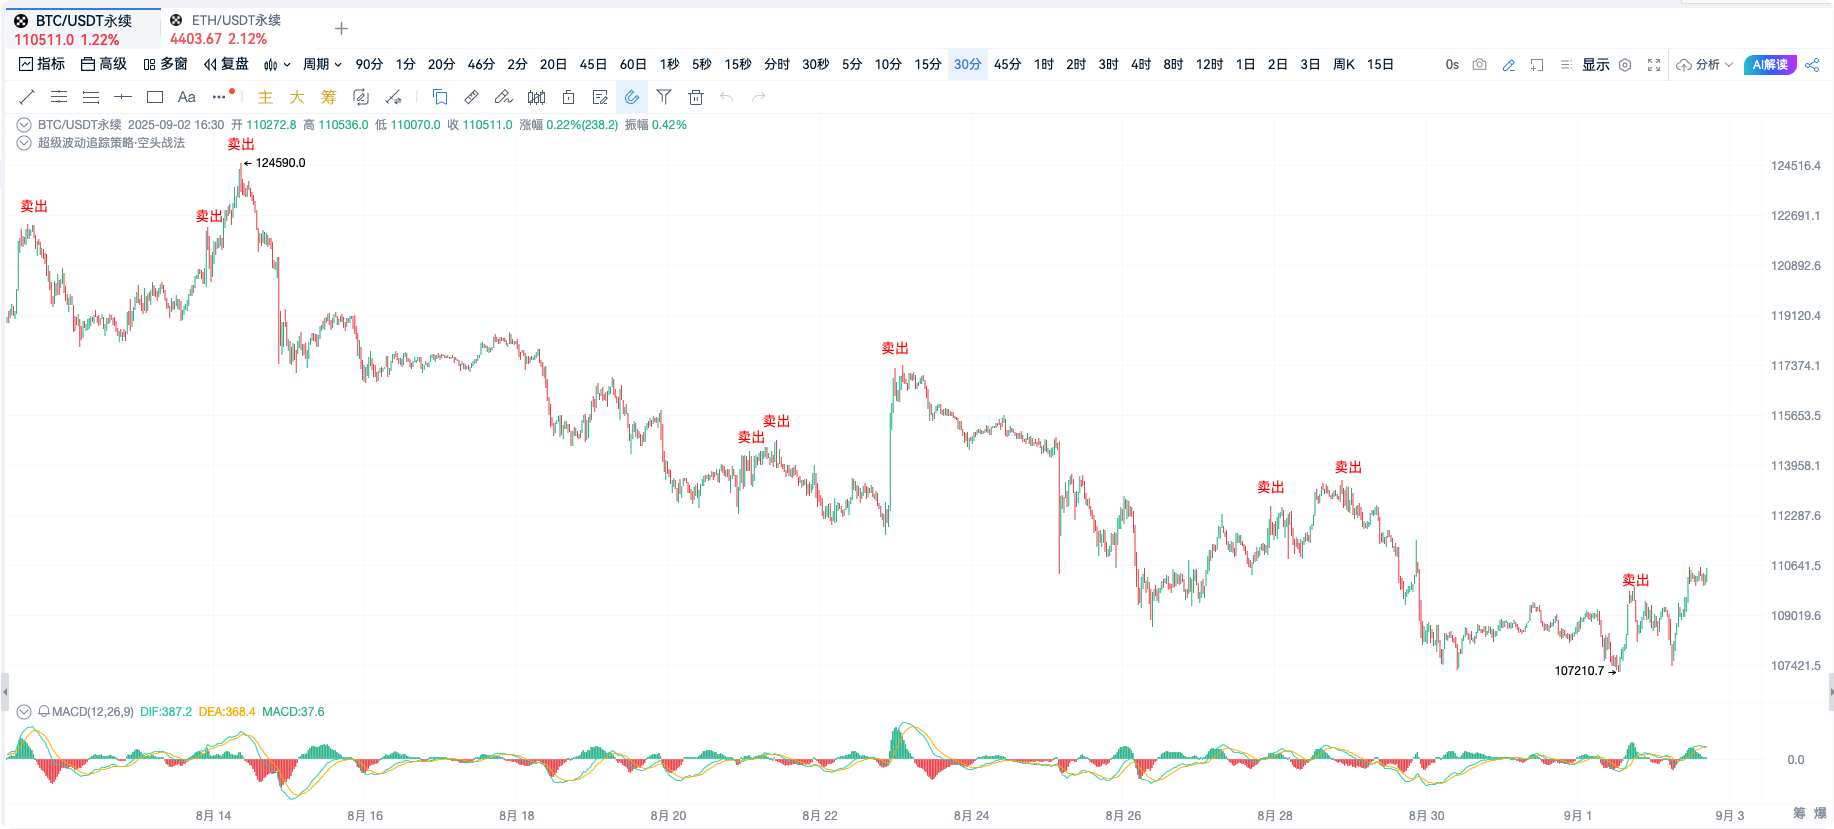
Chart OKX-BTCUSDT Perpetual Contract 30-Minute Cycle
Signal Highlights: In a downtrend, each rebound high point issues a sell signal
# III. Coin Selection for Super Band Tracking · Short Selling Strategy
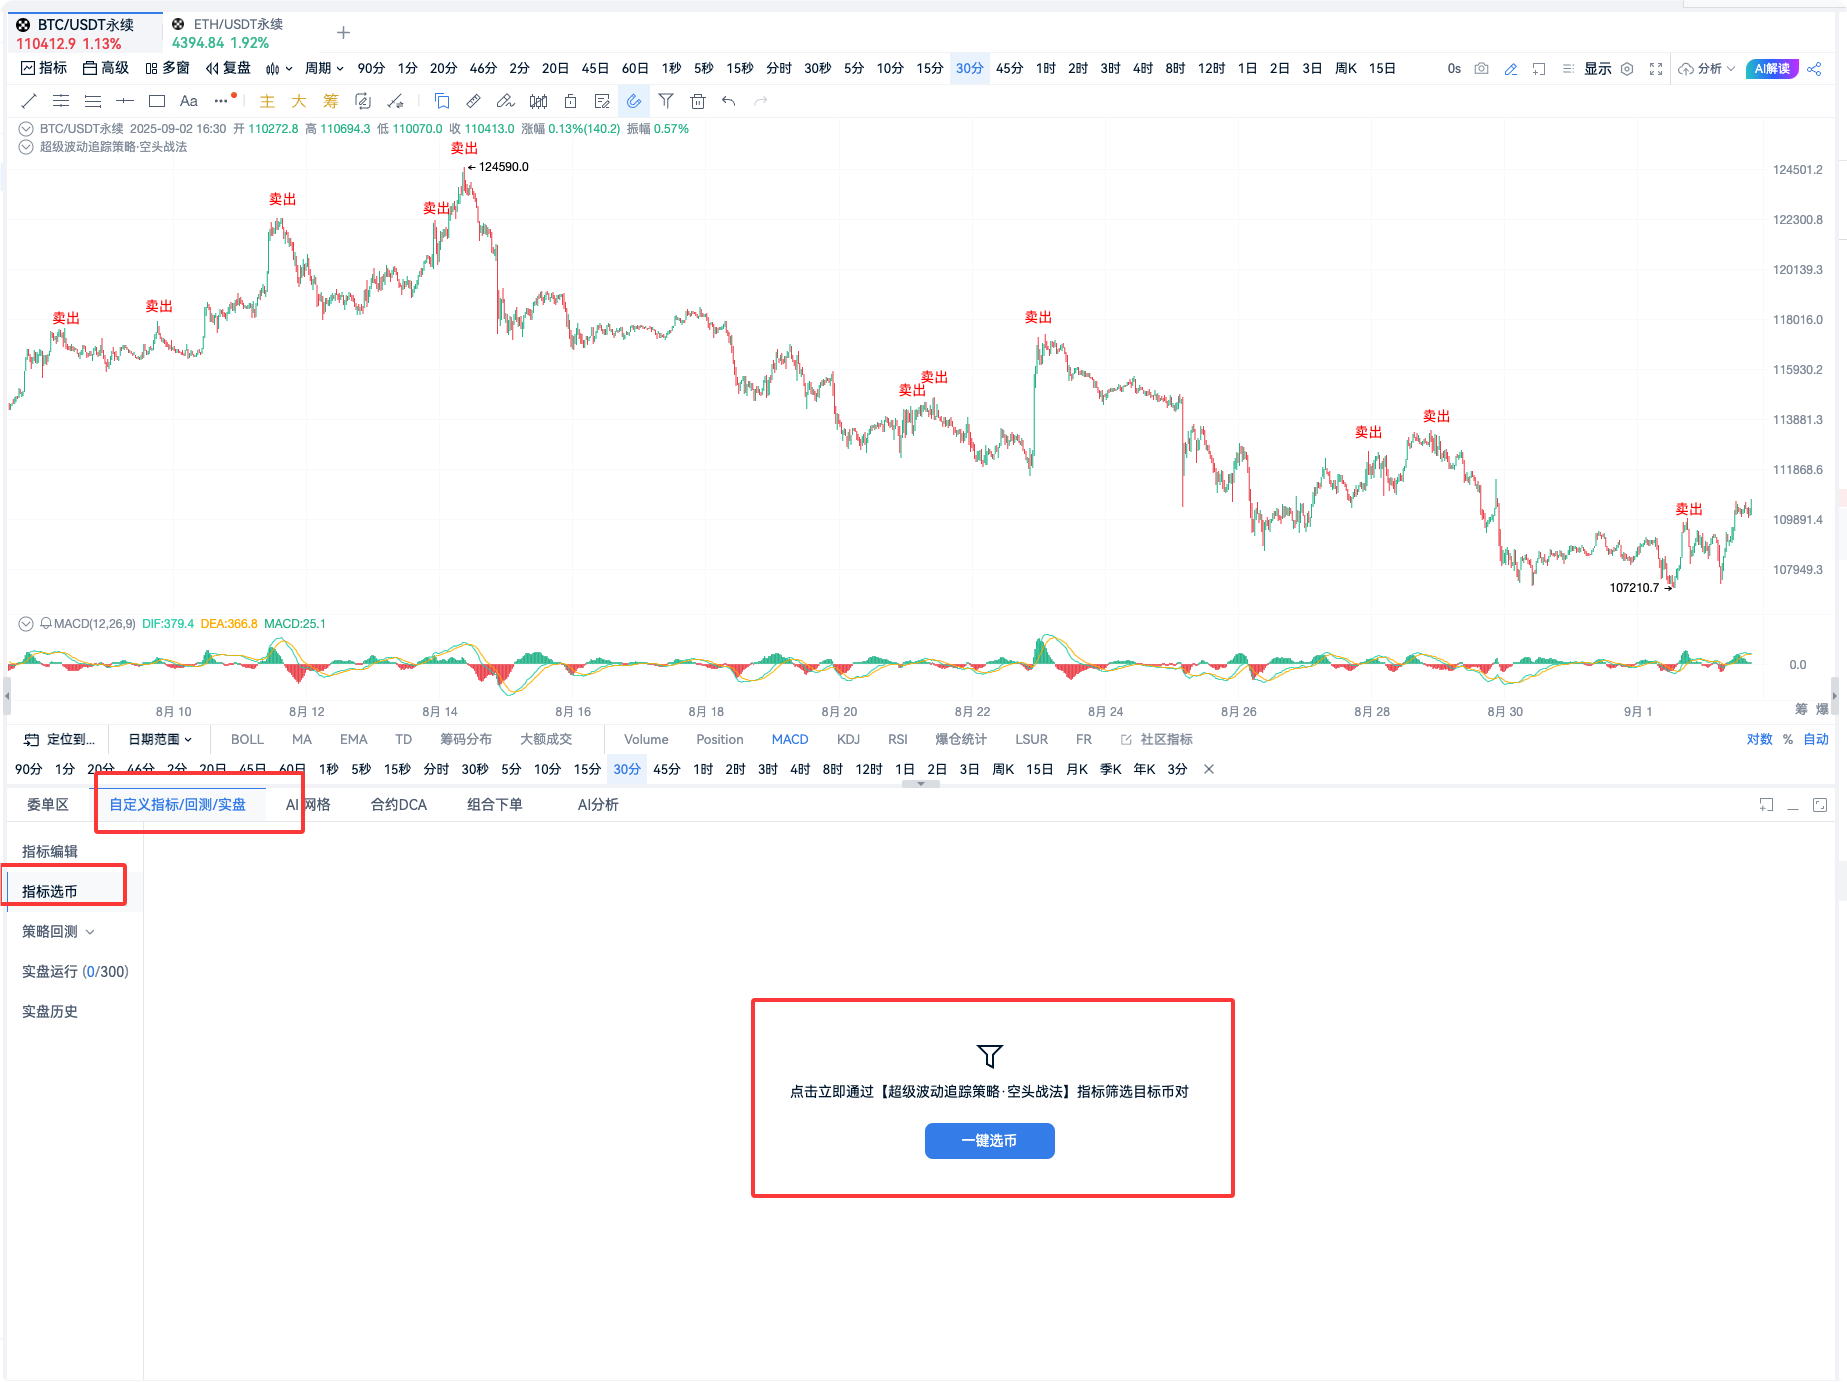
Chart Executing Coin Selection Settings
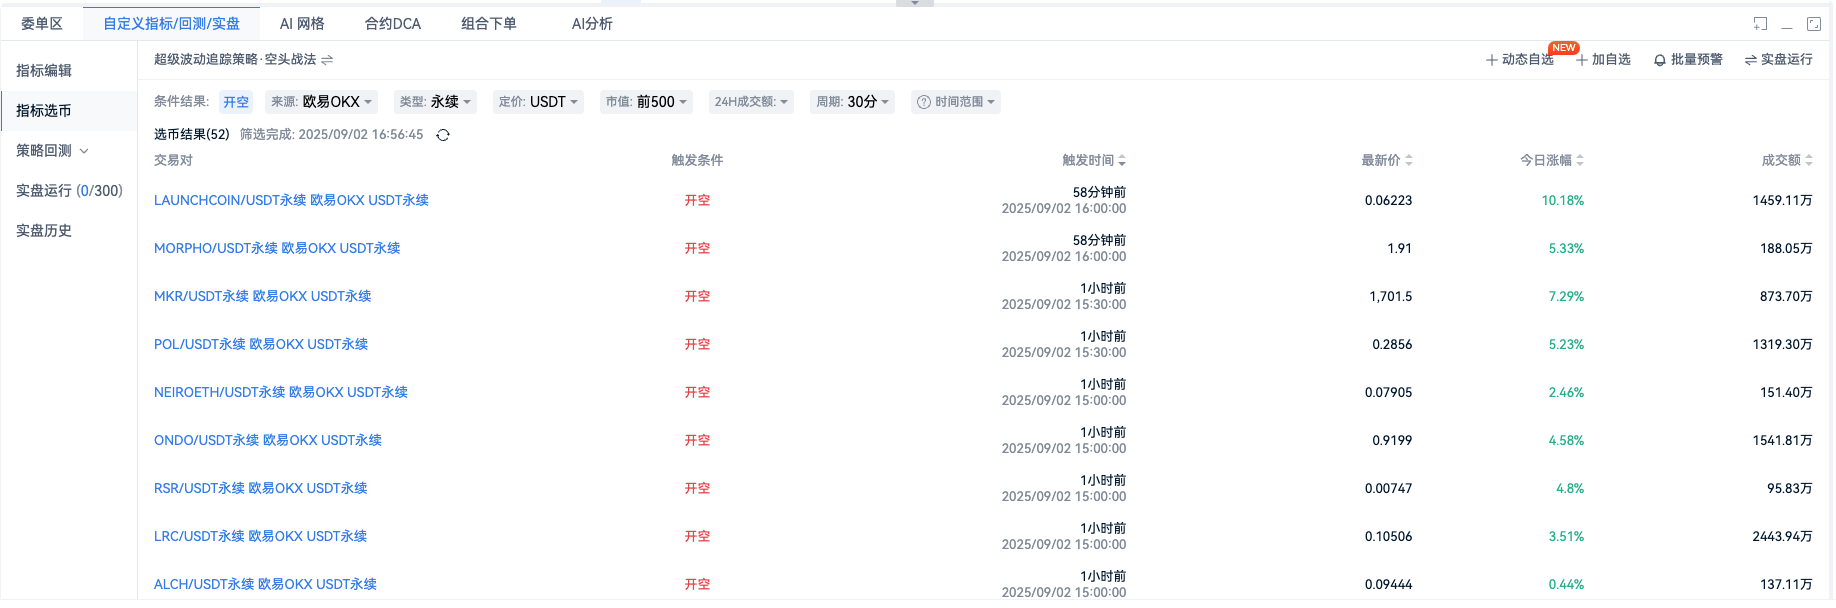
Chart Coin Selection Results
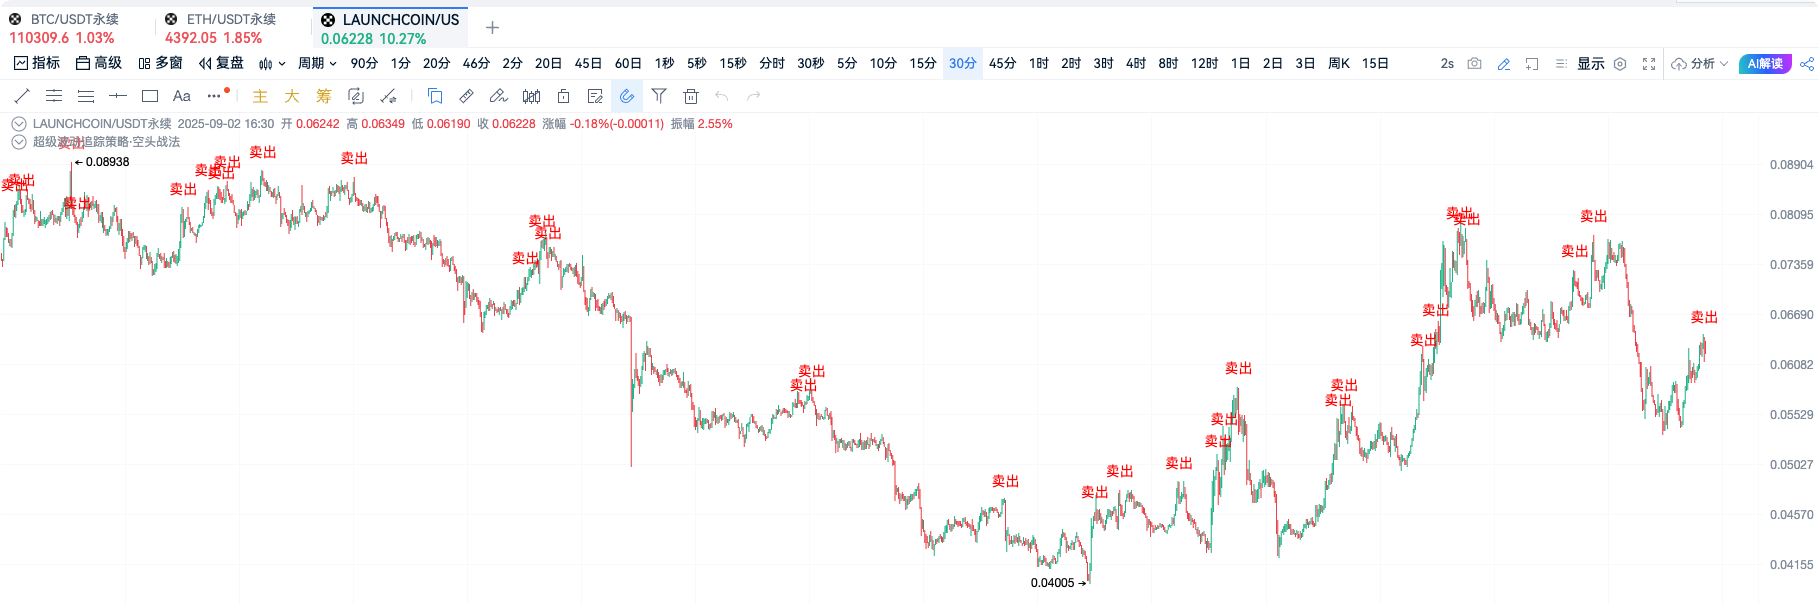
Quality Result 1: OKX-LAUNCHCOINUSDT Perpetual Contract, after issuing a sell signal, it has shown a certain degree of decline
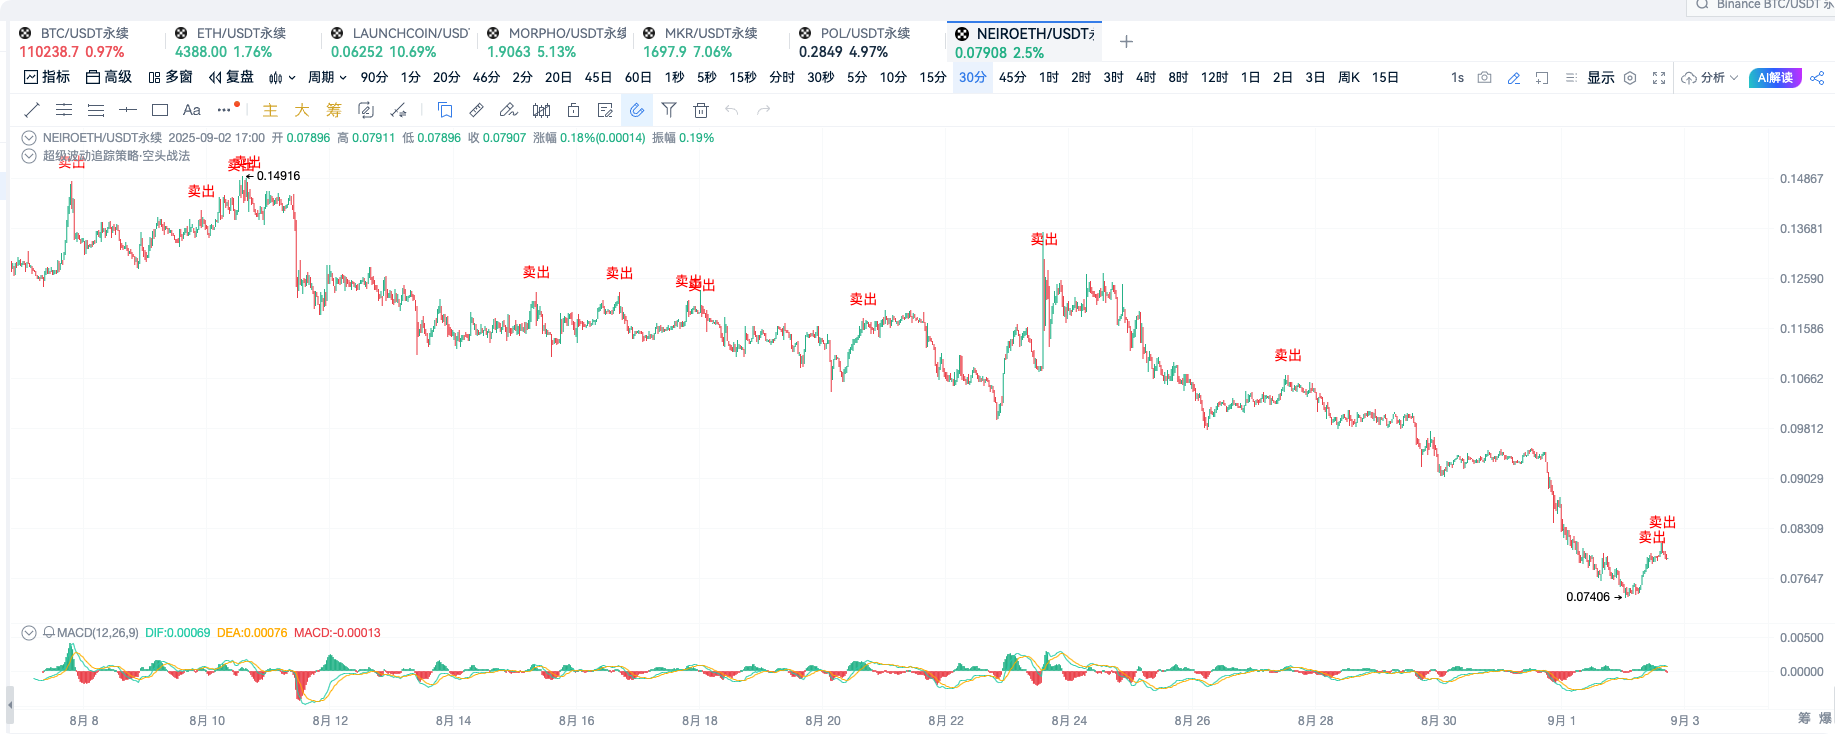
Quality Result 2: OKX-NEIROETHUSDT Perpetual Contract, after issuing a sell signal, it has shown a significant decline
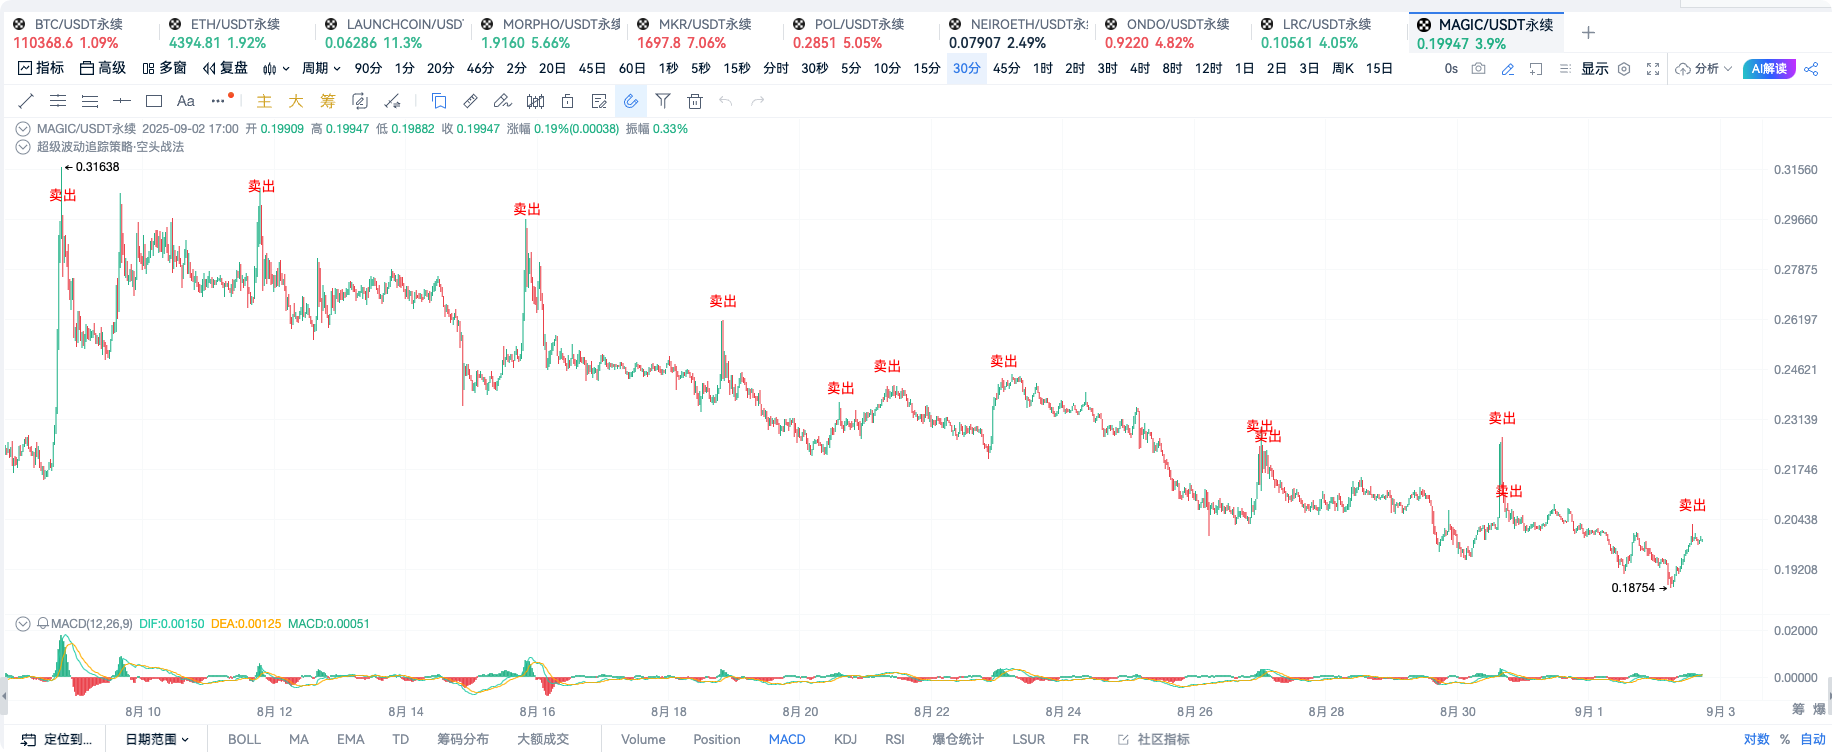
Quality Result 3: OKX-MAGICUSDT Perpetual Contract, each rebound high point during declines can accurately issue a sell signal
👉 Comprehensive Summary:
From the trends of OKX-LAUNCHCOINUSDT and OKX-NEIROETHUSDT, the strategy can stably identify signals within short cycles, accompanied by significant price declines, making it suitable for investors who prefer band following. For the performance of OKX-MAGICUSDT, the strategy not only accurately captures downward signals but also quickly locates secondary short selling opportunities after each price rebound, making it more suitable for short-term traders seeking efficient operational timing.
# IV. Indicator Source Code
// Strategy Applicable Conditions: Bearish Market
// Strategy Principle: Find points where prices retrace after a volume increase, automatically execute short positions
// Recommended Running Cycles: 5m / 15m / 30m
// Notes: The strategy only executes short positions, take-profit and stop-loss settings are required, suggested take-profit at 2%, stop-loss at 1%, adjust according to leverage conditions
//
// @version=2
// Calculate the highest value of the last 50 bars
hhv = highest(high, 50)
// Calculate the lowest value of the last 50 bars
llv = lowest(low, 50)
// Calculate candlestick length
len= abs(high - low)
// Calculate the average height of candlesticks
maLen = ma(len, 50)
// Define recent new highs and new lows
newHigh = high == hhv
newLow = low == llv
// Calculate price change
degree = ((close - open) / open) * 100
// Calculate price change
change = close - open
// Define conditions
lenLimit = len > maLen
newHighEnd = ((newHigh[1] && !newHigh) || newHigh) && change < 0 && lenLimit
newLowEnd = ((newLow[1] && !newLow) || newLow) && change > 0 && lenLimit
degreeThrehold = 0.2
maVol = ma(volume, 120)
volumeCondition = volume > maVol
volUp = volumeCondition && degree >= degreeThrehold
volDown = volumeCondition && degree <= -degreeThrehold
signal = 0
if (volUp && (newLowEnd || newLowEnd[1] || newLowEnd[2] || newLowEnd[3] || newLowEnd[4]) && (signal[1] != 1 && signal[2] != 1 && signal[3] != 1 && signal[4] != 1)) {
signal := 1
} else if (volDown && (newHighEnd || newHighEnd[1] || newHighEnd[2] || newHighEnd[3] || newHighEnd[4])&& (signal[1] != -1 && signal[2] != -1 && signal[3] != -1 && signal[4] != -1)) {
signal := -1
} else {
signal := 0
}
buy = signal == 1
sell = signal == -1
// Create corresponding alert conditions for use in the alert addition window
alertcondition(sell, title='Sell Signal', direction="sell")
// Plot signals on the chart
plotText(sell, title='Sell', text='Sell', color='red', refSeries=high, placement='top')
// Spot buy or contract open long
enterShort(sell, price='market', amount=1)
# V. Summary
The core concept of the short selling trading strategy lies in capturing signals of weakening market rebounds through quantitative indicators, accurately assessing the potential for price pullbacks, and helping traders maximize profit opportunities during market downturns. Through rigorous signal validation and dynamic risk management, the strategy not only effectively avoids risks brought by short-term market volatility but also enhances capital utilization efficiency and operational precision.
Specific Advantages:
Reducing Chasing Risks: By closely observing the market's high points and the stages of weakening rebounds, the strategy helps traders avoid unnecessary blind trading, significantly reducing the risk of losses caused by chasing prices.
Enhancing Short Selling Efficiency: The automated quantitative signal generation mechanism can accurately identify the best timing for short operations, helping traders seize the core intervals of sudden market declines and trend pullbacks.
Focusing on Weak Rebound Nodes: By locking in the stages of weakening market high rebound momentum, the strategy optimizes trading rhythm and creates efficient paths for short selling profits, suitable for short-term investors seeking stable returns.
This strategy combines multiple technical indicators and dynamic adjustment methods, including volume-price trend signals, rebound exhaustion monitoring tools, and an automated operational path for bearish markets. The strategy possesses high precision and flexibility, effectively adapting to various market conditions, providing real and reliable short selling solutions for short-term traders.
Join our community to discuss and grow stronger together!
Official Telegram community: t.me/aicoincn
AiCoin Chinese Twitter: https://x.com/AiCoinzh
Group chat - Wealth Group: https://www.aicoin.com/link/chat?cid=10013
免责声明:本文章仅代表作者个人观点,不代表本平台的立场和观点。本文章仅供信息分享,不构成对任何人的任何投资建议。用户与作者之间的任何争议,与本平台无关。如网页中刊载的文章或图片涉及侵权,请提供相关的权利证明和身份证明发送邮件到support@aicoin.com,本平台相关工作人员将会进行核查。