Earlier, we mentioned that the downtrend was broken, and the market has experienced a continuous rise for 5 days. Currently, it seems that the market has reached an extreme point, and the overall direction is about to be determined.
Weekly Level
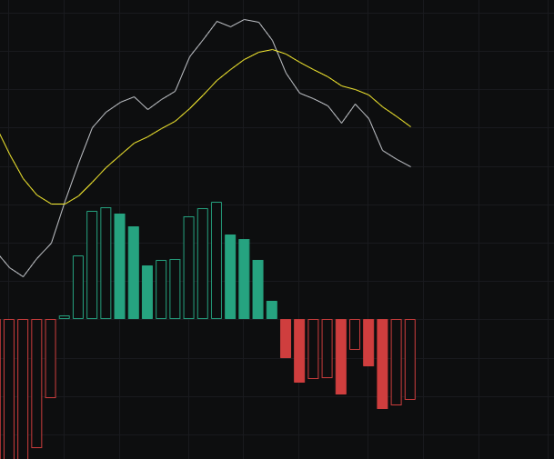
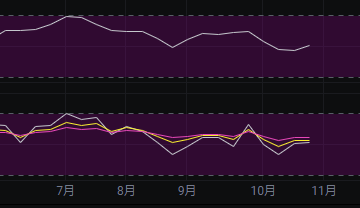
From the MACD perspective, the energy bars are retracting, but the fast line and slow line are still under pressure. If we want to see a bullish trend later, it would be best for the fast line and slow line to probe downwards again to better accumulate energy. Since a downward probe is expected, we will continue to look bearish.
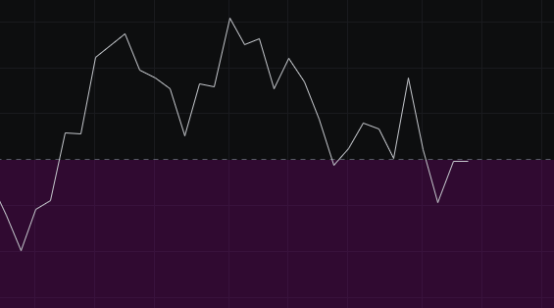
From the CCI perspective, the CCI has risen from below to around 100, which is the previous critical point. If the CCI breaks above 100, the possibility of further upward movement is significant. If it cannot break through here, the market will continue to look bearish.
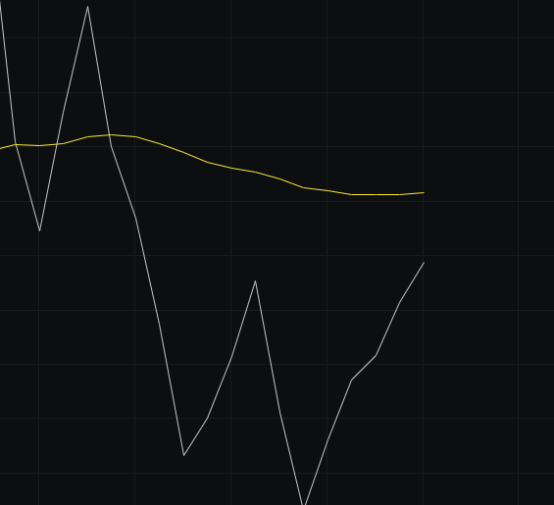
From the OBV perspective, the block line has dropped below the slow line, but the direction is upward, and the slow line is also trending upwards. If we are bullish, the fast line should quickly rise above the slow line. If we are bearish, the slow line at least needs to flatten out first. We will observe how this develops.
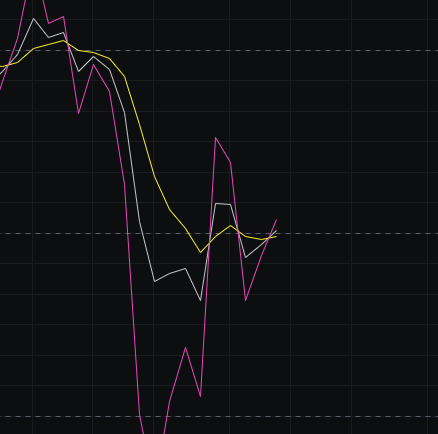
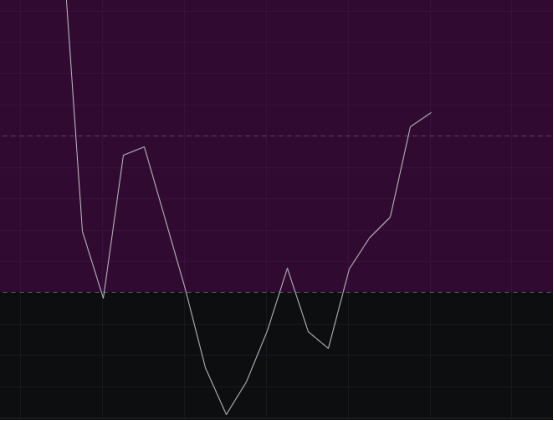
From the KDJ perspective, the KDJ is also in a state of stalemate, continuously crossing golden and dead crosses around 50. From the market perspective, it is just drawing a V shape repeatedly. Why is the market maker doing this? It’s just to kill both bulls and bears. So what happens after that? It’s time to start a trend, so the KDJ is also about to experience a trend.
From the MFI and RSI perspectives, both indicators are in a neutral range, and currently, there is no clear direction. We will have to wait for a trend to see the direction.
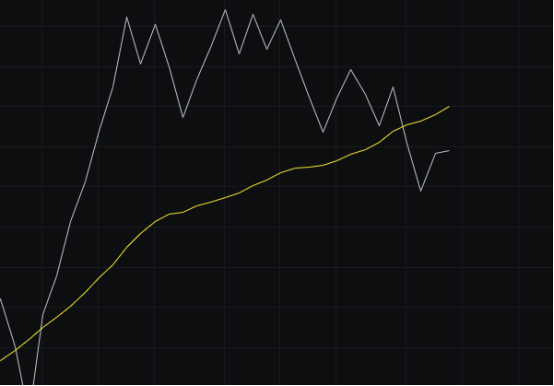
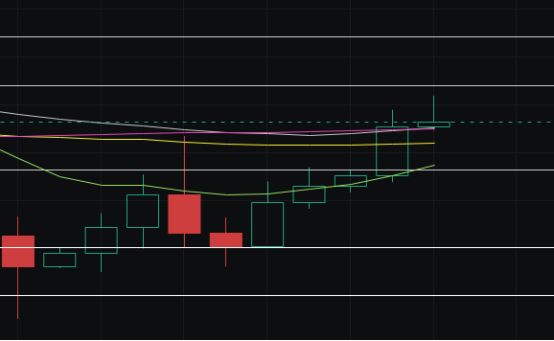
From the moving average perspective, the 30-day line has provided support for the market for 3 weeks, and the BBI has been flat for 3 weeks. The moving averages are also about to choose a direction.
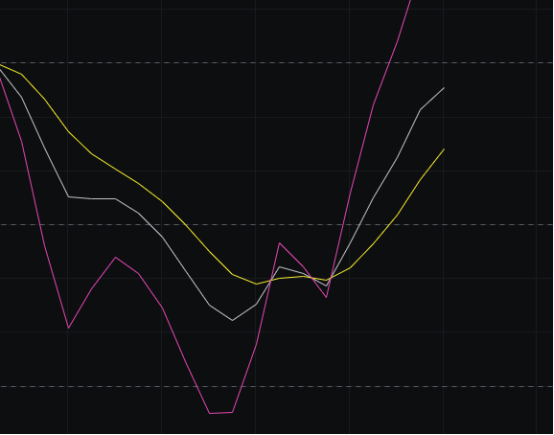
From the Bollinger Bands perspective, the bands have reached their narrowest historical point, so it is believed that the market is about to choose a direction. The market is near the middle band; if it can rise above the middle band, the likelihood of upward movement is greater. If it breaks below the middle band, the likelihood of downward movement is greater.
Daily Level
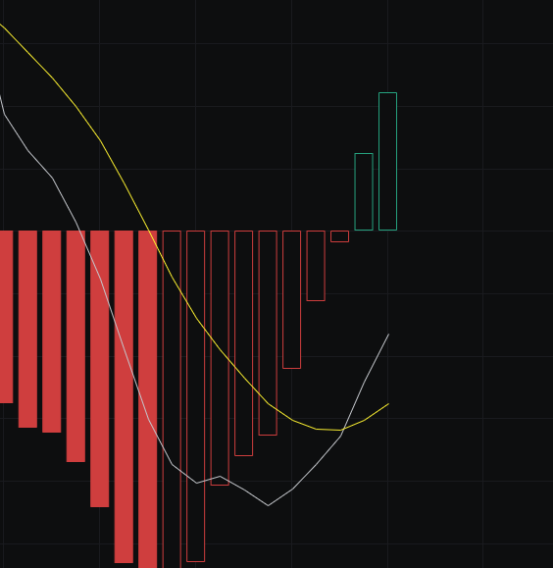
From the MACD perspective, the energy bars continue to rise and are above the zero axis, with both the fast line and slow line trending upwards, which is favorable for the bulls.
From the CCI perspective, it rose above the zero axis yesterday and is currently above it. Previously, we mentioned that for the CCI to rise above the zero axis, it needs to show a series of upward movements or a large bullish candle. Currently, it has shown 5 consecutive upward days, and the CCI has indeed risen above the zero axis as predicted. Now we need to see if the market can continue to push upwards; if it does, the CCI may break above 100.
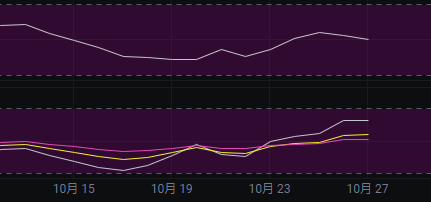
From the OBV perspective, the volume has increased in recent days, but the fast line has not yet risen above the slow line. If we want to continue to be bullish, the fast line should quickly rise above the slow line; otherwise, a crash may occur.
From the KDJ perspective, the KDJ is currently above 70 and is not far from 80. If it breaks above 80, it is likely to continue rising; if it cannot break through, it may turn down directly. The KDJ is also near a critical point.
From the MFI and RSI perspectives, the MFI is trending down while the RSI is trending up. The two indicators are not in sync, which will require time to correct. The correction may be completed in a day or two, and we will see whether it trends up or down afterward.
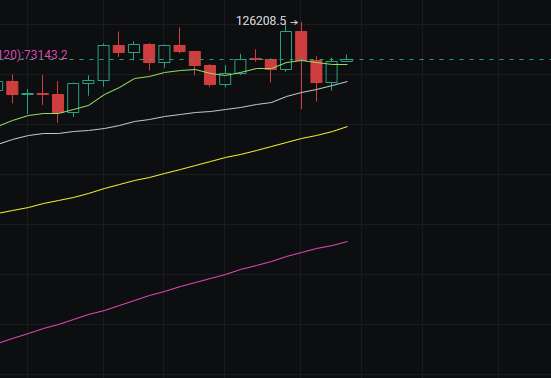
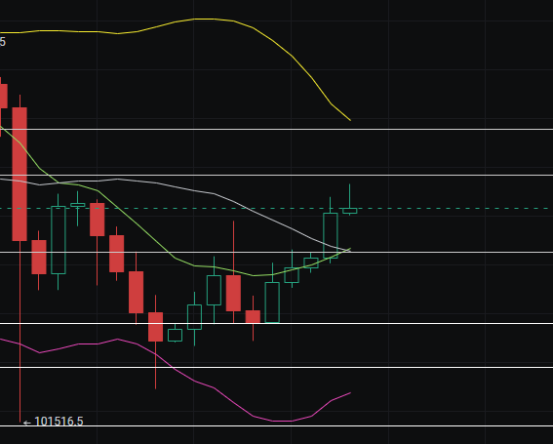
From the moving average perspective, the market is above the BBI, and a golden cross has occurred between the 30-day and 120-day lines, which is favorable for the bulls. However, whether the golden cross can be sustained is the key point for our bullish outlook, and this will require observation over the next few days.
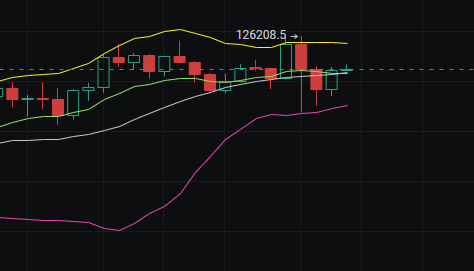
From the Bollinger Bands perspective, the bands continue to show wide fluctuations, and the amplitude is still somewhat wide, so it is logical to continue with wide fluctuations. Since there is a possibility of continuing wide fluctuations, the market will likely move around the middle band. Therefore, the market's volatility over the next two days may not be very large, and we will need to wait for the wide fluctuations to end and transition to narrow fluctuations before a good market can occur.
In summary: From the weekly perspective, the Bollinger Bands are at their narrowest position historically, and several indicators are near critical points, so a direction choice is expected soon. The resistance is seen at 117000-120000, and support is seen at 112000-109000.
免责声明:本文章仅代表作者个人观点,不代表本平台的立场和观点。本文章仅供信息分享,不构成对任何人的任何投资建议。用户与作者之间的任何争议,与本平台无关。如网页中刊载的文章或图片涉及侵权,请提供相关的权利证明和身份证明发送邮件到support@aicoin.com,本平台相关工作人员将会进行核查。