By examining 10 classic indicators, we assess the characteristics and limitations of these indicators and outline the intrinsic changes in Bitcoin and the entire cryptocurrency market.
Author: WEEX Labs
In each bull market cycle of Bitcoin, some overheating signals often appear at the price peak. However, this bull market seems to have undergone some significant changes—many previously tested indicators have not yet signaled a peak, while Bitcoin's price has continued to decline since reaching a new high on October 6, further driving many indicators bearish.
In the following sections, we will examine 10 classic indicators, evaluate their characteristics and limitations, and outline the intrinsic changes in Bitcoin and the entire cryptocurrency market.
1. Pi Cycle Top Indicator: Has the cycle peak been reached?
The Pi Cycle Top Indicator is a classic tool for identifying Bitcoin price tops through the 111-day moving average (111DMA) and the 350-day moving average multiplied by 2 (350DMA x 2).
Generally, when the short-term line crosses above the long-term line, it often signals a market top, as this indicates that prices are rising too quickly, detached from fundamental support.
Historically, the Pi Cycle Top Indicator has shown crossover performance before the top of each bull market:
2017 Top: 111DMA crossed above 350DMA x 2, marking the subsequent bubble burst;
2021 Double Top: Similar crossover occurred, leading to the first top, followed by a rapid market correction;
Currently (Q4 2025), as shown in the figure below, the two lines have not yet crossed.

Source: https://www.bitcoinmagazinepro.com/charts/pi-cycle-top-indicator
2. Puell Multiple: Are miners' profits excessive?
The Puell Multiple measures the ratio of miners' daily income to the 365-day moving average, used to assess miners' profit levels and market cycles.
Its principle is based on miner behavior: a high ratio indicates that miners are making substantial profits, which may increase selling pressure and form a top; a low ratio indicates miner capitulation, signaling a bottom. In other words, a high Puell Multiple reflects that the market is "too profitable for miners," accumulating supply pressure.
Historically, the Puell Multiple has also shown extreme spikes before the top of each bull market:
2017 Top: Exceeded 7, a historical high;
2021 Double Top: Exceeded 3, followed by a crash;
Currently (Q4 2025), the Puell Multiple is in the range of 1-2, indicating moderate miner pressure.
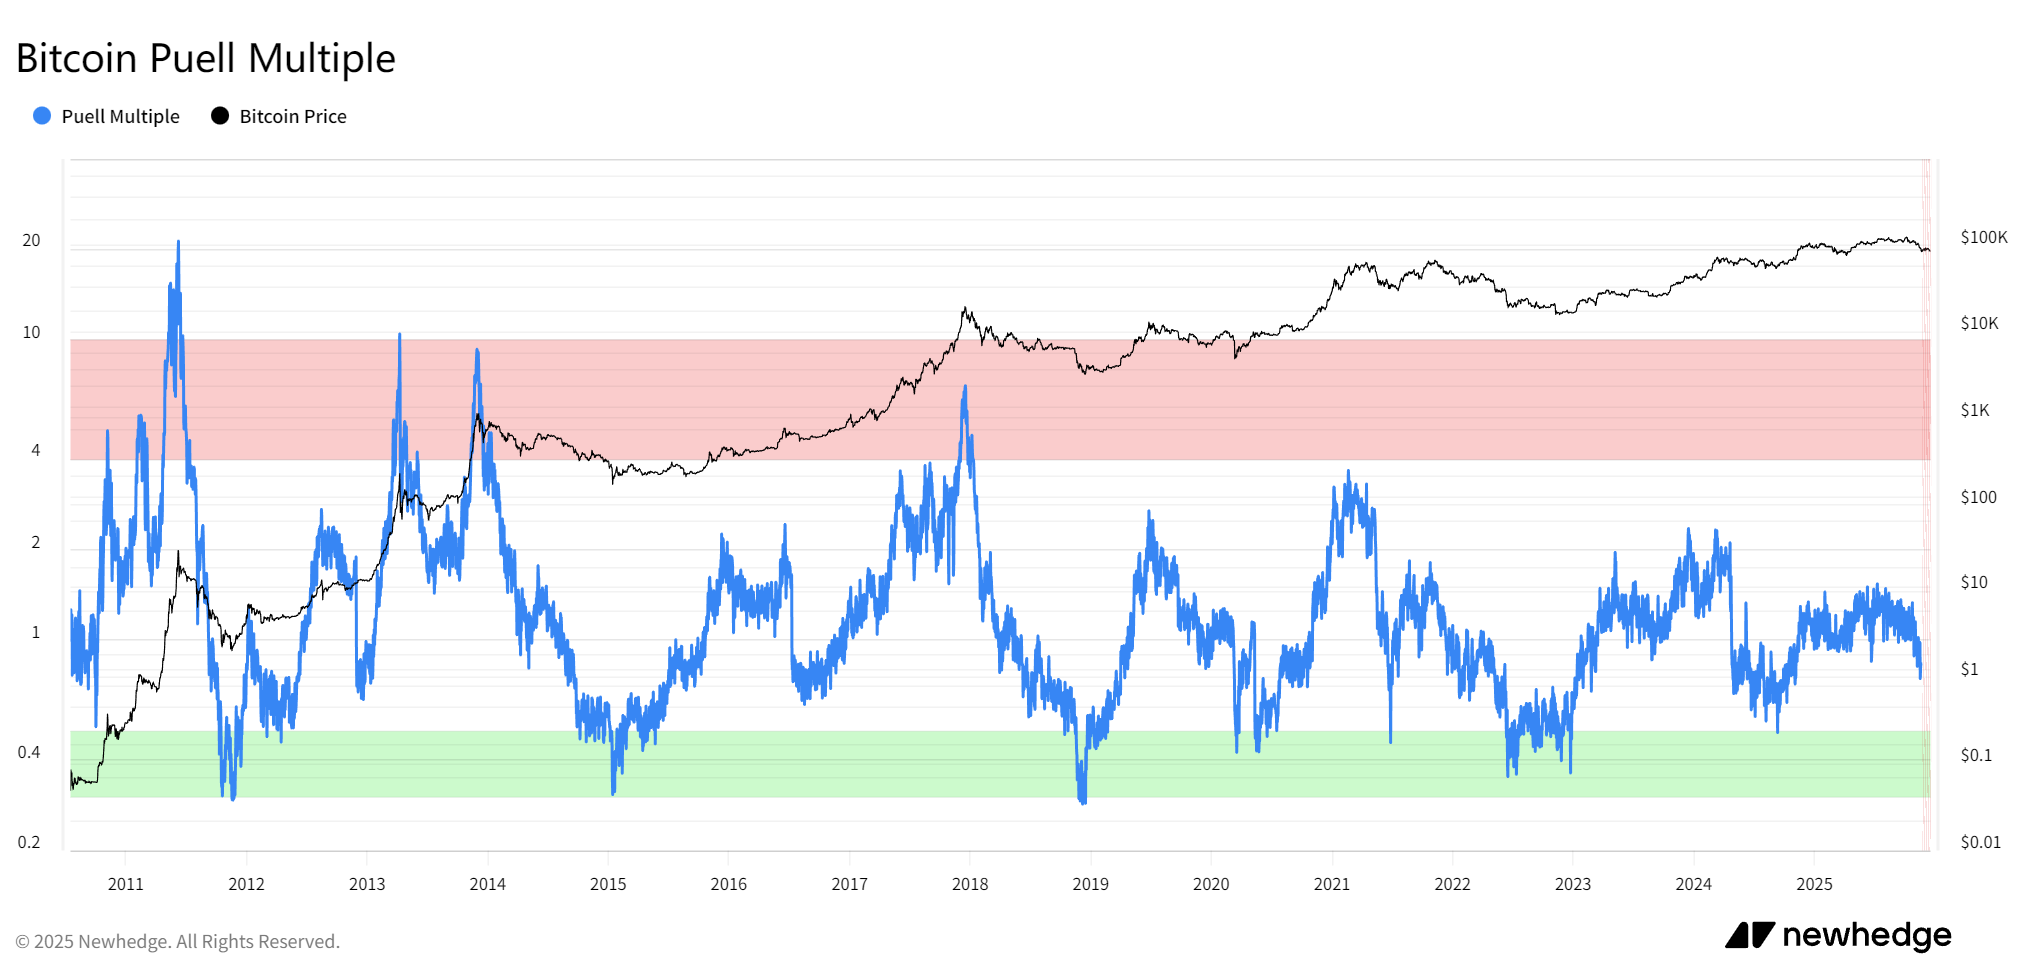
Source: https://newhedge.io/bitcoin/puell-multiple
3. Bitcoin Rainbow Chart: Has the price entered the "sell" zone?
The Bitcoin Rainbow Chart uses a logarithmic growth curve overlaid with rainbow-colored bands to assess Bitcoin's long-term valuation levels.
Its principle maps prices to the color bands: the blue zone indicates undervaluation (buy), while the red zone indicates overvaluation (sell). The color bands are based on historical growth curves, helping to identify extreme market sentiment.
Historically, the Bitcoin Rainbow Chart has shown entry into the red zone before the top of each bull market:
2017 Top: Deep red zone, bubble peak;
2021 Double Top: Orange-red zone, followed by a correction;
Currently (Q4 2025), the price is in the yellow to orange zone, not yet reaching the red bubble zone. We have also seen many analysts make adjustments to this indicator, but regardless of how it is adjusted, as of now, the price has indeed not reached the historical red bubble area.
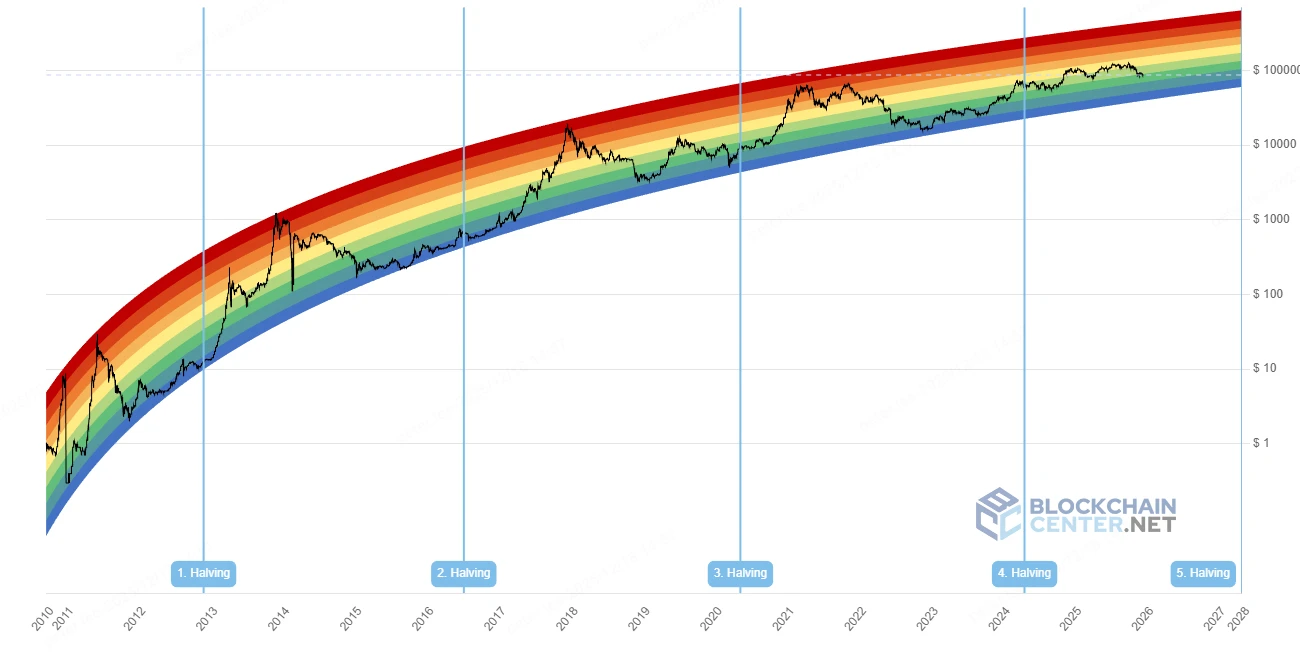
Source: https://www.blockchaincenter.net/en/bitcoin-rainbow-chart/
4. 2-Year MA Multiplier: Has the multiplier peaked?
The 2-Year MA Multiplier (also known as the Golden Ratio Multiplier) identifies price resistance zones by multiplying the 2-year moving average by the Fibonacci ratio.
Its principle combines the golden ratio (1.6) and the Fibonacci sequence to assess the multiple of price relative to the long-term average: a high multiple indicates overheating, signaling a potential correction. In other words, a high multiple means the price is "too far from the long-term trend," accumulating risk.
Historically, the 2-Year MA Multiplier has shown extreme multiples before the top of each bull market:
2017 Top: The indicator was 10 times different from the price, with the price peaking one month after crossing 2 Yr MA * 5;
2021 Double Top: Exceeded 5 times, with the price touching 2 Yr MA * 5 before reaching the first top;
Currently (Q4 2025), the multiple is in the range of 2-3, not yet entering the high multiple zone.
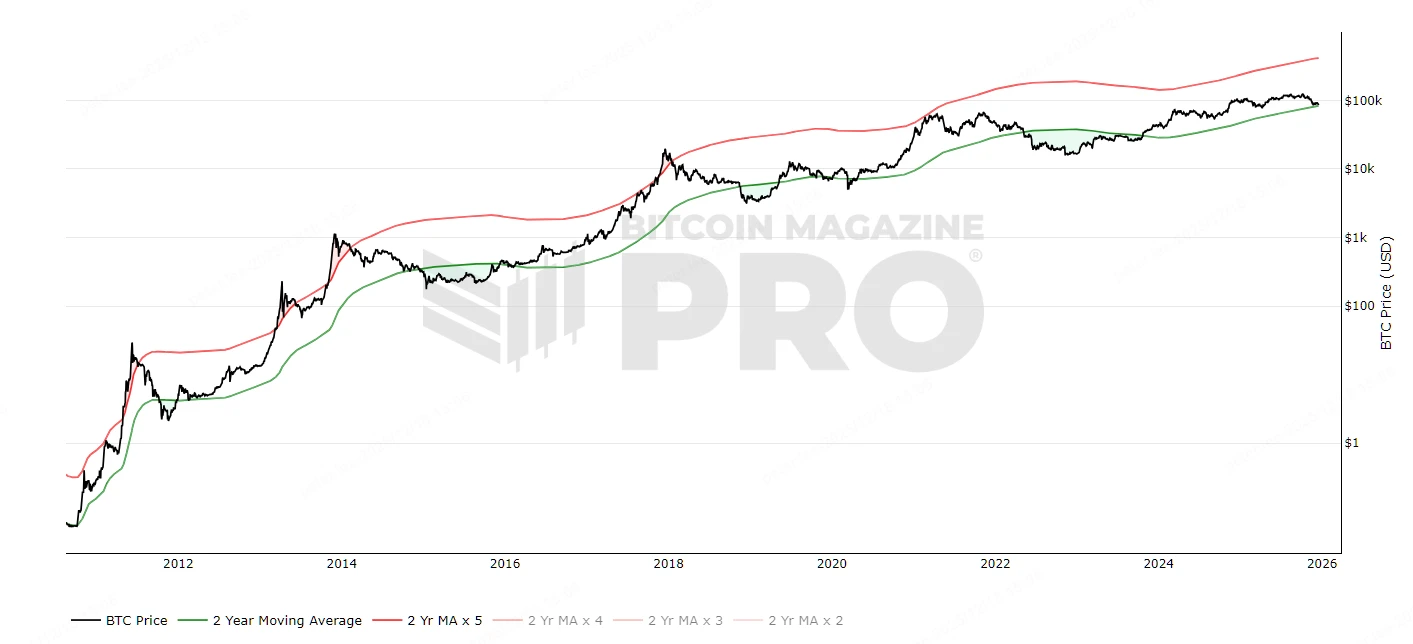
Source: https://www.bitcoinmagazinepro.com/charts/bitcoin-investor-tool/
5. Bitcoin 4-Year Moving Average: Is the price far above the long-term average?
The Bitcoin 4-Year Moving Average calculates the average price over 4 years to assess the macro trend of Bitcoin.
Its principle smooths out cyclical fluctuations: prices far above the average indicate overheating; prices close to the average indicate balance. In other words, excessive deviation means "cyclical bubbles," accumulating risk.
Historically, the Bitcoin 4-Year Moving Average has shown extreme price deviations before the top of each bull market:
2017 Top: The indicator reached 16;
2021 Double Top: Reached 6 at the first top, followed by a crash;
Currently (Q4 2025), the price has peaked at 2.3, showing a decreasing peak characteristic.
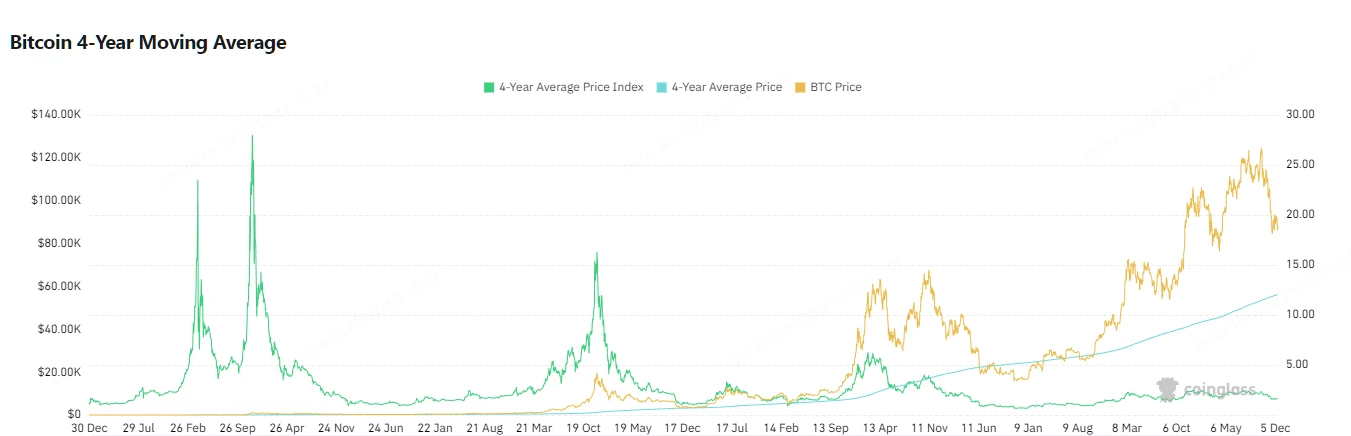
Source: https://www.coinglass.com/pro/i/four-year-moving-average
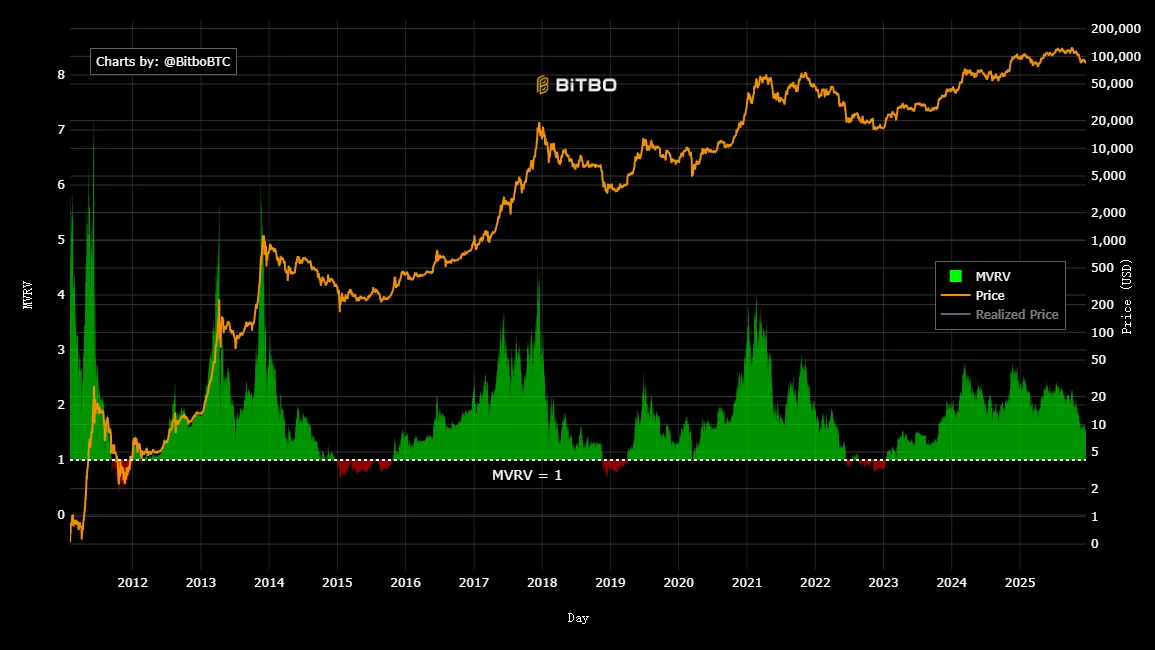
6. Bitcoin MVRV Z-Score: Has the valuation entered the risk zone?
The MVRV Z-Score is a classic on-chain indicator that determines whether Bitcoin's valuation is "deviating from its true value."
Its principle compares Bitcoin's current market value with its "realized value" (the total cost basis of all coins held) and then calculates the degree of standard deviation. In other words, a higher Z-Score means that most people are in a profit state, and the market is "too profitable," leading to risk accumulation.
Historically, the MVRV Z-Score has shown extreme spikes before the top of each bull market:
2017 Top: Approached 10, a historical extreme;
2021 Double Top: The first top exceeded 7, followed by a market crash;
Currently (Q4 2025), the Z-Score is in the range of 2-4, with valuation still in a neutral state.
Source: https://charts.bitbo.io/mvrv-z-score
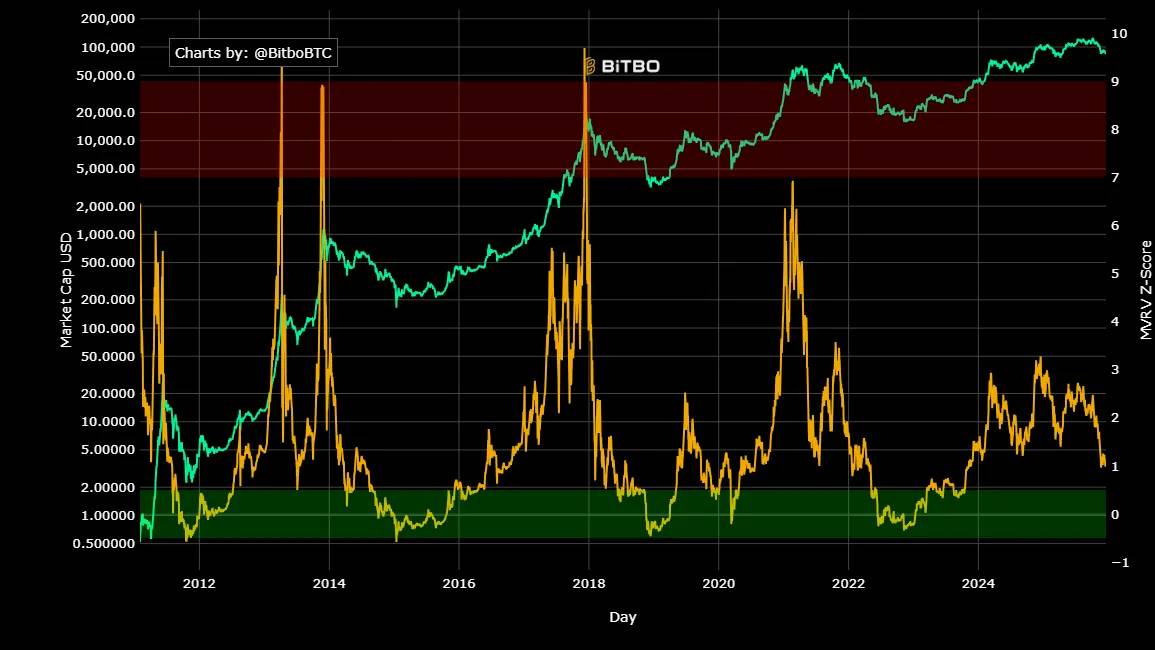
It is worth mentioning that the MVRV Rate adds statistical analysis to the MVRV, measuring the standard deviation between the current MVRV and its historical average. This standardization helps identify when Bitcoin's trading price is above or below "fair value." However, as shown in the figure below, the value at the peak of each bull market also shows a decreasing trend, and there has even been divergence between the price and the peak, greatly increasing the difficulty of using this indicator to predict tops.
Source: https://charts.bitbo.io/mvrv
7. Altcoin Season Index: Has the altcoin season started?
The Altcoin Season Index tracks the performance of the top 100 altcoins relative to Bitcoin, assessing whether the "alt season" has begun.
Its principle is based on relative performance: an index above 75 indicates the start of alt season, often occurring after the BTC top, with funds flowing from BTC to altcoins. In other words, a high index means that BTC's dominance is weakening, and market risk is diversifying.
Historically, at the top of each bull market, the frenzy of alt season has served as a concluding signal:
2017 Top: Exceeded 90, alt season erupted;
2021 Double Top: Exceeded 80, followed by a BTC correction;
Currently (Q4 2025), the index is in the range of 30-40, with the altcoin sector performing poorly. In fact, since the beginning of this BTC bull market, this indicator has not even reached 60, which may be due to insufficient liquidity and an excessive issuance of new coins.

Source: https://www.blockchaincenter.net/en/altcoin-season-index
8. Bitcoin Long Term Holder Supply (LTH): Is the supply of long-term holders decreasing?
Bitcoin Long Term Holder Supply (LTH) tracks the supply of Bitcoin held for more than 155 days, reflecting HODLer behavior.
Its principle is to observe supply changes: at the top, LTH tends to sell off to realize profits; at the bottom, they accumulate. In other words, a decrease in LTH supply means "smart money" is leaving the market, indicating high risk.
Historically, LTH has shown significant reductions before the top of each bull market:
2017 Top: The sell-off lasted for a year, peaking at the top;
2021 Double Top: The first top followed a continuous sell-off for six months, but the accumulation at the second top reached a historical high;
Currently (Q4 2025), there has been a slow sell-off for six months, but it does not align with historical experience at the October peak.

Source: https://charts.bitbo.io/long-term-holder-supply
9. Bitcoin Short Term Holder Supply (STH): Is there a surge in short-term holder supply?
Bitcoin Short Term Holder Supply (STH) tracks the proportion of Bitcoin held for less than 155 days, assessing novice speculation.
Its principle captures new capital inflow: a high proportion indicates rampant speculation, often signaling a top; a low proportion indicates market maturity. In other words, a high STH means "too many newcomers," making the bubble prone to bursting.
Historically, STH has shown spikes before the top of each bull market:
2017 Top: Nearly 8M BTC, peak speculation;
2021 Double Top: Nearly 6.5M BTC at the first top, the second absolute top's sell-off did not reach a peak;
Currently, STH is continuously climbing close to 5.5M BTC, but the price peak was on October 6, which is no longer as closely aligned with the STH peak as in the past two bull markets.
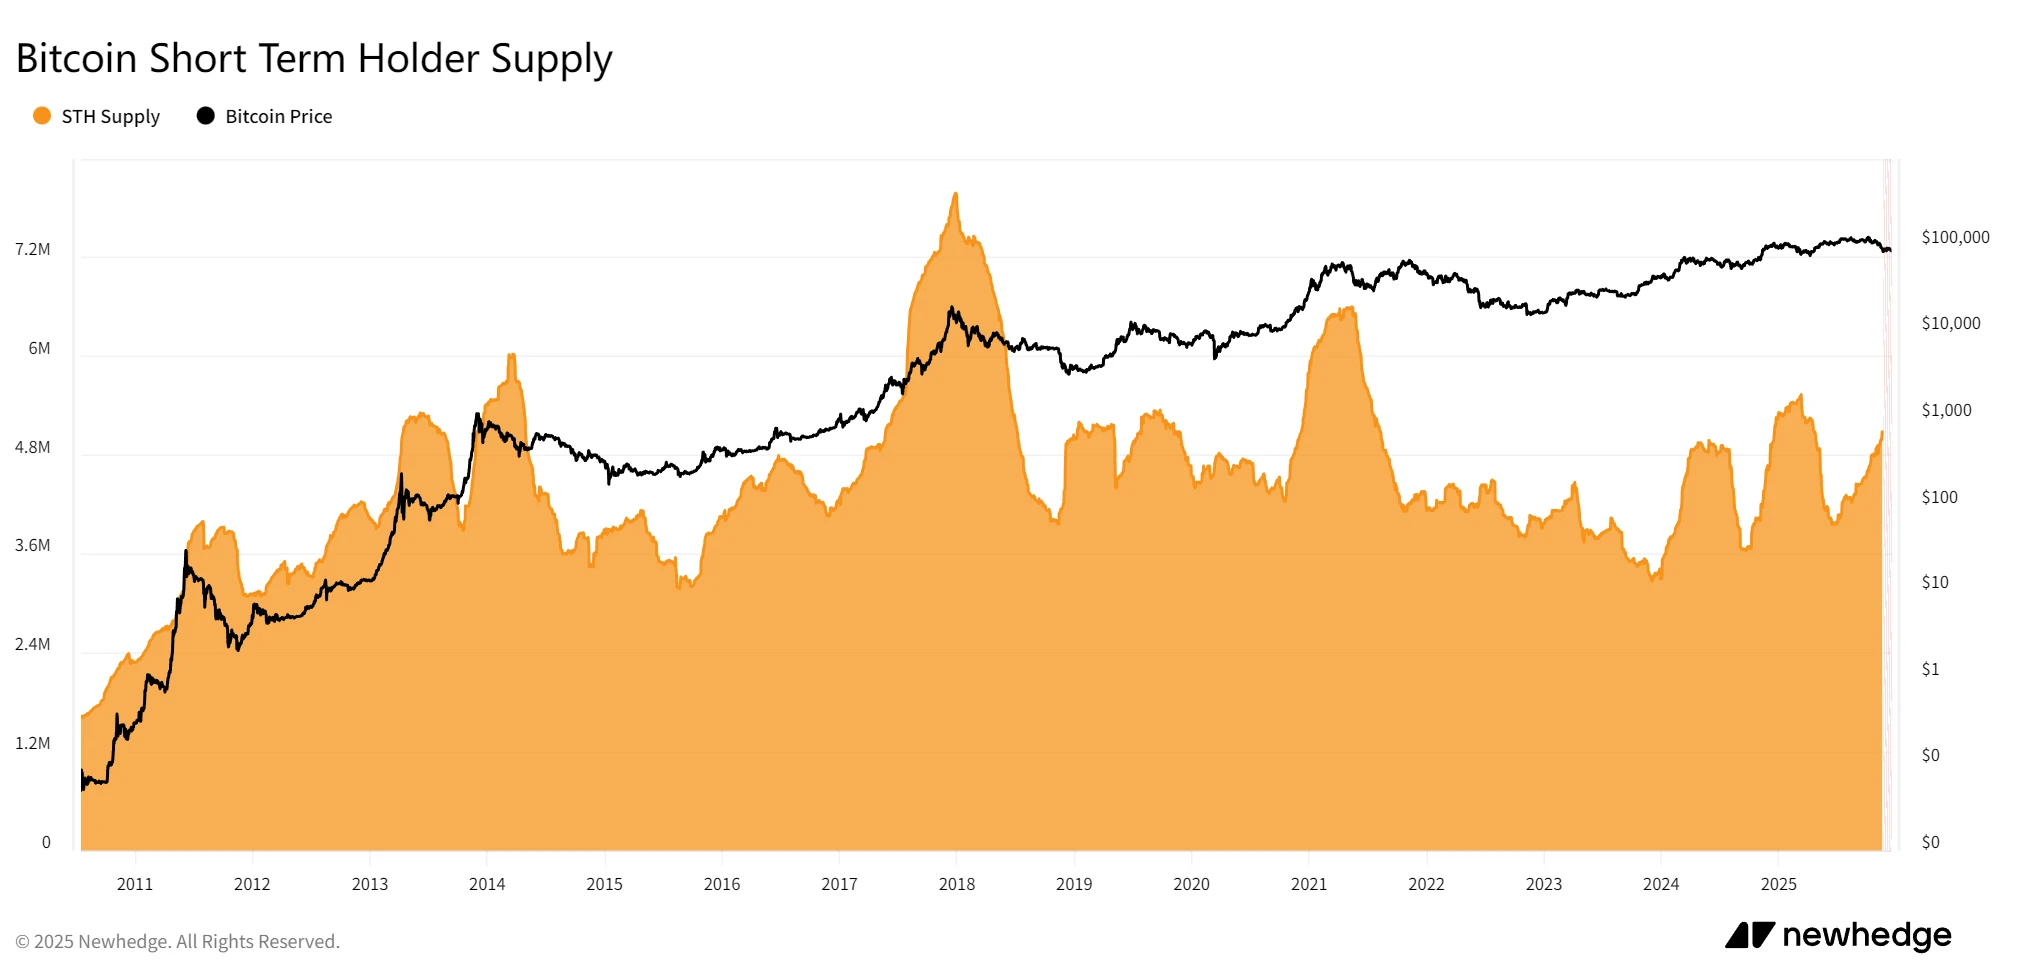
Source: https://newhedge.io/bitcoin/short-term-holder-supply
10. Bitcoin Net Unrealized Profit/Loss (NUPL): Has the unrealized profit/loss entered the greed zone?
Bitcoin NUPL measures the overall unrealized profit/loss ratio of the network, assessing market sentiment.
Its principle is: calculate market value minus realized value, then divide by market value: above 0.75 indicates greed (top signal); below 0 indicates fear (bottom). In other words, a high NUPL means "everyone is in profit," indicating high sell-off risk.
Historically, Bitcoin NUPL has shown extremely high performance before the top of each bull market:
2017 Top: Exceeded 0.8, a historical extreme;
2021 Double Top: Exceeded 0.7, followed by a crash;
Currently (Q4 2025), NUPL has been oscillating after reaching a high of 0.64 in early March 2024, and has now dropped to 0.34.

Source: https://charts.bitbo.io/net-unrealized-profit-loss
Conclusion: Structural Changes in This Bitcoin Bull Market
From the above indicators, the current Bitcoin market trend does not highly align with the extreme performances seen at past bull market tops. Historical tops are often accompanied by multiple indicators simultaneously overheating, such as high Z-Score, high Puell Multiple, and NUPL entering the greed zone, along with LTH sell-offs and STH surges. However, the performance of these indicators is currently quite moderate.
This does not imply that the current Bitcoin price has not peaked; these indicators are based on spatial judgment. The following diagram, which predicts the price peak over a 3-year cycle, seems to indicate that Bitcoin has already peaked.

Source: https://x.com/btc_MasterPlan/status/1978180632410042828/photo/1
Of course, in analyzing the above indicators, we also found that these tools, which predict based on linear price trends, have already shown signs of decline when predicting peak areas, exhibiting diminishing marginal characteristics. For example, the MVRV peak values at the tops of the bull markets in 2017, 2021, and 2025 were 10, 7, and 3, respectively. We clearly cannot expect the current bull market to see MVRV reach 7, nor is it easy to predict a reliable value corresponding to the original bull market peak from MVRV.
In other words, while these indicators suggest that the market is in a neutral or moderate range, they do not confirm that the bull market is still ongoing or that a bear market has arrived. Instead, they indicate that the growth of the current Bitcoin market has become more gradual rather than explosive, which may be attributed to:
• First, the introduction of Bitcoin ETFs has attracted a large amount of long-term capital, stabilizing supply dynamics, contrasting with past retail-driven bubbles and slowing overheating.
• Second, changes in global liquidity in 2025 (Federal Reserve rate cuts vs. yen rate hikes) and geopolitical changes have repeatedly disturbed BTC's price, while the stable changes in various indicators precisely reflect a more mature market.
In summary, whether the current peak on October 6 is the top of this bull market or not, we must acknowledge that Bitcoin's price fluctuations may have broken through past historical frameworks and experiences. It seems to be undergoing a structural transformation from a "cyclical asset" to a "mainstream reserve." It is important to remind investors that these indicators may need to adjust their thresholds or be used in combination to better inform investment decisions.
About Us
WEEX Labs is the research department under WEEX, dedicated to tracking and analyzing cryptocurrency, blockchain technology, and emerging market trends, providing professional assessments.
The team adheres to principles of objective, independent, and comprehensive analysis, aiming to explore cutting-edge trends and investment opportunities through rigorous research methods and advanced data analysis, delivering comprehensive, rigorous, and clear insights for the industry, and providing comprehensive construction and investment guidance for Web3 startups and investors.
Disclaimer
The views expressed in this article are for reference only and do not constitute endorsement of any products or services discussed, nor do they constitute any investment, financial, or trading advice. Readers should consult qualified professionals before making financial decisions. Please note that WEEX Labs may restrict or prohibit all or part of its services from restricted areas.
免责声明:本文章仅代表作者个人观点,不代表本平台的立场和观点。本文章仅供信息分享,不构成对任何人的任何投资建议。用户与作者之间的任何争议,与本平台无关。如网页中刊载的文章或图片涉及侵权,请提供相关的权利证明和身份证明发送邮件到support@aicoin.com,本平台相关工作人员将会进行核查。


