比特币在经历一轮V型反转反弹后,进入短线横盘整理格局。自4月13日 17:00触及低点70678美元,市场买盘逐步回笼,今晨九点左右,报价为76323美元,24小时在74821-76927的狭窄区间内反复震荡。以太坊同步延续修复走势,4月9日 22:00跌至2164美元低谷后,4月18日 01:00冲上2451美元峰值,今晨窄幅收复2300美元关卡,报价2324美元,24小时涨幅+0.12%。
截止今日22日下午,比特币因美伊停火延长带来的风险偏好回升以及下周二FOMC会议的降息预期,部分机构仍然偏向于鸽派路线,为流动性资产提供底部支撑。并强势突破78000美元关卡,截止撰稿时间报价为78394美元,单日上涨3.19%站上近两周峰值。以太坊同步跟进,截止撰稿时间报价为2408美元,单日上涨3.26%,距4月18日峰值2451美元仅2.4%之差。
比特币四小时图
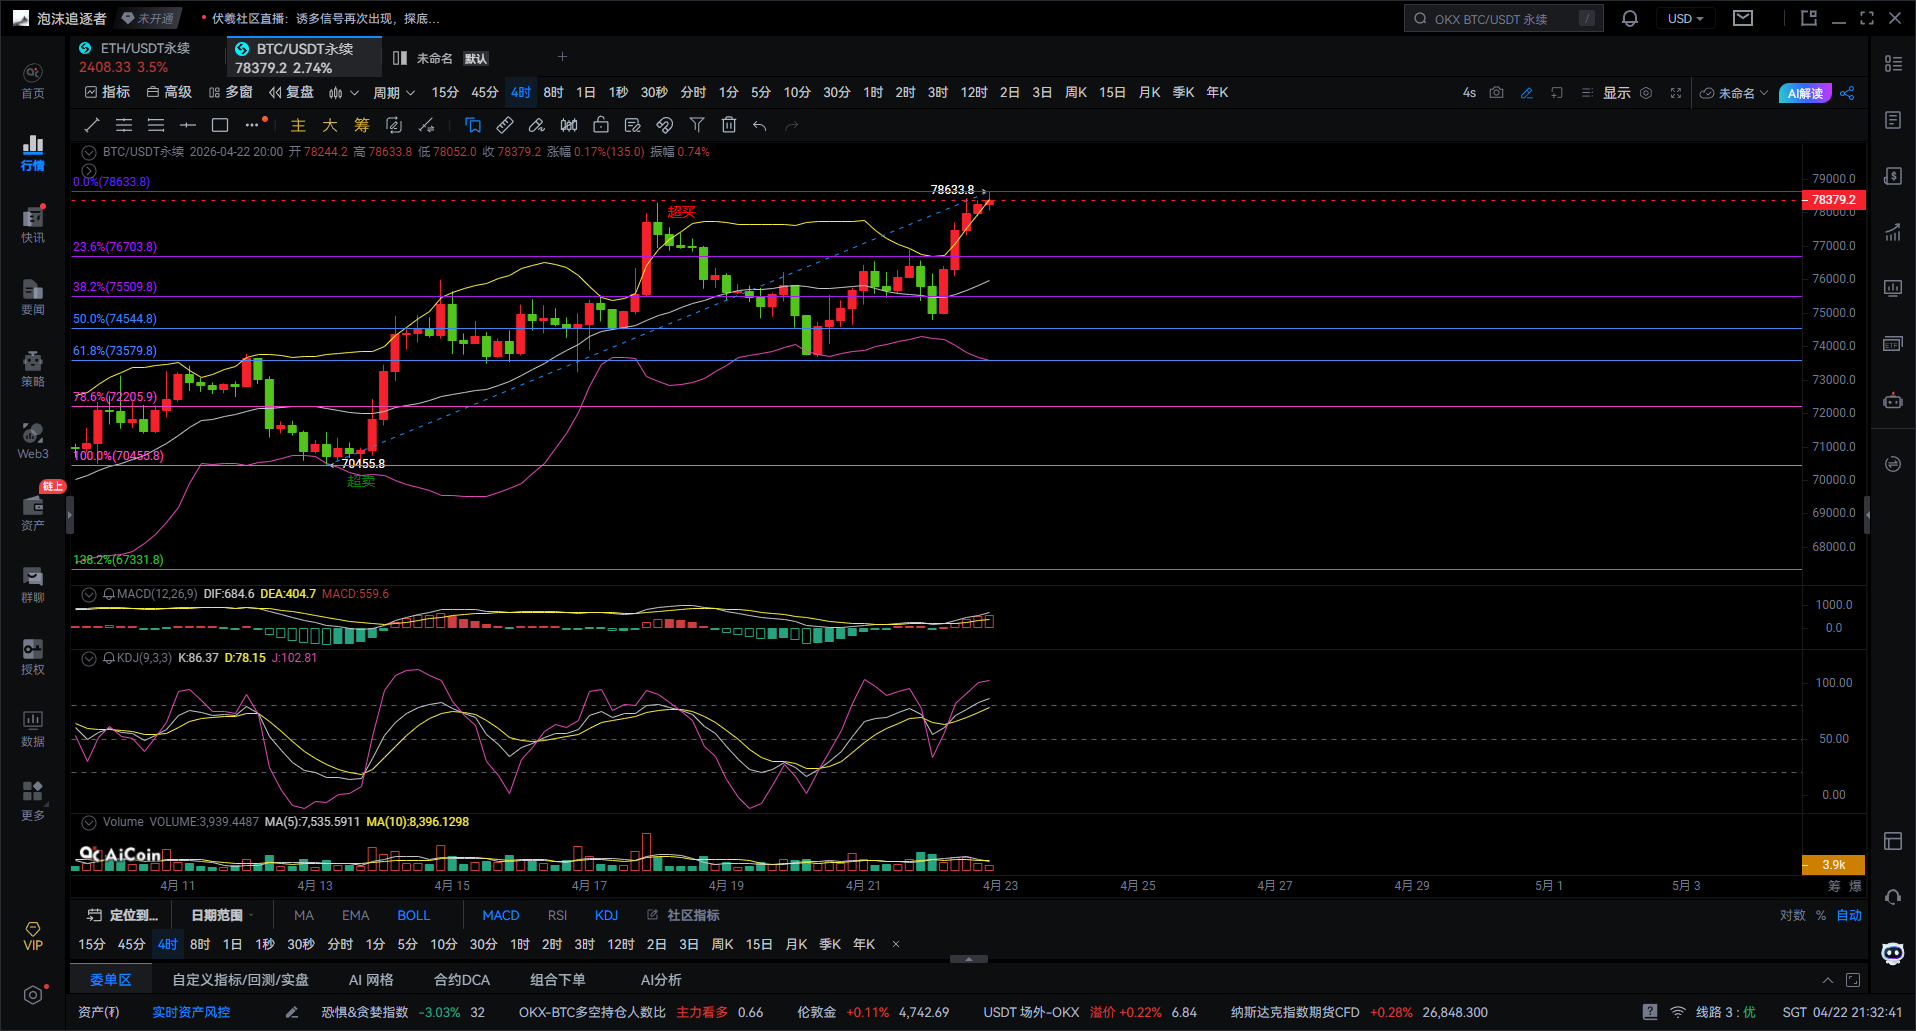
斐波那契结构显示价格已冲至前高78633附近区域。本轮行情从70455启动拉升至78633,目前价格正位于前期高点压力区进行测试。当前价位已站上0.236回撤位76703,并远离0.382位75509,直接试探78600附近前高压制。这表明多头力量仍然强劲,但该区域同时也是短线获利了结的区间。
布林带指标呈现上轨开口状态,价格紧贴上轨运行。布林带整体开口向上,K线已连续沿上轨推进,其中轨已上移至76000附近。这是典型的强势上涨走势特征。在强劲趋势中,回踩往往意味着机会而非风险。
MACD指标在零轴上方形成金叉且持续放量,DIF与DEA线保持上行,红色能量柱再度放大。这显示资金仍在持续推动价格上涨。在MACD未出现顶背离信号之前,不宜轻易判断多头趋势终结。
KDJ指标已进入高位超买区运行,K值与D值位于80上方,J值更是突破100。这意味着短线市场进入过热状态,可能出现震荡回踩。但在强势行情中,超买状态可能持续,甚至出现“超买再超买”的现象。
当前比特币处于突破后的加速阶段,并非见顶信号。接下来走势有两种可能:第一种是大概率情景,即价格先进行震荡,再向上突破新高。可能的回踩区域在77800至76700之间,企稳后将继续冲击79000,突破后则看向80000整数关口。第二种是洗盘情景,即出现快速插针式回踩。若跌破76700,可能进一步回踩至75500(对应斐波那契0.382位)。但只要75500关键位置不被有效跌破,整体强势多头结构就依然保持。
关键位置提示如下:短线支撑在77800,强势支撑位于76700,多空分界线为75500。上方压力在78600,突破后的目标看向79000至80000区间。
操作思路建议采取谨慎跟随趋势的策略:避免追高,耐心等待回踩后接多机会;若价格回踩至76700附近并出现企稳信号,可考虑布局多单;若价格强势突破78600压力,则可顺势跟进;倘若价格跌破75500多空分界,则短线应考虑离场观望。
请记住,强势行情往往遵循“强者恒强”的逻辑,顶部不是单纯因为价格上涨而形成的,而是由下跌信号确认的。目前盘面尚未给出明确的顶部信号,因此顺应趋势、以做多为主仍是当前的主要节奏。

给你一个百分百准的建议,不如给你一个正确的思路与趋势,授人与鱼不如授人与渔,建议赚一时,思路学会赚一生!
撰稿时间:(2026-04-22,21:30)
(文-大仙说币)特此申明:网络发布具有延迟,以上建议仅供参考。投资有风险,入市需谨慎!
免责声明:本文章仅代表作者个人观点,不代表本平台的立场和观点。本文章仅供信息分享,不构成对任何人的任何投资建议。用户与作者之间的任何争议,与本平台无关。如网页中刊载的文章或图片涉及侵权,请提供相关的权利证明和身份证明发送邮件到support@aicoin.com,本平台相关工作人员将会进行核查。