After experiencing a V-shaped reversal rebound, Bitcoin has entered a short-term horizontal consolidation pattern. Since hitting a low of $70,678 at 17:00 on April 13, market buying has gradually returned. Around 9:00 this morning, the price was $76,323, fluctuating repeatedly within a narrow range of $74,821 to $76,927 over the past 24 hours. Ethereum has continued its recovery trend, dropping to a low of $2,164 at 22:00 on April 9, then surging to a peak of $2,451 at 01:00 on April 18, and this morning narrowly reclaiming the $2,300 mark, with a price of $2,324 and a 24-hour increase of +0.12%.
As of today, April 22, Bitcoin has benefitted from the rise in risk appetite due to the extended ceasefire between the U.S. and Iran, as well as the expectation of an interest rate cut at the FOMC meeting next Tuesday. Some institutions continue to lean towards a dovish stance, providing bottom support for liquid assets. Bitcoin has strongly broken through the $78,000 level, with the price as of the time of writing at $78,394, up 3.19% on the day, reaching its highest point in nearly two weeks. Ethereum has also followed suit, with the price at $2,408, up 3.26% on the day, just 2.4% away from its peak of $2,451 on April 18.
Bitcoin four-hour chart
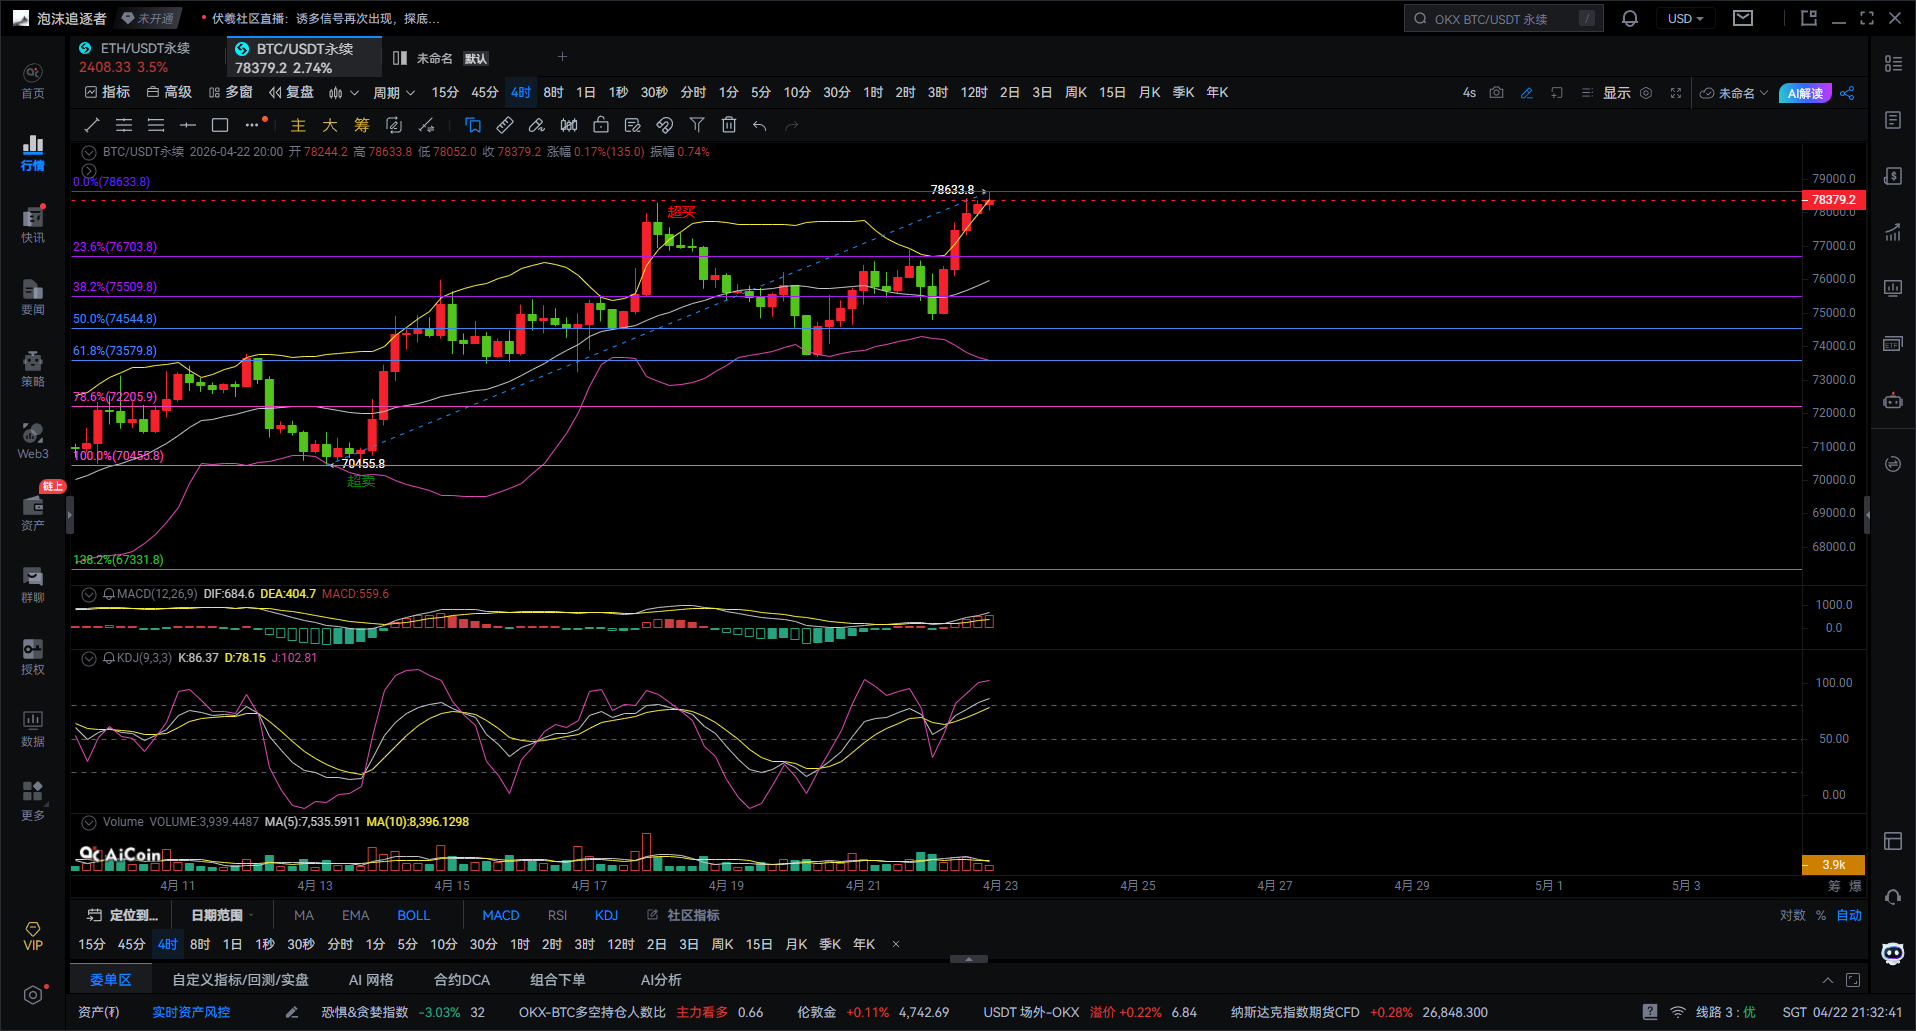
The Fibonacci structure shows that the price has surged to the area near the previous high of $78,633. This round of market movement started from $70,455 and rose to $78,633; currently, the price is testing the previous high pressure zone. The current price has crossed the 0.236 retracement level of $76,703 and is far from the 0.382 level of $75,509, directly testing the previous high resistance near $78,600. This indicates that bullish momentum remains strong, but this area is also a range for short-term profit-taking.
The Bollinger Bands indicator shows an upward opening for the upper band, with the price closely following the upper band. The overall Bollinger Bands are opening upward, with the candlesticks continuously advancing along the upper band, while the middle band has shifted up to around $76,000. This is a typical characteristic of a strong upward trend. In a strong trend, a pullback often indicates opportunity rather than risk.
The MACD indicator has formed a golden cross above the zero line and is sustaining an increase in volume, with the DIF and DEA lines maintaining an upward trajectory, and the red energy bars are expanding again. This shows that funds continue to drive the price upward. Until there is a top divergence signal in the MACD, it is unwise to hastily judge the end of the bullish trend.
The KDJ indicator has entered a high overbought zone, with K and D values above 80, and the J value has exceeded 100. This indicates that the short-term market has entered an overheated state and there may be a pullback. However, in a strong market, overbought conditions may persist, even leading to “overbought again overbought” phenomena.
Currently, Bitcoin is in an acceleration phase after breaking through and is not a signal of a peak. The next movement has two possibilities: the first is a high-probability scenario where the price first consolidates and then breaks upward to a new high. The possible pullback area is between $77,800 and $76,700, and once stabilized, it will continue to push towards $79,000, with a breakthrough targeting the $80,000 integer level. The second is a washout scenario, where a quick spike pullback occurs. If it drops below $76,700, it may pull back further to $75,500 (corresponding to the Fibonacci 0.382 level). However, as long as the key level of $75,500 is not effectively broken, the overall strong bullish structure remains intact.
Key position indications are as follows: short-term support at $77,800, strong support at $76,700, and the bullish-bearish dividing line at $75,500. The upper pressure is at $78,600, with the goal looking towards the $79,000 to $80,000 range after a breakout.
The suggested operational strategy is to adopt a cautious trend-following strategy: avoid chasing highs and patiently wait for pullback opportunities to enter long positions; if the price pulls back around $76,700 and signals stabilization, consider positioning for long trades; if the price strongly breaks through the $78,600 resistance, then follow the trend; if the price drops below the $75,500 bullish-bearish dividing line, then short-term withdrawal and observation should be considered.
Remember, strong trends often follow the logic of "the strong get stronger," and tops are not simply formed by price increases, but are confirmed by downward signals. Currently, the market has not provided clear top signals, so it remains the main rhythm to follow the trend and primarily focus on going long.

Giving you a hundred percent accurate advice is not as good as giving you the right mindset and trends. Teaching someone to fish is better than giving them fish; the advice might earn you a moment, but learning the mindset will earn you a lifetime!
Writing time: (2026-04-22, 21:30)
(Article by - Daxian Talks Coins) hereby states: There may be delays in online publication, and the above suggestions are for reference only. Investment carries risks, and entering the market requires caution!
免责声明:本文章仅代表作者个人观点,不代表本平台的立场和观点。本文章仅供信息分享,不构成对任何人的任何投资建议。用户与作者之间的任何争议,与本平台无关。如网页中刊载的文章或图片涉及侵权,请提供相关的权利证明和身份证明发送邮件到support@aicoin.com,本平台相关工作人员将会进行核查。