Author: Jonah Burian
Translator: Jiahuan, ChainCatcher
Software has devoured the world. Blockchain is sucking in all the capital.
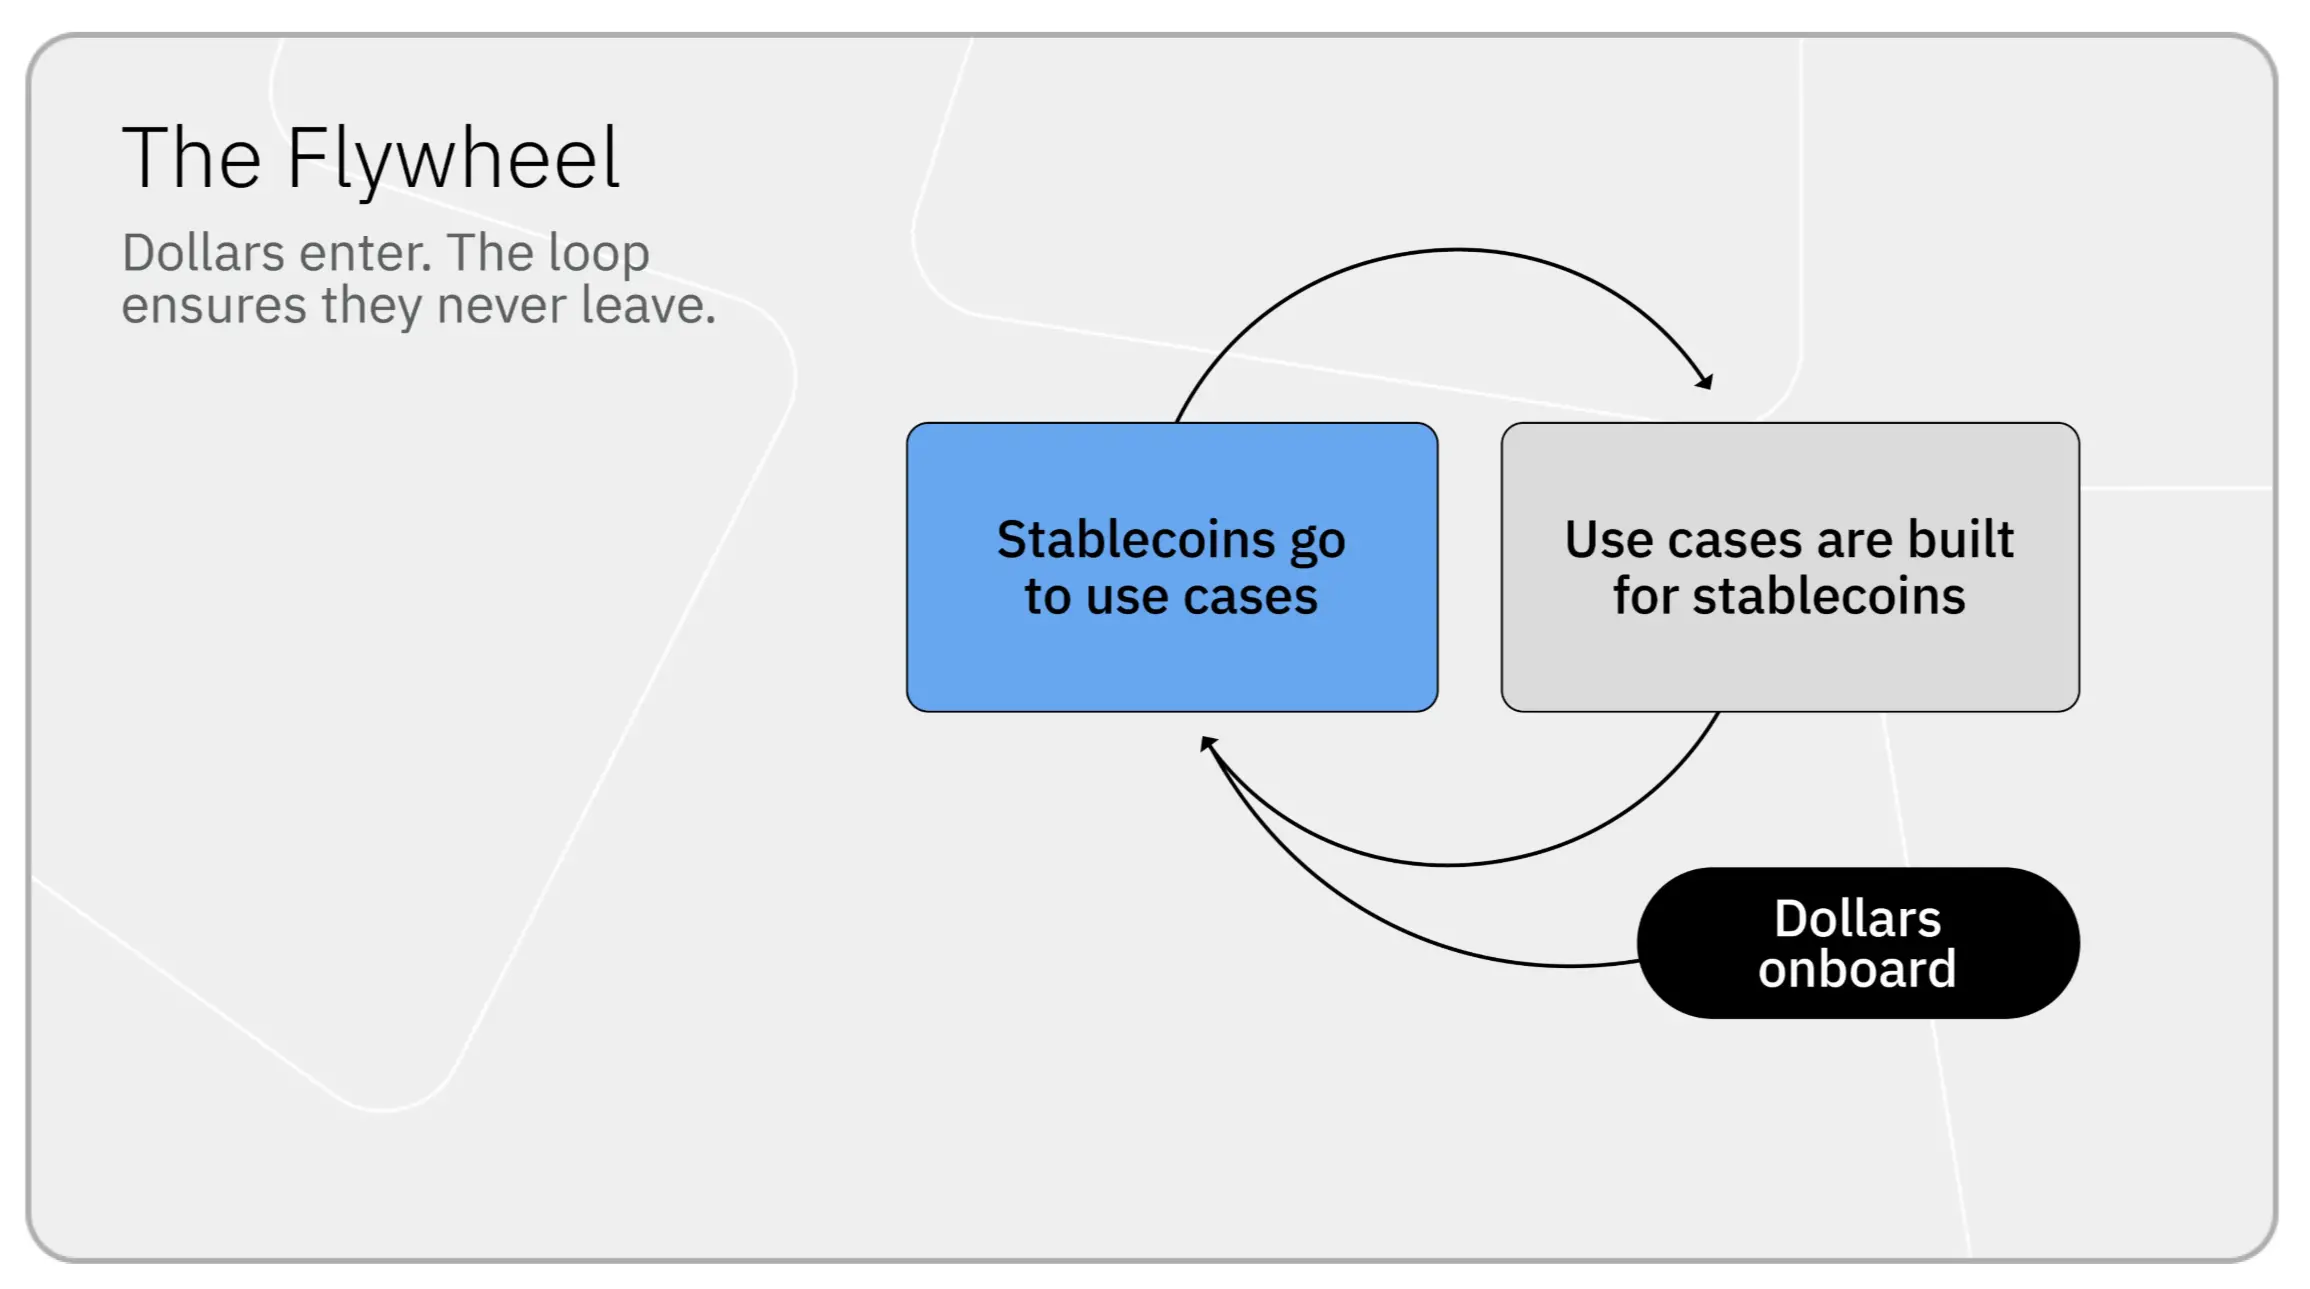
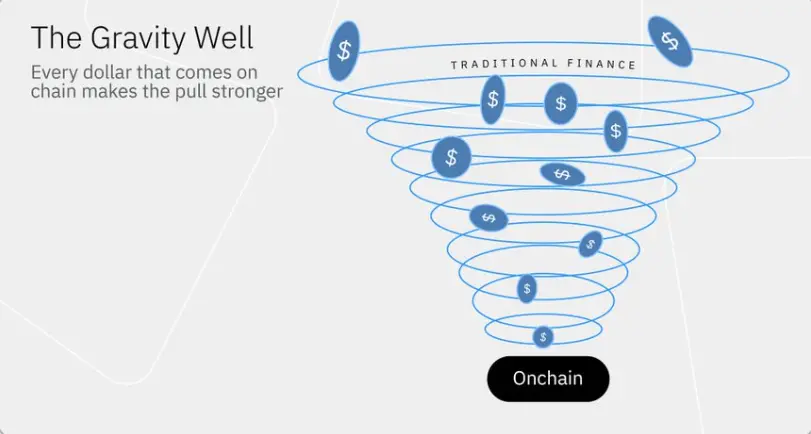
The proliferation of stablecoins and on-chain economic activities have now formed a mutually reinforcing closed loop, making this growth structurally difficult to reverse. The mechanism behind this is something that few people have truly noticed:
Stablecoins go on-chain → Developers create use cases to absorb funds → These use cases attract more stablecoins → The cycle continues
Each cycle pulls in more funds. The capital moved on-chain becomes productive, deeply embedded in lending markets, DEX, and derivatives. Withdrawing this capital back to traditional infrastructure means relinquishing all that utility. Therefore, capital stays, and the flywheel continues to turn.
This closed loop has given birth to an entirely new financial economy, generating billions of dollars in revenue each year. @CremeDeLaCrypto and I believe that the same mechanism is now starting to draw in all capital onto the chain.
Each turn of the flywheel creates value
When $1 billion of new stablecoins enter the on-chain economy, it disperses throughout the financial system and is reused over a hundred times each year, generating tens of millions of dollars in annual revenue.
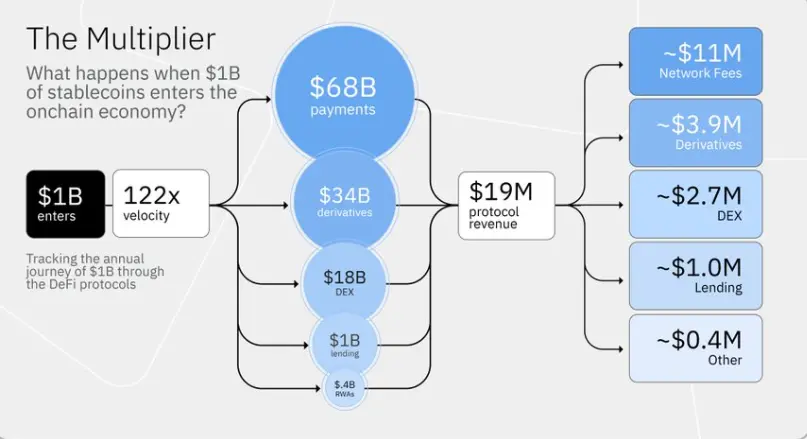
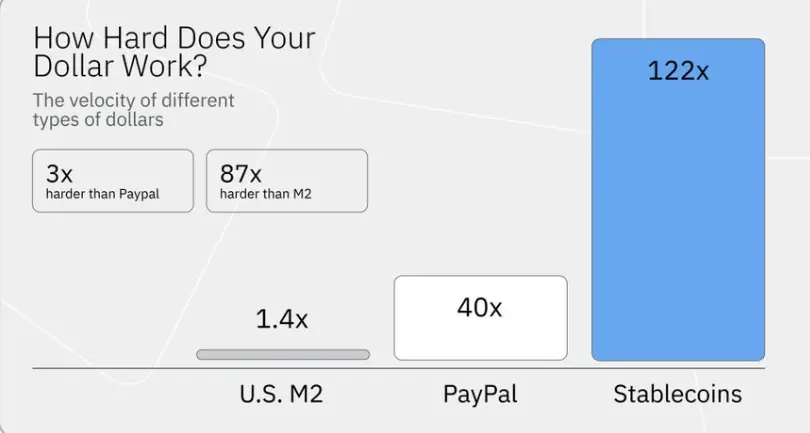
Every $1 billion of stablecoins generates about $122 billion of economic activity annually, with a turnover rate of approximately 122 times.¹
For reference, dollars in PayPal turn over about 40 times a year.² The velocity of U.S. M2 is only 1.4 times.
In other words, a dollar on the blockchain works about 3 times more efficiently than a dollar in PayPal and 87 times more than a dollar in M2. This is because stablecoins circulate repeatedly through payments, DEX, lending, etc., while traditional capital is trapped in T+1/T+2 batch settlement systems, which simply cannot achieve that.
The following is the composition of the $122 billion annual economic activity generated by $1 billion of stablecoins⁵:
Payments and transfers: approximately $68 billion; Derivatives: approximately $34 billion; DEX: approximately $18 billion; Lending: approximately $1 billion; RWA: approximately $400 million.
For every $1 billion of stablecoins introduced, approximately $19 million in protocol revenue is generated annually.⁴ This revenue supports the next generation of products and attracts the next billion scale of stablecoins to enter.
It should be noted that the $19 million only covers the directly observable on-chain income at the protocol layer. It does not include the approximately $35 million earned annually by issuers for every billion dollars (assuming a risk-free interest rate of 3.5%), nor the substantial income generated by higher layers such as wallets, payment processors, fiat exchange channels, custody, and compliance.
Overall, in the entire on-chain economy today, in 2025 alone, stablecoin issuers earned more than $13 billion from floating capital (over $10 billion from Tether and $2.7 billion from Circle), while DEX, lending protocols, derivatives platforms, and blockchain-generated stablecoin-related protocol income exceeded $5 billion.³
Capital will not leave
Once capital is on-chain, it becomes productive, allowing the closed loop to continue. It operates in lending markets, DEX, and derivatives. Returning to traditional tracks means giving up these utilities: T+1 settlement, constrained by bank business hours, isolated ledgers. So capital tends to stay.
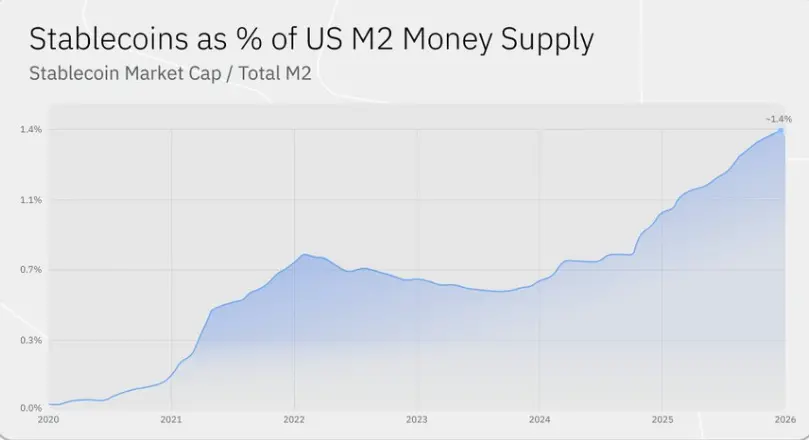
Since the beginning of 2020, the supply of stablecoins has increased about 60 times, from approximately $5 billion to about $300 billion, currently accounting for about 1.4% of U.S. M2.
In 2025 alone, newly minted stablecoins exceeded $120 billion, marking the largest single-year increase ever, with stablecoin trading volumes reaching $33 trillion.
Each cycle becomes bigger
Most of the above has been driven by retail capital and crypto-native use cases. The next few cycles of the flywheel may be driven by institutions, resulting in substantial increases in scale.
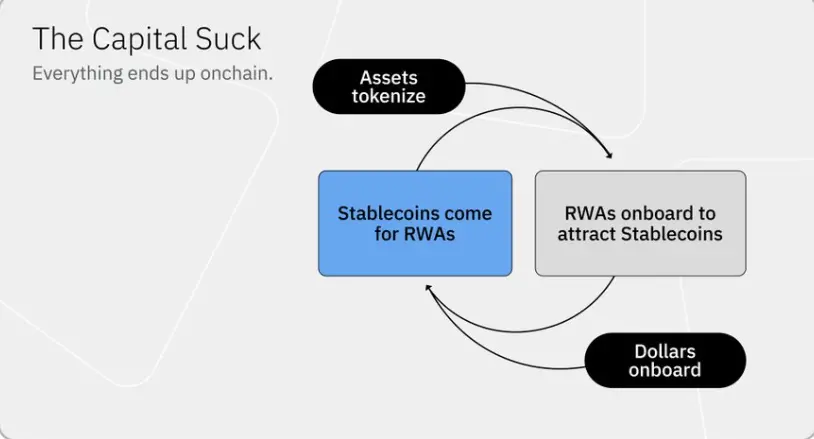
Institutional capital is beginning to shift to on-chain, which in turn incentivizes more asset issuers to tokenize their products to compete for this pool of capital.
@BlackRock's BUIDL and Apollo's on-chain credit funds are just early cases but will definitely not be the last. The scale of on-chain tokenized RWA has grown from about $8 billion two years ago to about $25 billion now. BUIDL alone holds over $2 billion in assets.
The appearance of institutional funds on-chain will attract more tokenized government bonds, private credit instruments, and structured products, as issuers always follow the money. The more products available, the more reasons institutions have to move their capital over.
Currently, RWA is the category with the smallest allocation across the entire tech stack and is one of the least lucrative business lines. However, it is one of the fastest-growing categories, bridging the on-chain economy with the trillion-dollar institutional capital market.
The infrastructure built by the retail flywheel over the past five years (DEX, lending markets, payment channels) is now also being utilized by institutions.
Derivatives are the best example. Whenever traditional markets are closed, and risk accumulates over the weekend (such as the escalation of the situation in Iran or shocks to commodities), trading volumes increasingly shift to on-chain perpetual contracts on platforms like Hyperliquid. The volumes for crude oil, silver, and gold surge during the downtime of traditional exchanges.
The Great Migration of Capital
Stablecoins are the first real-world assets to go on-chain. Dollars are migrating from bank accounts to the blockchain, and the flywheel mechanism ensures they stay and compound.
@CremeDeLaCrypto and I believe that the next step will be a large-scale migration of capital from traditional infrastructure to on-chain. We have already seen this process: issuers are tokenizing assets, institutional capital is entering, and more issuers are tokenizing products to compete for capital, thus pulling more capital onto the chain.
The flywheel that once absorbed stablecoins is now beginning to absorb stocks, credit, government bonds, and structured products. We are still in the early stages of this process. That flywheel that quietly increased the supply of stablecoins by 60 times in six years will ultimately draw all assets onto the chain.
Methodology
¹ Stablecoins 122 times = $33 trillion in adjusted trading volume for 2025 (Artemis Analytics, cited by Bloomberg and TRM Labs) / $270 billion average supply (DefiLlama, average of $230 billion in April 2025 and $310 billion in March 2026).
The trading volume covers the calendar year 2025, and the average supply covers the past 365 days up to March 2026. Even so, this may underestimate the turnover rate: in just January 2026, there was approximately $10 trillion in stablecoin transfers, indicating that the real trading volume for the past 365 days was much higher than $33 trillion.
A more conservative filtering method (Visa/Allium Labs) estimates that the adjusted transfer volume for 2025 is about $10 trillion. Even at this level, the turnover rate for stablecoins is about 40 times, comparable to PayPal, and 28 times faster than M2 (1.4 times).
² PayPal 40 times = $1.79 trillion in total payment transaction volume (TPV) for the 2025 fiscal year (SEC filing) / approximately $45 billion in customer balance (10-K form). This comparison is merely directional: stablecoin trading volume includes all on-chain transfers; PayPal's TPV includes transactions funded by credit cards.
³ $19 million generated for every $1 billion = $5.1 billion in stablecoin-related protocol income (Token Terminal, past 365 days up to March 2026) / $270 billion average supply (DefiLlama).
We use protocol income instead of total fees (about $14 billion) because most fees flow to liquidity providers, depositors, and stakers, rather than the protocol treasury.
Income is attributed only to stablecoin-related activities: DEX transactions of stablecoin trading pairs (approximately 50% of DEX income), derivatives with stablecoins as collateral (approximately 87%), stablecoin lending (approximately 90%), and network fees generated from stablecoin transfers (around 90% for Tron; other chains 15-25%). Excludes ETH/BTC exchanges, meme coin trading, and NFT minting.
⁴ $5.1 billion attributable income (note ³) / $270 billion average supply = $19 million generated for every $1 billion. Excludes issuer floating capital (approximately $35-42 million for every $1 billion) and off-chain income (wallets, fiat exchange channels, custody).
⁵ Estimates based on Artemis stablecoin activity data, Artemis/Castle Island report "Stablecoin Payments Built from the Ground Up" (October 2025), Token Terminal and DefiLlama data, converted to $33 trillion in annual trading volume.
"Payments and transfers" = all non-DeFi fund flows (P2P, B2B, CEX fund flows, wallet transfers, not just merchant payments). The lending category uses fund disbursement volume (flows) rather than outstanding balances (TVL/inventory) to maintain consistency with other categories.
免责声明:本文章仅代表作者个人观点,不代表本平台的立场和观点。本文章仅供信息分享,不构成对任何人的任何投资建议。用户与作者之间的任何争议,与本平台无关。如网页中刊载的文章或图片涉及侵权,请提供相关的权利证明和身份证明发送邮件到support@aicoin.com,本平台相关工作人员将会进行核查。


