Tracking real-time hotspots in the currency circle, seizing the best trading opportunities. Today is Wednesday, March 27, 2024, and I am Yibo! We do not predict trades, but actually observe market fluctuations (narrowing, spreading), structure (market batch structure), and sentiment (external market such as US stocks, USD, etc.). As a trader, you (through trading) affect prices, and prices also affect your emotions and behavior as a factor.

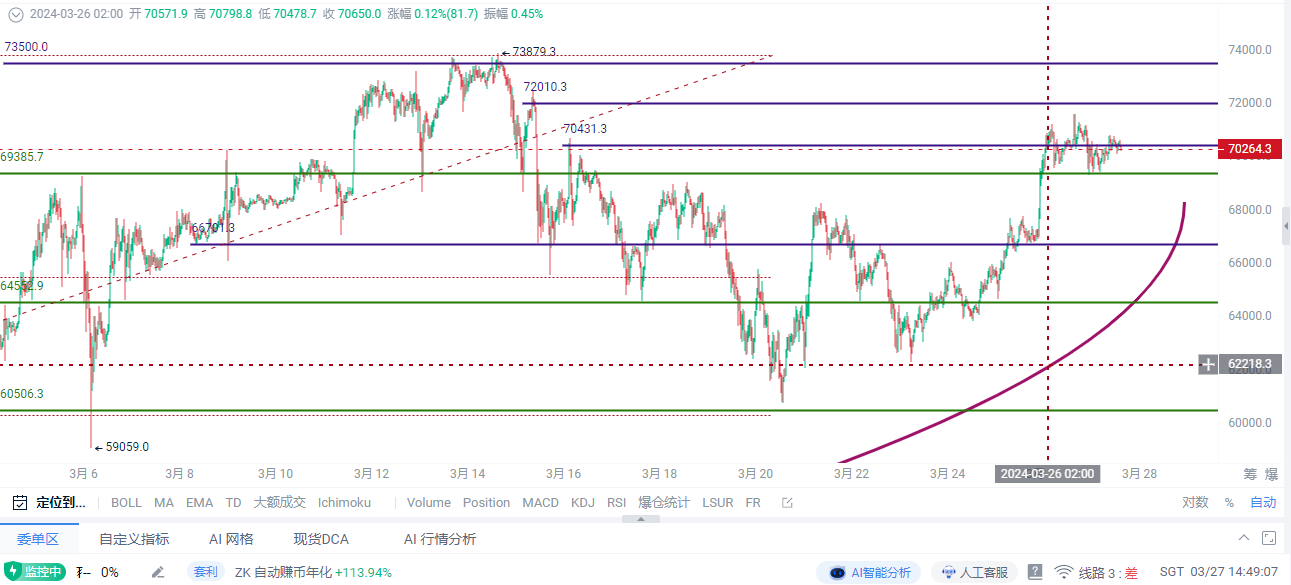
BTC has once again surpassed the 70,000 mark after nine days. Every pullback in the bull market is an opportunity for longs to buy in. The price of BTC has been oscillating narrowly since yesterday, and the operating range is relatively low. Yesterday, it rose to around 71,600 and then retraced, and in the late session, it briefly fell below 70,000, but this was just a feint. The overall structure remains stable. Currently, looking at the hourly chart, the BOLL channel has narrowed after a prolonged consolidation, with multiple attempts near the lower rail being repeatedly retracted. The spatial pattern tends to be like boiling a frog in warm water. In terms of the chart, after the MACD death cross, it has started to stick together, and the KDJ and RSI values have successively provided stability and rebound. Looking at the fifteen-minute chart, there will be a small-scale pullback, with an expected rebound to 70,000. Currently, the market structure belongs to a strong slow rise, and the technical aspect will maintain a pressure to rise and continuously set new highs. The short-term adjustment has a deceptive structure, seemingly a false adjustment, but with limited space. After a strong consolidation at a high level, it will directly rise. On the four-hour level, it is supported by a strong 4-consecutive positive trend, and due to the limited retracement, the short-term is still in an extended volume. A strong positive trend, combined with horizontal consolidation, will continue to rise. Since the trend has been established, the future layout will definitely revolve around long positions!

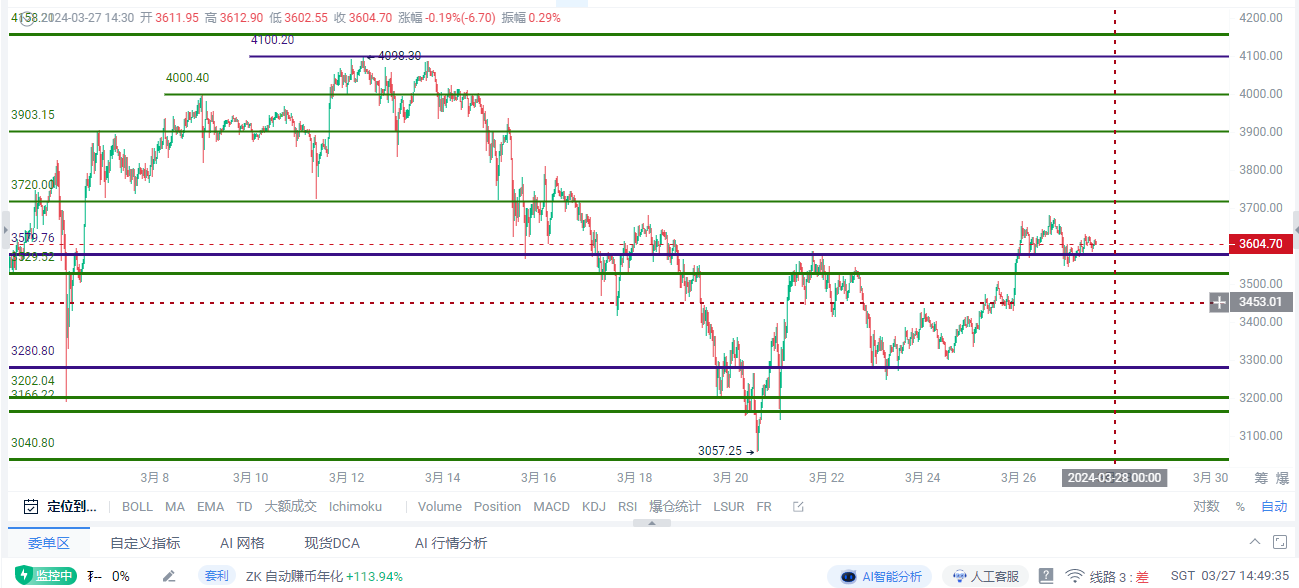
The overall trend of Ethereum is consistent with the broader market. After touching the support level below 3,545, a rebound was formed. The current price is oscillating near 3,600, and the bottom MA20 has formed support. The bearish energy of the MACD continues to decrease, and the DIF has formed a turning trend, continuing to approach the DEA, which will also form a golden cross. On the daily chart, it is recommended to focus on the 3,480 support level. On the four-hour chart, the price is maintained within the BOLL upward channel, with the 3,510 support level as a round number. At the same time, after the indicator's bullish volume contracted, it also formed a certain divergence from the price, so be cautious about finding support for the price to continue to rise. In the short term, on the hourly chart, the overall price has broken through the previous BOLL downtrend channel and is currently in a BOLL oscillating market. If the price can stand firm at the 3,610 level, there is still some upward space for the price. The MACD indicator on the chart shows that the bearish volume is gradually decreasing and has not completed the conversion of the long and short energy, so the trend on the hourly chart is not obvious. In summary, it is recommended to focus on long positions for Ethereum's pullback. Pay attention to the 3,680-3,7205 range above, and after breaking through, you can look up to 3,780 and 3,820. Below, continue to focus on the two key support levels of 3,545 and 3,510, and go long if they are not broken.

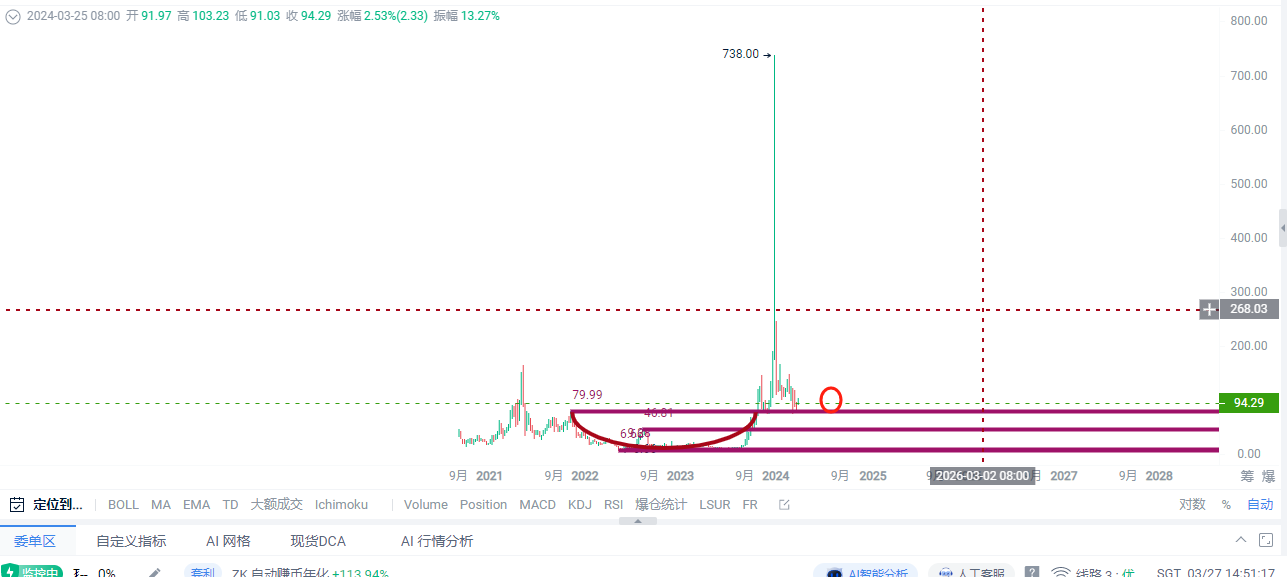
In the recent period, those who seized the opportunity with the hot coins like TRB may have achieved financial freedom, but many others are trapped at the highest point, feeling regretful and suffering losses. At this moment, many people may have already forgotten about TRB, but Yibo has always been paying attention to any movements of the whales and institutions, grasping the trend, narrative, and data changes of each coin. Will TRB, which has been in a long-term retracement, have another major rally? We will wait and see. The current price is oscillating around 92 and can choose to enter the spot market in the 85-70 range on a pullback!

In this market, it ultimately comes down to ability. If your ability is insufficient, what the market gives you will eventually be taken back. Therefore, when your wealth exceeds your ability, you need to control the pullback, although this control is futile because that kind of profitable arrogance and arrogance will ultimately destroy a person's rationality. However, in the capital market, we don't have to worry about the situation where our wealth is lower than our ability, because this kind of imbalance will ultimately be corrected by time. If it is not corrected, there is only one reason, which is that your ability is insufficient. If you are still in a state of confusion, not understanding the technology, not knowing how to read the market, not knowing when to enter, not knowing when to stop loss, not knowing when to take profit, randomly adding positions, getting trapped at the bottom, unable to hold onto profits, and missing out when the market comes. These are common problems among retail investors, but it's okay. Come to me, and I will guide you with the correct mindset for trading. A thousand words are not as good as one profitable trade. Instead of frequent operations, it's better to be precise, making every trade valuable. What you need to do is find Yibo, and what we need to do is prove that our words are not empty. 24-hour real-time guidance, the market fluctuates quickly. Due to the impact of review timeliness, for the subsequent market trends, real-time layout based on actual trading is the main focus. Coin friends who need contract guidance can scan the QR code at the bottom of the article to add my public account.

免责声明:本文章仅代表作者个人观点,不代表本平台的立场和观点。本文章仅供信息分享,不构成对任何人的任何投资建议。用户与作者之间的任何争议,与本平台无关。如网页中刊载的文章或图片涉及侵权,请提供相关的权利证明和身份证明发送邮件到support@aicoin.com,本平台相关工作人员将会进行核查。


