As Christmas approaches, the cryptocurrency market is witnessing a dramatic scene. This is both a challenging moment and potentially the best opportunity for investors to position themselves. Let's delve into this phenomenon and explore the underlying logic and future potential trends.
According to AICoin data, the specific trend of Bitcoin on December 25 is analyzed as follows, in conjunction with pattern theory:
Current Performance of Candlestick Patterns
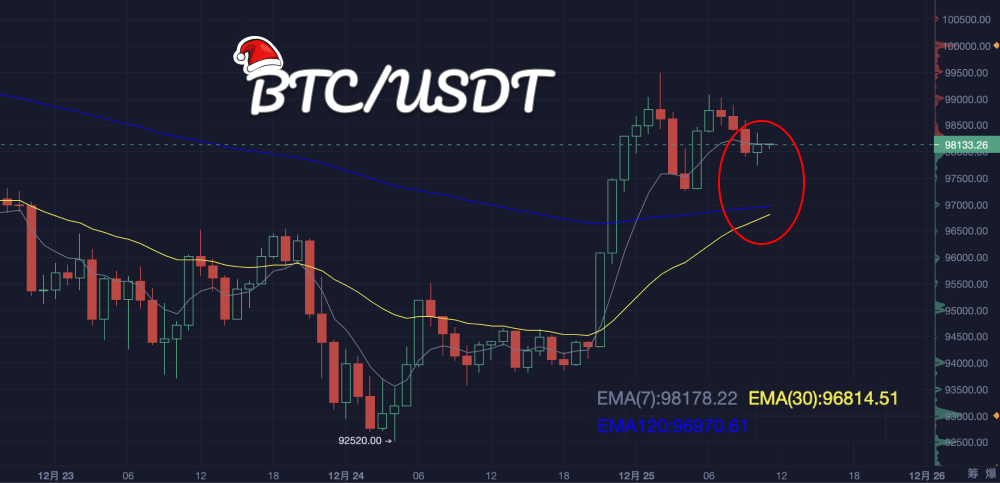
Review of Previous Trends: From the chart, it can be seen that the price completed a significant rebound on the evening of December 24, but faced resistance near the 99,000-100,000 area, leading to a slight pullback. Currently, after the retracement, it is oscillating in the 98,000-97,000 range, showing a slight converging trend.
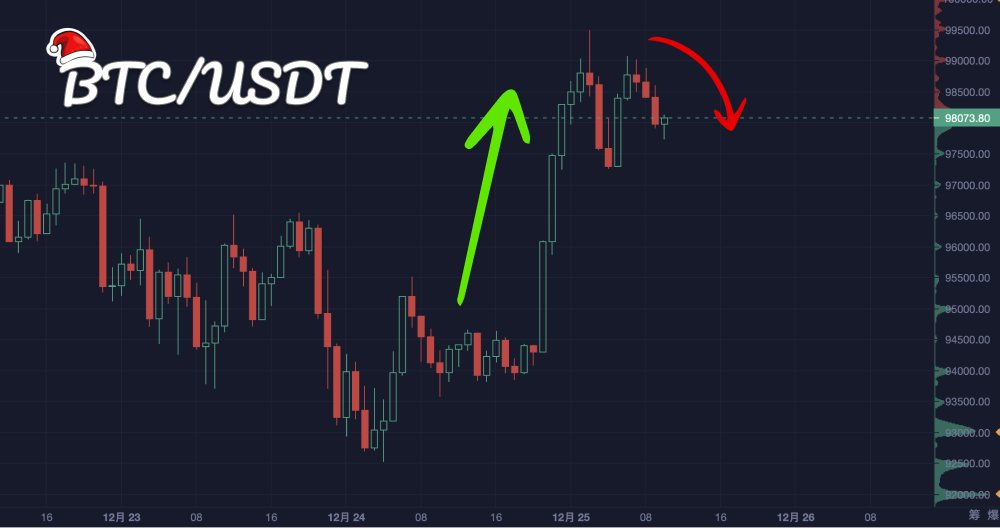
Short-term Pattern Potential: Inverted Head and Shoulders Formation: If the area around 98,000 becomes support, the current price trend may form the right shoulder, with the neckline positioned in the 99,000-100,000 area. Once a breakout occurs with increased volume, the inverted head and shoulders pattern will be confirmed, with subsequent target levels potentially reaching 105,000.
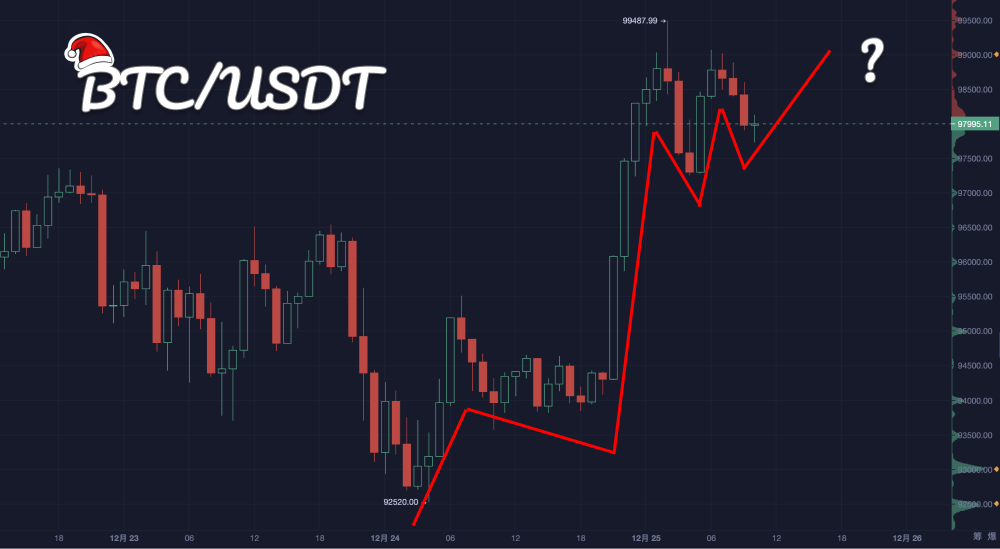
Pattern Signals Supported by Indicators and Structure
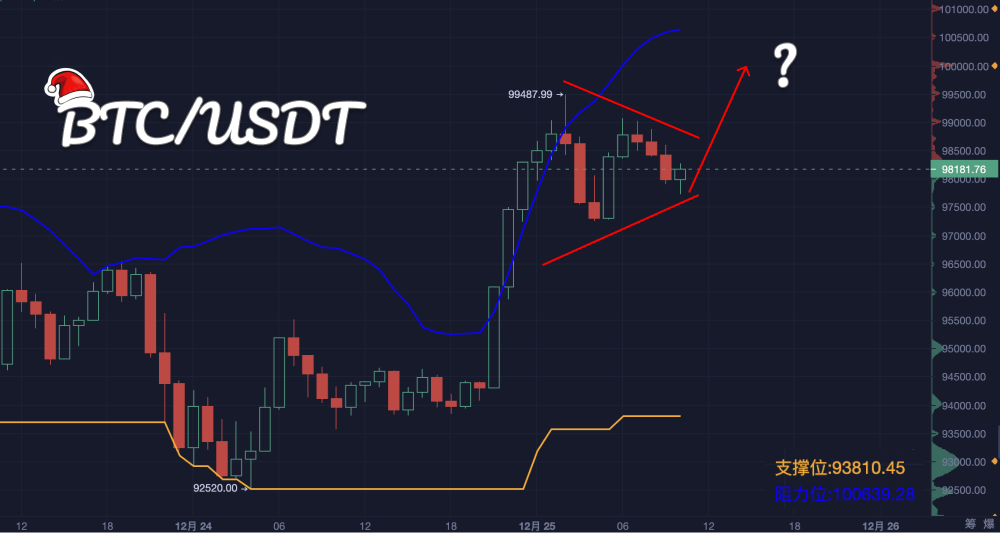
Ascending Triangle
- Characteristics: The price has attempted multiple times to break through the 99,000-100,000 resistance area, with highs gradually approaching while lows continue to rise, forming a potential ascending triangle.
- Trend Expectation: If the 100,000 resistance line is broken with increased volume, it will confirm the triangle pattern, with target price levels potentially reaching 105,000-108,000. However, if it subsequently falls below the 97,000 support, the triangle will fail, possibly leading to a corrective trend.
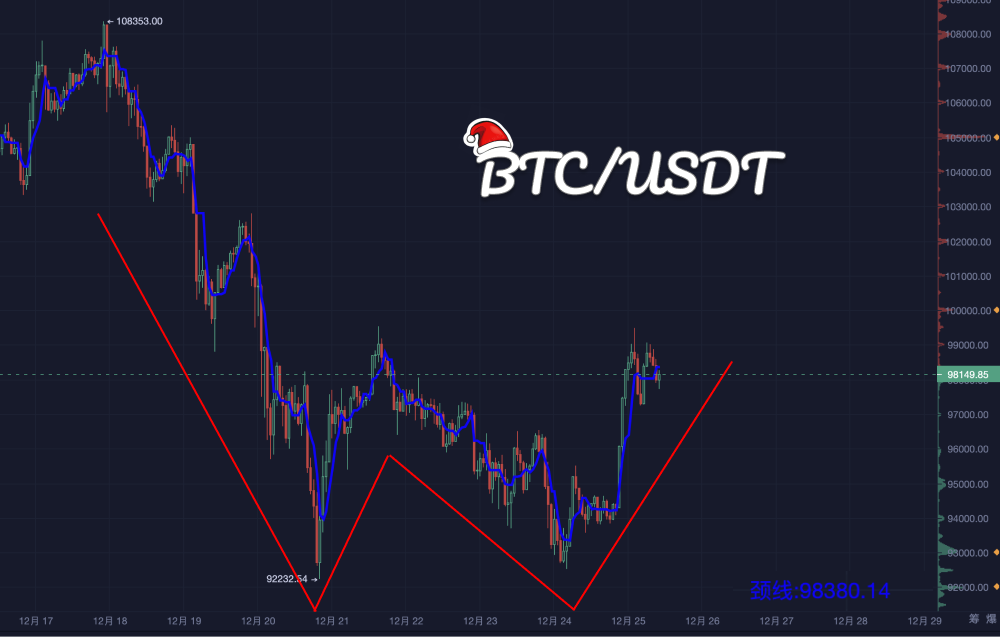
Possibility of Double Bottom Formation
- Pattern Analysis: The bottoms appeared on December 20 (92,232) and December 24 (92,500). The current price is below the neckline (98,380), and once it effectively breaks through, it will confirm the double bottom pattern.
- Target Price: Based on calculations, the target price is estimated at 105,000, derived from the distance from the neckline to the bottom added above the neckline.
Technical Indicator Analysis
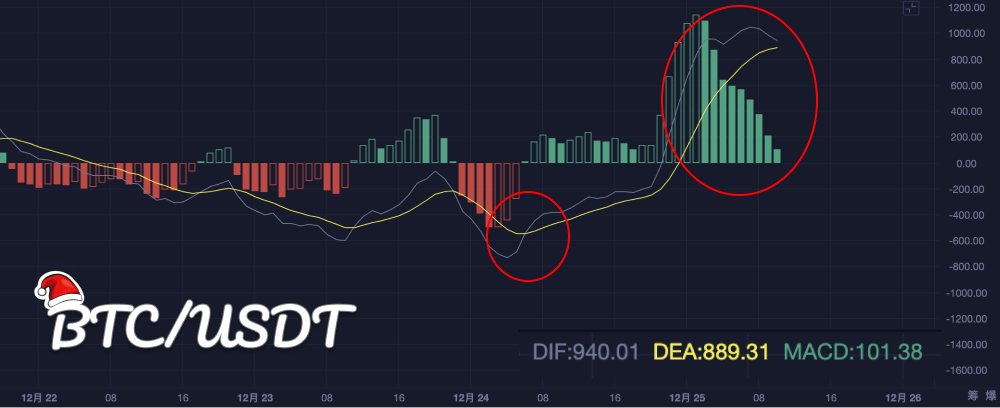
MACD: The MACD histogram continues to expand above the zero axis, with the DIF line crossing above the DEA line and maintaining an upward divergence, indicating that the current market is in a bullish trend.
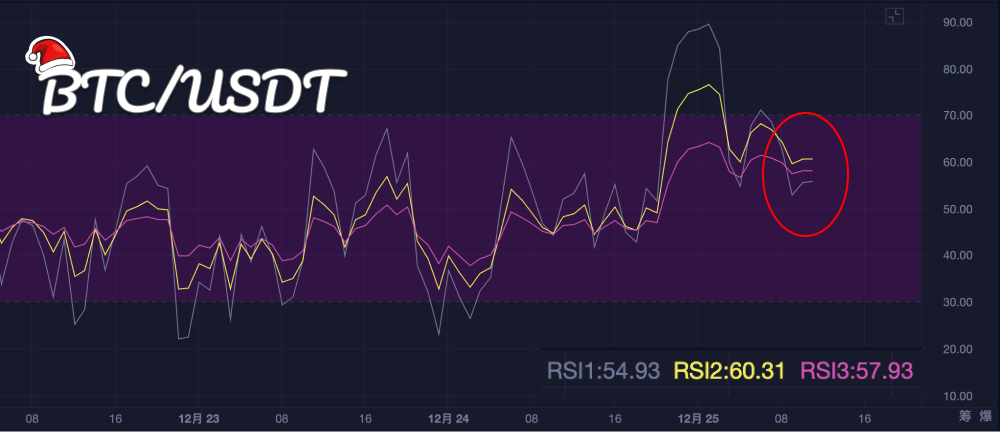
RSI: The RSI value hovers above 60, not yet entering the overbought zone but approaching 70, indicating some upward momentum, though caution is warranted regarding potential pullback risks.
EMA: The EMA7, EMA30, and EMA120 moving averages are in a bullish arrangement, with the price consistently operating above the EMA7, while the EMA120 provides long-term support, indicating an overall bullish trend.
Predictions for December 25 and Operational Strategies
Upward Breakout Strategy:
- If the 98,500-99,000 area is effectively broken with increased trading volume, it can confirm a bullish pattern (ascending triangle or inverted head and shoulders).
- Target Levels: 105,000-108,000; Stop Loss: below 97,000.
Downward Risk Response:
- If the price falls below the 97,000 support, be cautious of a potential drop to 94,000 or even 92,500.
- Short Target: 94,000-92,500; Stop Loss: above 98,000.
Short-term Oscillation Strategy:
- Engage in high selling and low buying within the 97,000-99,000 range, waiting for directional confirmation.
- Trade in the direction of the breakout or breakdown after key levels are breached.
Risk Warning: It is essential to consider volume, market sentiment, and macro news to avoid false breakouts or breakdowns during pattern formation, and to adjust operational strategies flexibly! The above content is for reference only and does not constitute investment advice.
This traditional "joyful season" of Christmas appears somewhat unusual in the crypto market: increased volatility, tense emotions, and a mix of opportunities and risks. For ordinary investors, maintaining calm is crucial. In the storm, only those who can analyze rationally and respond flexibly will have the chance to seize the true opportunities in the market. Will the market continue to oscillate, or will it rebound? Perhaps the answer is already written in the data and indicators. Whether you become a winner or a bystander depends entirely on your choices.
If you have any questions, you can contact us through the following official channels:
AICoin Official Website: www.aicoin.com
Telegram: t.me/aicoincn
Twitter: x.com/AICoincom
Email: support@aicoin.com
Group Chat: Customer Service Yingying, Customer Service KK
免责声明:本文章仅代表作者个人观点,不代表本平台的立场和观点。本文章仅供信息分享,不构成对任何人的任何投资建议。用户与作者之间的任何争议,与本平台无关。如网页中刊载的文章或图片涉及侵权,请提供相关的权利证明和身份证明发送邮件到support@aicoin.com,本平台相关工作人员将会进行核查。


