CEX's published liquidation data is often significantly lower than the actual liquidation activities that occur.
Author: Three Sigma
Translated by: Deep Tide TechFlow

Traders are liquidated, and billions of dollars vanish into thin air. But what if the actual scale of liquidation is 19 times higher than reported? We dug deep into the data and found that the situation is more severe than you might think.
1. Liquidation
Today, the barriers to trading are lower than ever, allowing ordinary people to easily participate. Whether through flashy courses offered by so-called "mentors" or as an alternative to traditional jobs, trading seems to offer an ideal lifestyle: just a computer, and you can work comfortably from home while potentially earning a substantial income.
But the reality is far from simple. If trading were truly that easy to succeed at, everyone would be a winner. However, the truth is that most people who attempt to trade ultimately incur losses, even facing liquidation. So, what exactly causes these losses? The answer often points to a word that every trader fears: liquidation.
Liquidation is a core mechanism in leveraged trading. When a trader's collateral or margin is insufficient to cover the losses of open positions, the exchange automatically intervenes to force liquidation, preventing further losses for the trader or the platform.
Depending on the severity of the margin shortfall and the platform's risk management mechanisms, liquidation typically falls into two categories:
Partial Liquidation: Only a portion of the trader's position is reduced, while the remaining part stays in the market. This method can lower risk while allowing the trader to continue participating in the market.
Full Liquidation: All positions are closed, completely eliminating the trader's risk exposure. This situation is more common in high-leverage trading, as even minor price fluctuations can lead to the total depletion of the trader's collateral.
Main Causes of Liquidation
Liquidation usually arises from an imbalance between risk and margin. Here are several key factors that lead to liquidation:
Leverage: Leverage allows traders to control larger positions with less capital, but it also amplifies risk. The higher the leverage, the smaller the price movement needed to trigger liquidation. For example, with 50x leverage, a mere 2% price movement can result in the trader losing all collateral. Therefore, risk management is crucial in leveraged trading.
Maintenance Margin: Every exchange sets a minimum margin requirement that traders must maintain to keep their positions from being liquidated. The maintenance margin acts as a layer of "safety buffer." When losses cause the margin to fall below this threshold, the exchange will force liquidation to prevent larger losses. If traders ignore or fail to monitor these requirements in a timely manner, they may quickly find themselves in a forced liquidation predicament.
Market Volatility: Severe price fluctuations are the biggest enemy of high-leverage traders. Volatility can quickly deplete margin, leaving traders with little time to react. Additionally, during periods of high volatility, the market often experiences a phenomenon known as "cascade liquidation": one liquidation can trigger a chain reaction, further pushing prices in an unfavorable direction and exacerbating losses.

Market Squeeze
One of the most dramatic and rapid triggers of liquidation is "squeezes." This phenomenon occurs when sharp price movements force traders who are on the wrong side of the market to close their positions. Squeezes are typically driven by high leverage and low liquidity, creating a "snowball effect" that accelerates price changes and increases market volatility.
When prices rise rapidly, short sellers face immense pressure as their collateral is insufficient to support their positions. To avoid greater losses, they are forced to buy back assets to close their positions, which further drives prices up. This cycle often evolves into a cascade of liquidations: one trader's forced closure pushes prices higher, triggering further liquidations of other traders.
Conversely, when prices suddenly plummet, long traders face similar risks. As the value of their collateral shrinks, they are forced to sell positions to meet margin requirements, and this selling pressure exacerbates the downward price trend. The increased selling pressure further drives prices down, triggering more liquidations and ultimately creating a "downward spiral."
Notably, the "short squeeze" of GameStop in early 2021 is a classic case. A coordinated buying effort initiated by retail traders from the Reddit community WallStreetBets unexpectedly drove the stock price up significantly. As prices soared, short sellers were forced to buy back shares at higher prices to close their positions, further pushing the stock price up.
This feedback loop ultimately evolved into a historic event: GameStop's stock price skyrocketed from about $20 in early January 2021 to an intraday high of $483 by the end of the month. This squeeze resulted in billions of dollars in losses for institutional investors.

2. API and Liquidation
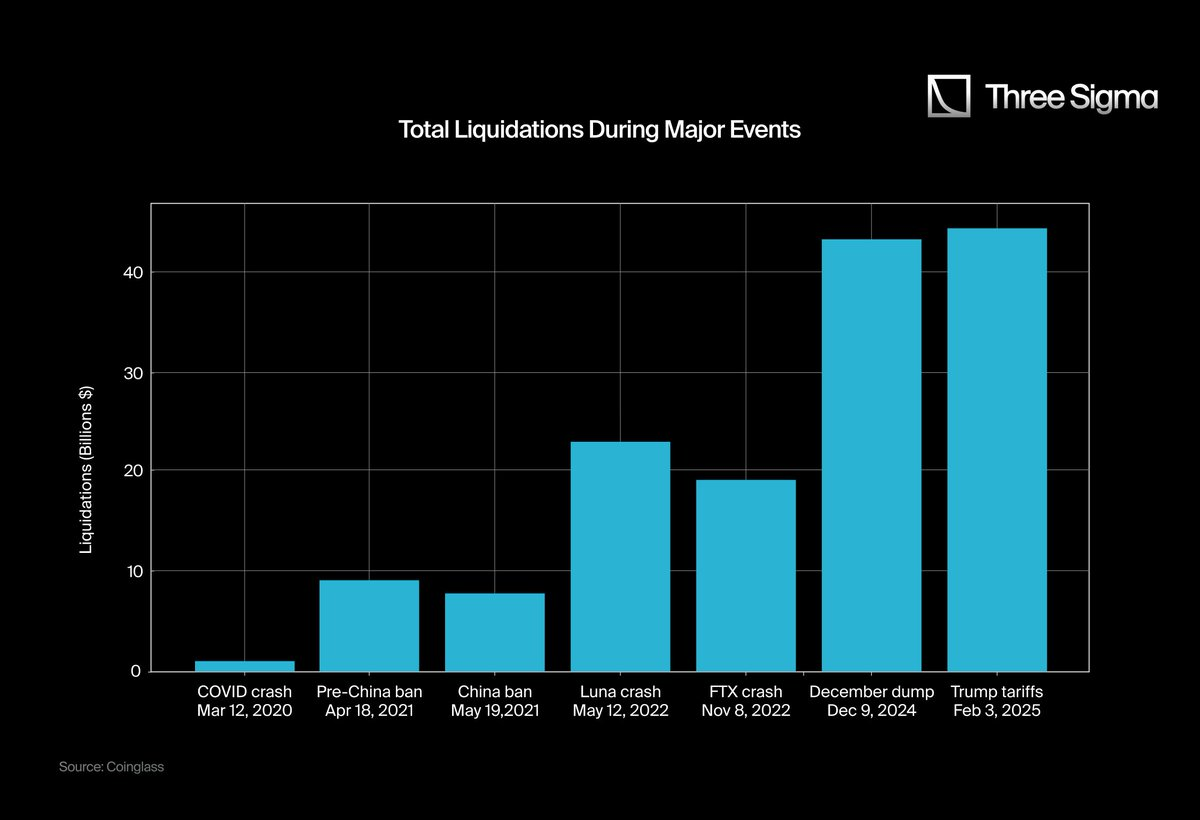
Throughout the history of the cryptocurrency market, there have been several notable liquidation events. However, the most impressive are often "long squeezes"—liquidations triggered during price declines. These events are typically larger in scale and have more profound impacts on traders and the market.
Here are some of the largest liquidation events in cryptocurrency history:
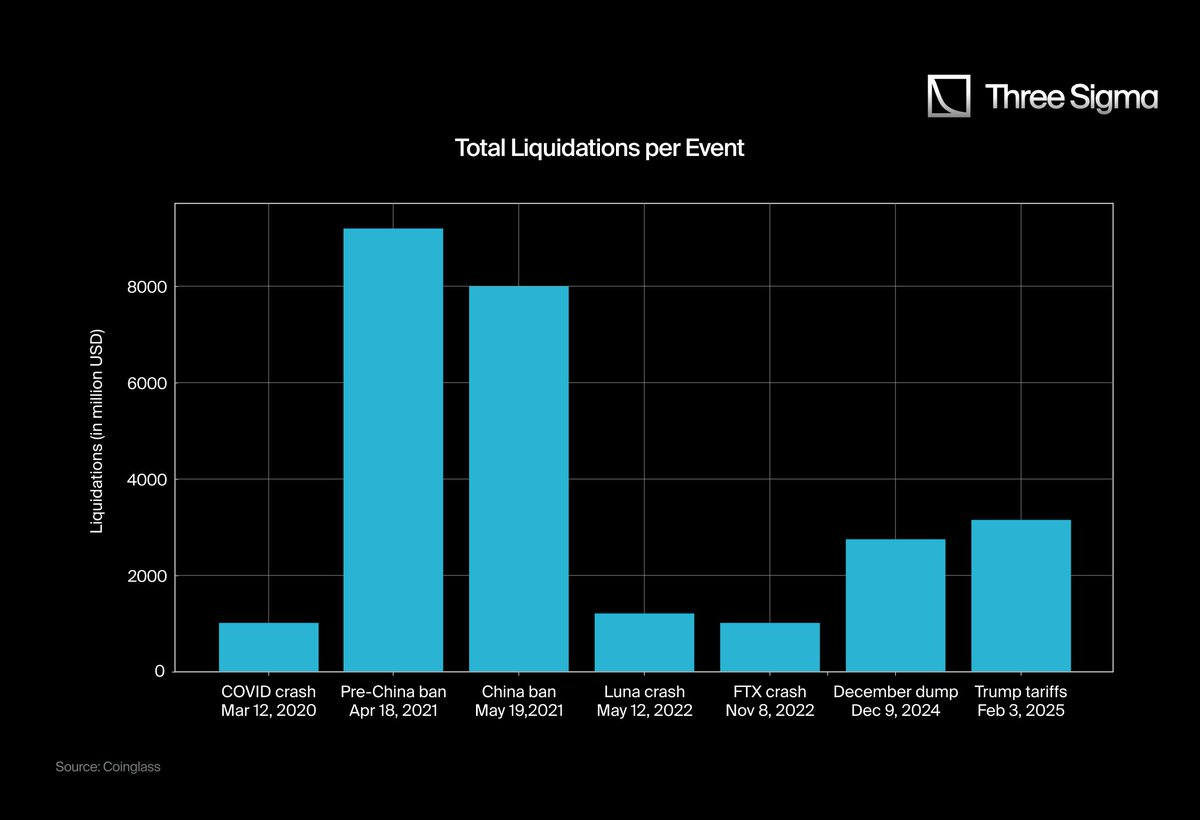
Did you notice any anomalies? Do you feel that the impact of the FTX collapse or the Luna collapse far exceeds the liquidation events that occurred this year? Your intuition is correct.
The perception that recent liquidation events are more severe than the FTX or Luna collapses is due to three core reasons:
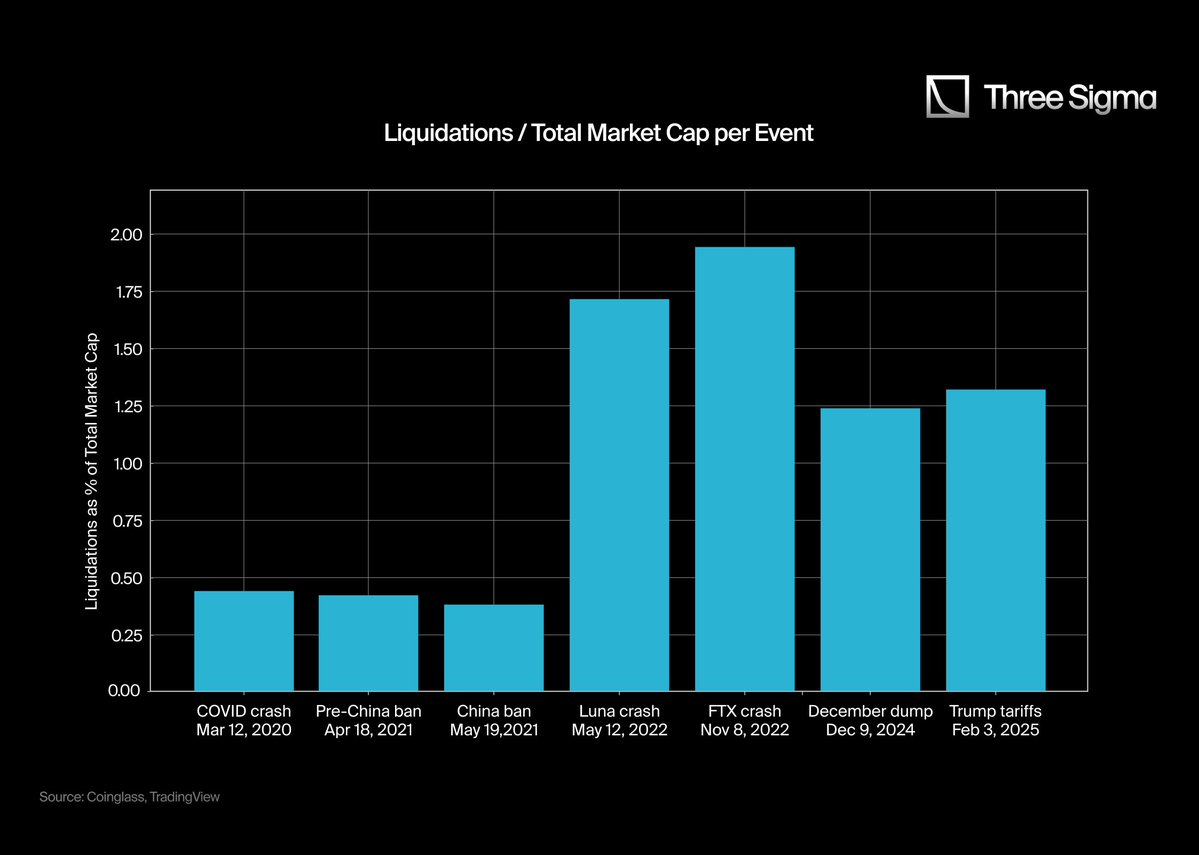
2.1 Growth in Total Market Capitalization and Scale of Liquidation
In March 2020, the total market capitalization of the cryptocurrency market peaked at $266 billion, and by 2025, this figure soared to a historical high of $3.71 trillion. To more accurately assess the scale of liquidation, we need to focus on the "liquidation-to-market cap ratio" rather than just the absolute liquidation amount. Relying solely on raw data may make recent liquidation events appear larger than their actual scale.
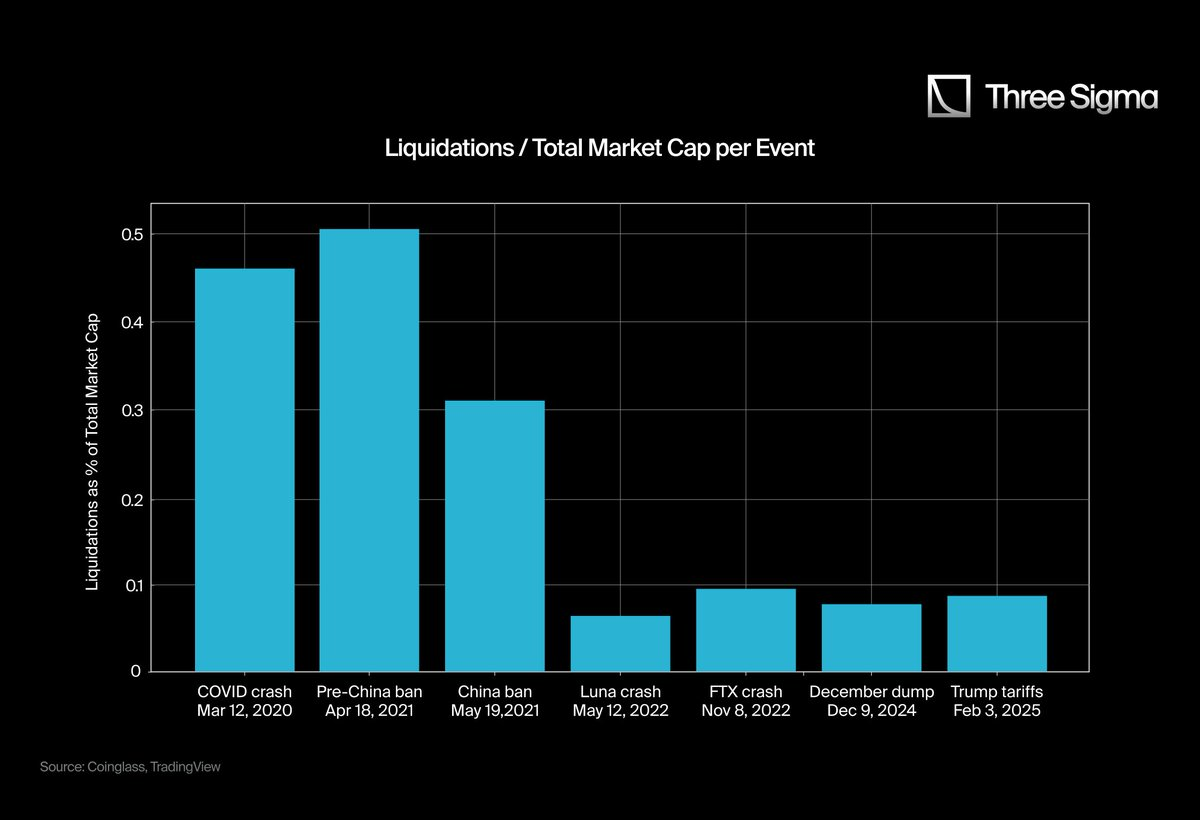
While the charts can help us better understand the scale and impact of liquidation from a holistic perspective, there are still some data biases, leading to the next key issue.
2.2 Data Limitations of CEX WebSocket API
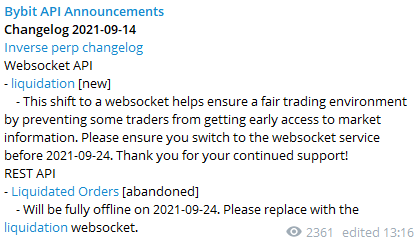
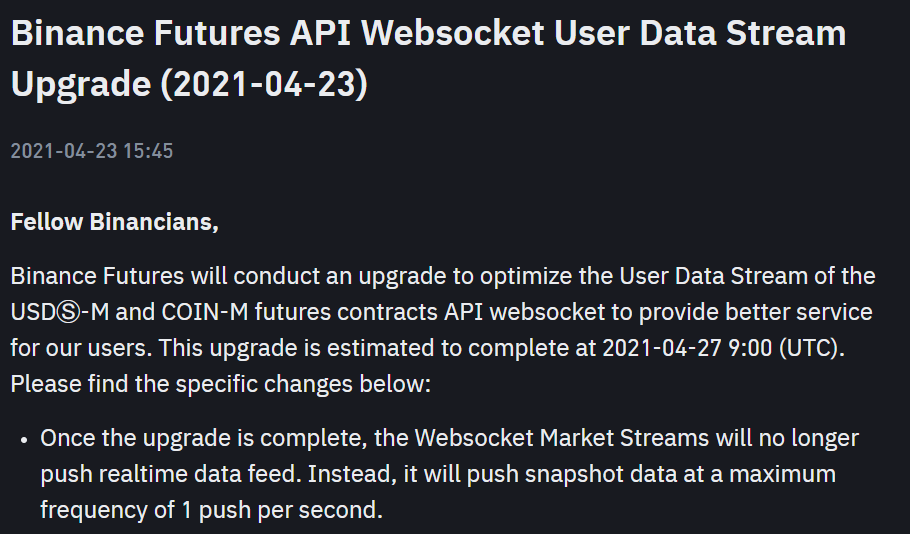
Before the second quarter of 2021, most centralized exchanges provided detailed liquidation data through their APIs, capable of recording and reporting every liquidation. However, starting in 2021, many exchanges began to limit liquidation data, reporting a maximum of one liquidation record per second, regardless of how many liquidations actually occurred.
This data cap significantly reduced the transparency of liquidation data, making the liquidation data after 2021 appear less comprehensive than before, thus underestimating its impact.
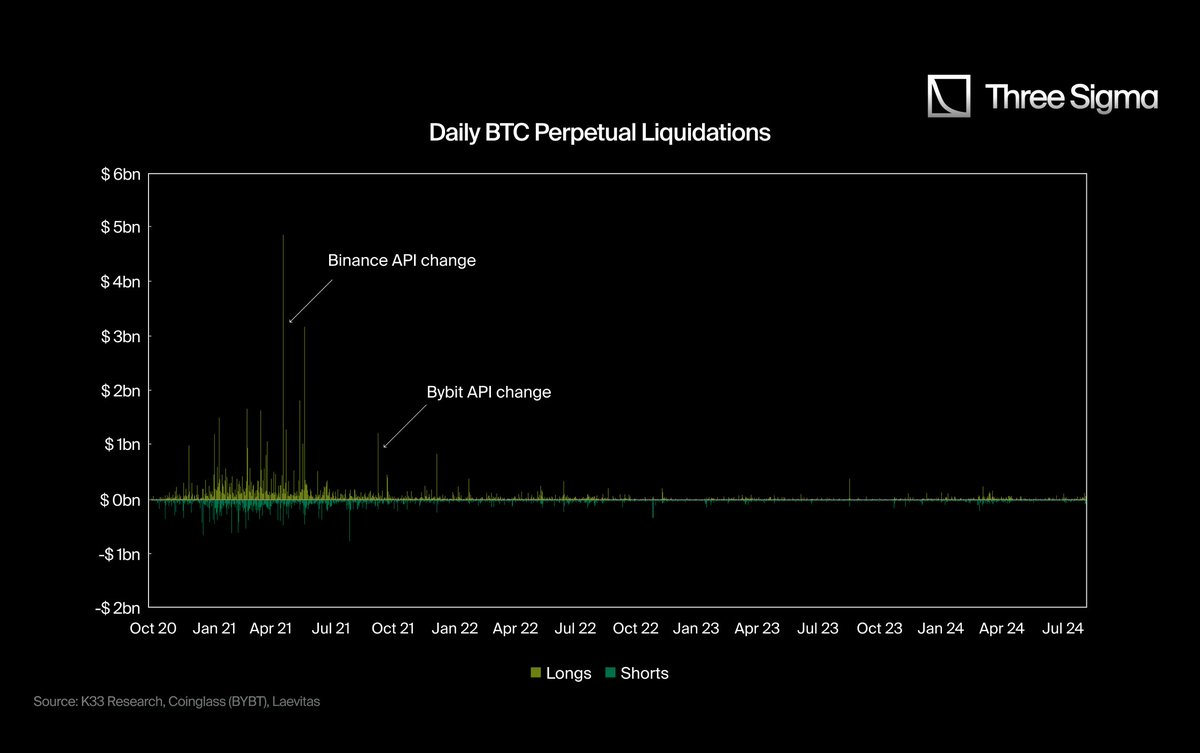
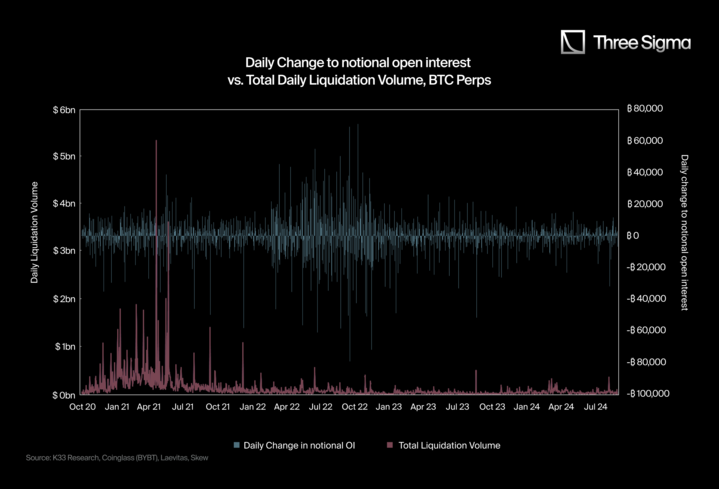
@K33Research clearly revealed this issue through two charts in their research:
- The first chart shows that since the API change, the number of liquidations has significantly decreased, even though the total market capitalization has grown significantly after 2021, the number of liquidation events has remained at a low level.
- The second chart compares the total liquidation volume with the daily changes in notional open interest (notional OI). Typically, significant fluctuations in notional open interest would trigger large-scale liquidations, but since the second quarter of 2021, even on days with severe fluctuations in notional open interest, there has been no noticeable spike in liquidations.
The official reason given for the API changes is "to provide a fair trading environment (Bybit, September 2021)" and "to optimize user data flow" (Binance, April 2021). However, some argue that this may be a public relations strategy to avoid triggering excessive fear, uncertainty, and doubt (FUD) and to keep real data within the exchanges.
Hyperliquid: A Trusted Transparent Trading Platform
Hyperliquid is the first decentralized exchange (DEX) for perpetual contracts built on a Layer 1 blockchain, with trading volumes now comparable to those of centralized exchanges (CEXs). Unlike traditional CEXs, Hyperliquid provides completely transparent and unrestricted liquidation data reports, with all data open to the public for anyone to query at any time.
This transparency brings a unique change to the market: on one hand, due to the reporting limitations of CEXs, their liquidation data is often artificially capped; on the other hand, Hyperliquid's liquidation data is fully public and unrestricted. This difference has led to a significant increase in the overall reported liquidation data driven by Hyperliquid.
This level of transparency has profound implications for the entire trading ecosystem. In traditional centralized exchanges, liquidation data is often selectively disclosed or aggregated, making it difficult for traders to analyze market dynamics in real-time. Hyperliquid's on-chain liquidation data ensures that every liquidation event is visible to the public, providing traders with more accurate and comprehensive information on leveraged trading.
For traders, this transparency means they can better understand market conditions, such as identifying potential "squeeze" opportunities, monitoring risk levels, or assessing market sentiment. Researchers and analysts also benefit from the unfiltered on-chain data, which provides deep insights into market volatility, risk behavior, and the market's response to liquidations.
This unrestricted data access not only fosters a fairer and more efficient trading environment but also ensures that all market participants have equal access to information.
By establishing a new standard of transparency for perpetual contract trading, Hyperliquid not only challenges the data opacity of CEXs but also significantly enhances the reliability of liquidation data, enabling traders to gain deeper market insights based on a higher level of trust.
3. Real Liquidation Data and Hyperliquid Ratios
3.1. Calculation of Hyperliquid Ratios
Hyperliquid's transparency and rich indicator system allow us to clearly observe the real dynamics of the market. However, the derivatives trading segment of CEXs has failed to provide data that aligns with actual conditions due to API limitations. Although CEXs have much higher open interest and trading volumes than decentralized exchanges, their reported liquidation data is abnormally low. This data discrepancy is particularly evident in the charts, further validating the limitations of CEX data reporting.
Thanks to Hyperliquid's transparency, we now have a verifiable and accurate dataset to compare the discrepancies in liquidation reports from centralized exchanges (CEXs).
The liquidation data cited by traditional media is often based on restricted APIs that cannot capture the full scope of liquidation activities, resulting in incomplete figures. In contrast, Hyperliquid's unrestricted on-chain data reports provide transparent and detailed records of all liquidation activities, demonstrating that CEX liquidation activities may far exceed their publicly disclosed levels.
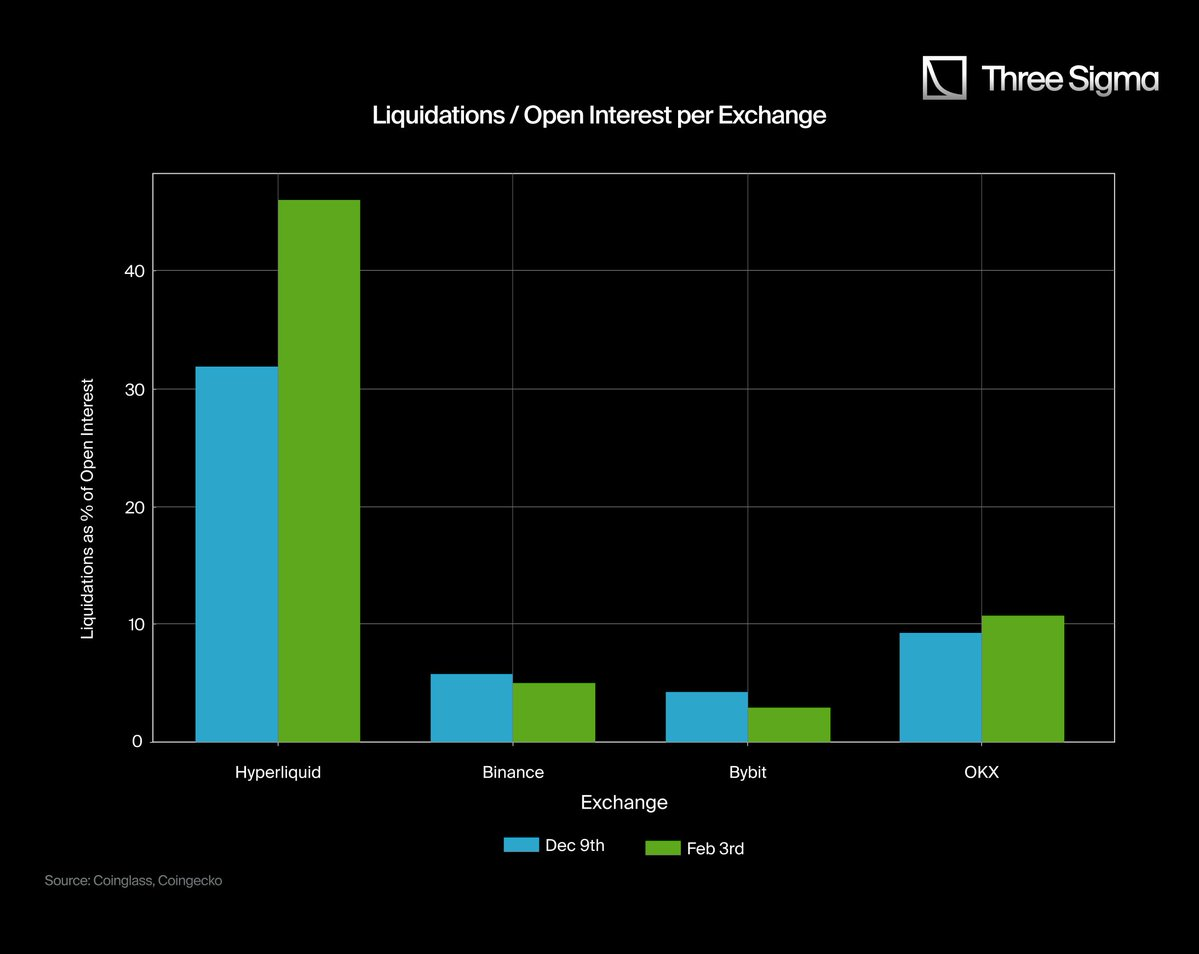
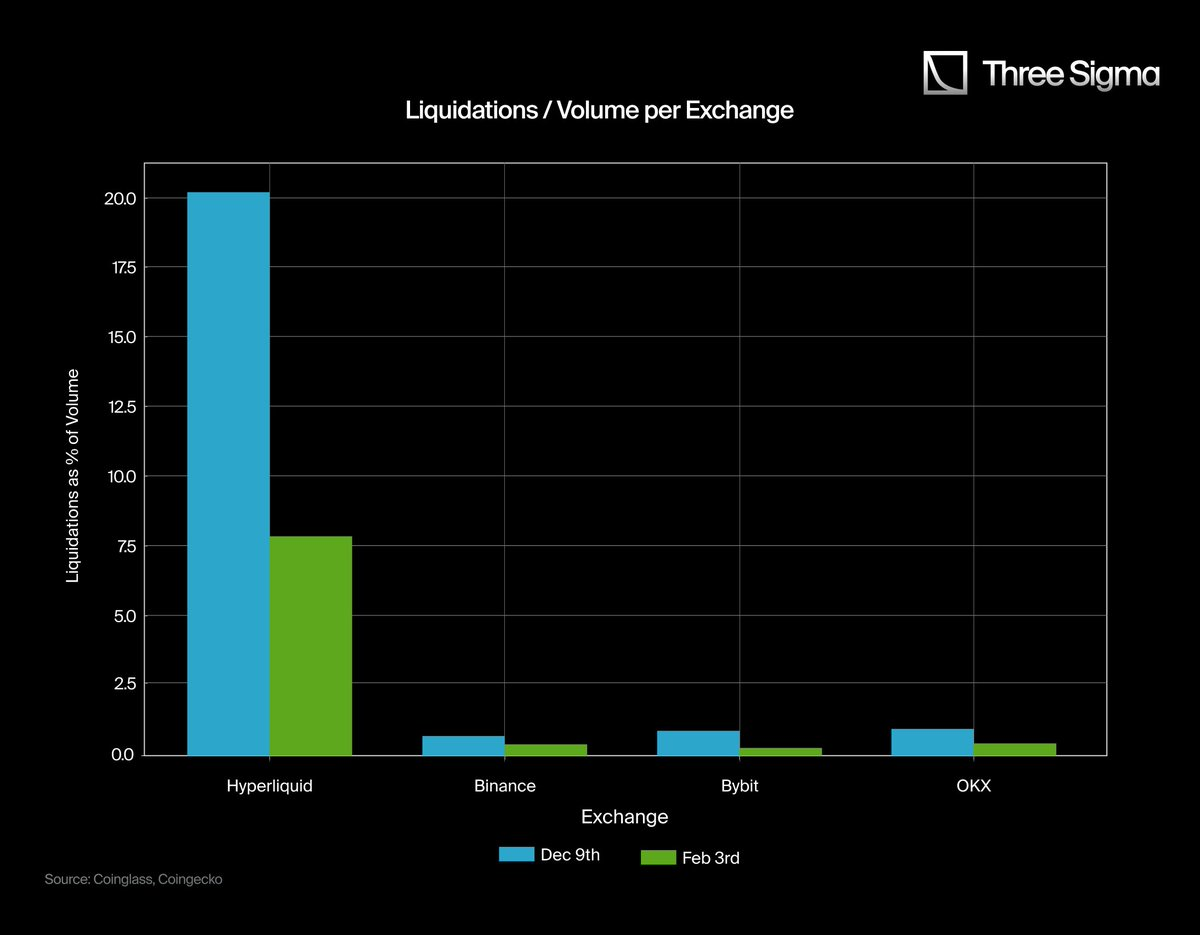
From the two charts, it is visually apparent that there is a significant difference between Hyperliquid and CEX liquidation data, revealing a core issue in current liquidation reporting. On CEXs like Binance, Bybit, and OKX, the scale of open interest and trading volume is far greater than that of Hyperliquid, yet their liquidation ratios are disproportionately low. This clear contradiction suggests that CEX liquidation data may be underreported or obscured, as these figures do not align with the scale of active leveraged trading on their platforms.
In the left chart, the ratio of Hyperliquid's liquidations to open interest is significantly higher than that of CEXs, while the latter's ratio is abnormally low, even with their large derivatives markets. Similarly, in the right chart, the ratio of CEX liquidations to trading volume is almost negligible, which clearly does not correspond to their high-leverage trading activities.
These charts clearly indicate that Hyperliquid provides a more authentic and transparent perspective on liquidations. Unlike CEXs, which restrict public access to complete liquidation data, Hyperliquid's on-chain data reports ensure that every liquidation is fully recorded and publicly accessible, accurately reflecting the liquidation activities in the market.
It is worth noting that the "low values" of liquidation ratios in the Binance, Bybit, and OKX charts do not imply fewer liquidation activities; rather, they reflect the low transparency of CEX liquidation data reporting and potential statistical flaws.
3.2. Adjusting CEX Liquidation Data Based on Hyperliquid Ratios
To estimate the "real" liquidation data for CEXs, we use Hyperliquid's liquidation-to-volume ratio and liquidation-to-open interest ratio as benchmarks. We then compare these ratios with the liquidation data reported by CEXs on two specific dates (December 9 and February 3) to calculate an adjustment factor.
Hyperliquid Ratio Calculation and CEX Liquidation Data Adjustment
Liquidations / Open Interest Ratio
December 9: 1.07B / 3.37B ≈ 0.3175
February 3: 1.42B / 3.08B ≈ 0.461
Average ≈ 0.389 (38.9%)
Liquidations / Volume Ratio
December 9: 1.07B / 5.30B ≈ 0.2021
February 3: 1.42B / 18.0B ≈ 0.0789
Average ≈ 0.14 (14%)
We use the figures of 38.9% and 14% as reference points to infer the liquidation scale of other exchanges, assuming they follow ratios similar to Hyperliquid.
Next, we apply these ratios to Binance, Bybit, and OKX:
For each centralized exchange (CEX), we calculate two types of "adjusted" liquidation data:
One based on Hyperliquid's liquidation-to-volume ratio
The other based on Hyperliquid's liquidation-to-open interest ratio (OI).
Finally, we take the average of these two adjusted results for each date to derive a more comprehensive estimate.
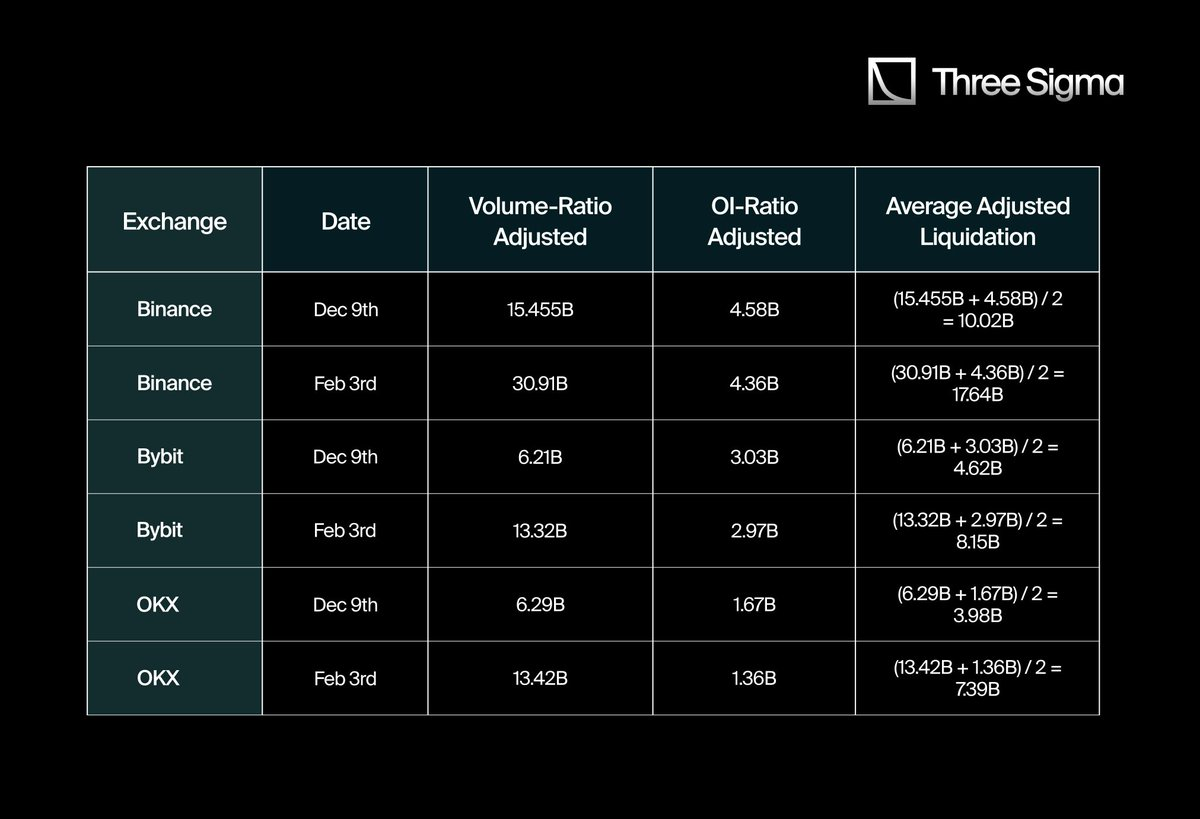
Thus, the liquidation amounts reported by centralized exchanges (CEXs) (typically in the hundreds of millions) are actually far lower than the billions estimated based on Hyperliquid ratios.
Below are comparison charts of "Reported Liquidations vs. Adjusted Liquidations" for December 9 and February 3. Each exchange's chart contains two sets of bars: light blue and light green represent reported liquidation amounts, while dark blue and dark green indicate adjusted liquidation amounts.
The adjusted liquidation values are calculated based on the average of Hyperliquid's liquidation-to-volume ratio and liquidation-to-open interest ratio as a benchmark. Although this method can more intuitively reveal potential liquidation discrepancies between different exchanges, the adjusted values may still have some bias due to differences in market structure, retail trading proportions, and market maker activities among exchanges. For example, some exchanges may report lower liquidation data due to higher retail participation, while others may underestimate liquidation amounts due to active market maker behavior.
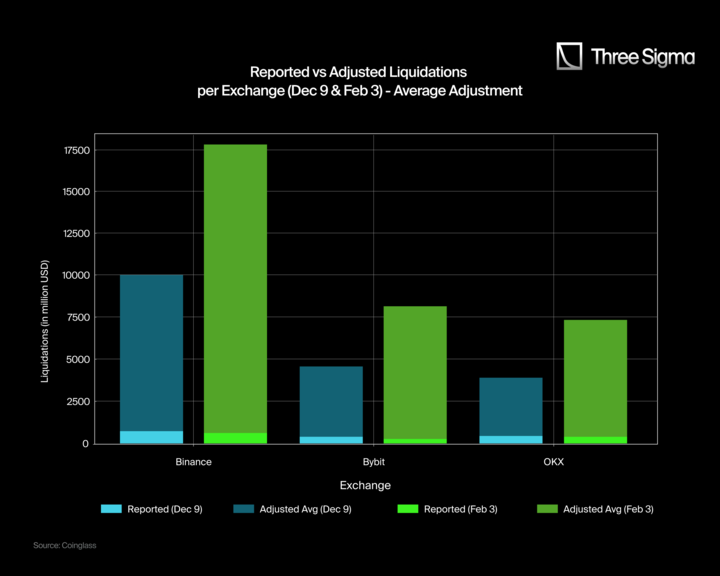
Key Findings
Liquidation amounts for Binance, Bybit, and OKX are significantly underestimated: The reported liquidation amounts (light blue/light green) are far lower than the adjusted values (dark blue/dark green), indicating that the actual liquidation amounts may be much higher than the publicly disclosed data.
The discrepancy in Binance's liquidation amounts is particularly pronounced: According to adjusted data, Binance's actual liquidation amount on February 3 should be close to $17.64 billion, rather than the reported $611 million, highlighting a massive data discrepancy. Similarly, on December 9, Binance's liquidation amount should be $10.02 billion, not the reported $739 million.
Bybit and OKX exhibit similar trends: Bybit's adjusted liquidation amount on February 3 is estimated at $8.15 billion, while the reported value is only $247 million; on December 9, the adjusted amount is $4.62 billion, compared to the reported value of just $370 million. OKX's discrepancies are also significant, with an adjusted liquidation amount of $7.39 billion on February 3, while the reported value is only $402 million; on December 9, the adjusted amount is $3.98 billion, compared to the reported value of just $425 million.
3.3. "Real" Estimates of Major Liquidation Events
By comparing Hyperliquid's liquidation data with the reported data from major centralized exchanges (CEXs), we find a significant gap between the two. To quantify this difference, we collected relevant data from Binance, Bybit, and OKX on December 9 and February 3, focusing on their liquidation-to-volume ratio and liquidation-to-open interest ratio.
To more accurately estimate the true liquidation scale of these exchanges, we first calculated Hyperliquid's average liquidation ratio and applied it as a benchmark to the CEX data. In the calculation process, we did not use a simple average but instead employed a weighted average method, adjusting the liquidation ratios based on each exchange's trading volume share on specific dates. This method provides a more comprehensive reflection of the overall market's liquidation activity level.
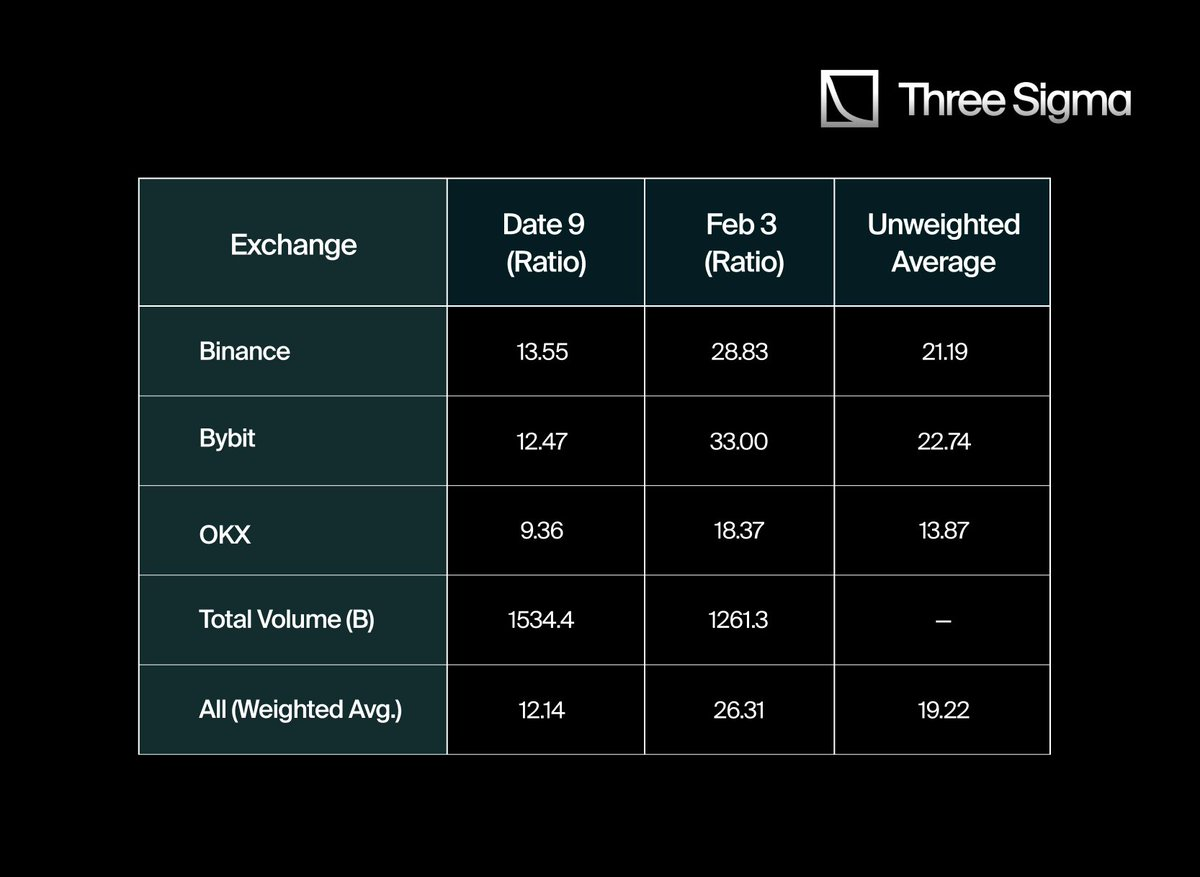
When we first calculated the liquidation multipliers for each exchange, the results showed Binance at 21.19, Bybit at 22.74, and OKX at 13.87. If we simply take the average, the global liquidation coefficient is 19.27 times. However, after adjusting for the weighted differences in trading volumes among exchanges, the more accurate weighted average is 19.22 times.
This means that the actual liquidation scale of centralized exchanges (CEXs) may be approximately 19 times higher than the officially reported data, or at least significantly higher than the data publicly disclosed through their restricted APIs.
Based on this 19.22 times liquidation multiplier, we analyzed some of the most significant liquidation events in cryptocurrency history, attempting to estimate the true liquidation amounts for these events. If this data were disclosed as transparently as Hyperliquid, the actual liquidation amounts might be much closer to the adjusted results. The table below shows a comparison between commonly cited liquidation amounts and the adjusted values derived using the corrected 19.22 times multiplier:
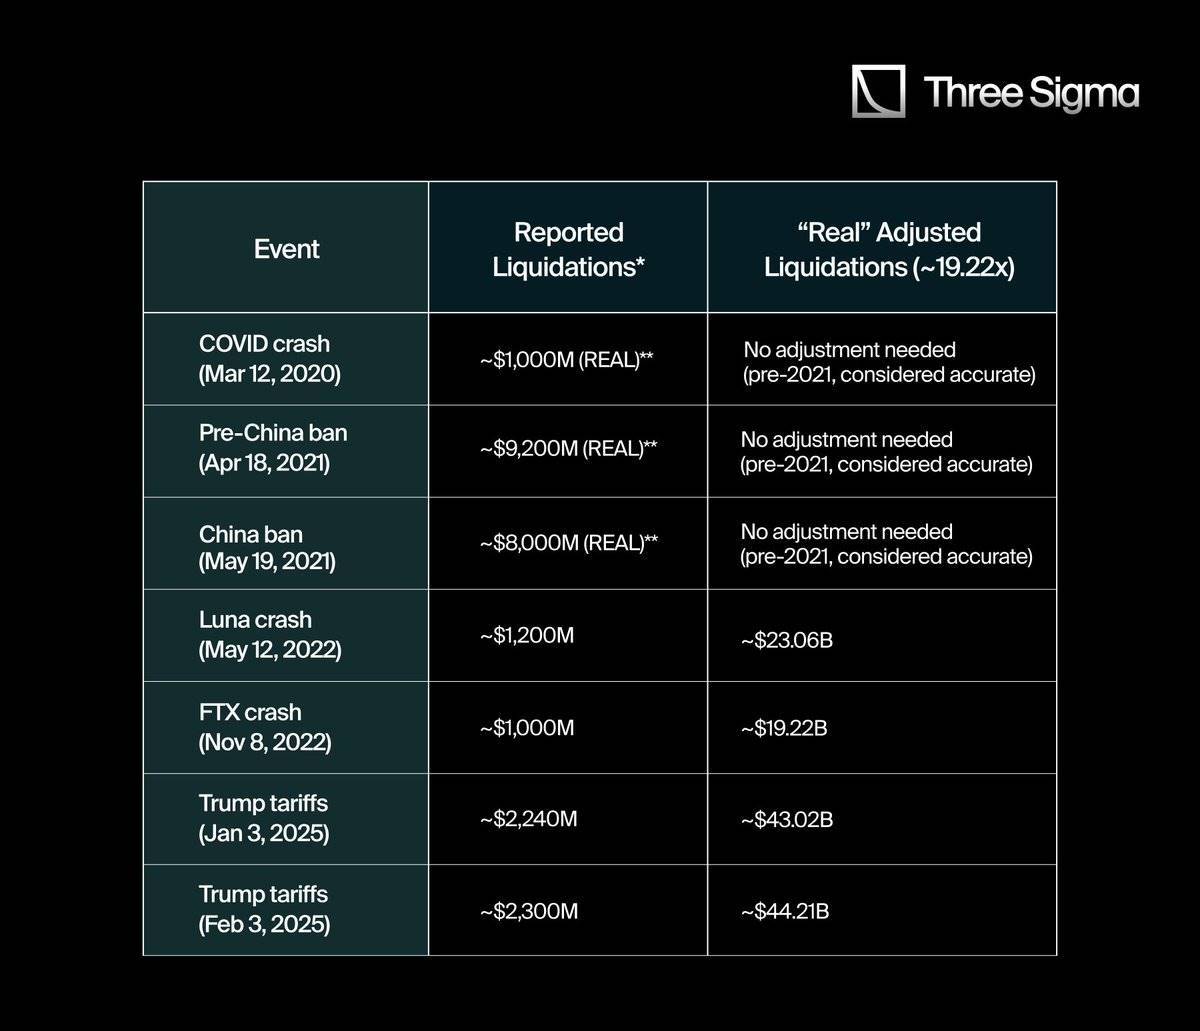
"Reported" refers to figures published through data aggregation platforms, social media, or restricted APIs.
- Before the second quarter of 2021, the reliability of liquidation data was relatively higher due to the absence of API restrictions.
By comparing the "real" liquidation data with the broader cryptocurrency market capitalization, we can gain a more detailed understanding of each event's impact on market dynamics. This not only reveals the scale of capital consumed in a short period but also reflects the potential dramatic fluctuations in market sentiment during leveraged liquidations.
In many cases, after adjusting for underreported data, the ratio of liquidations to market capitalization appears even more striking, indicating that market participants may have faced greater systemic risks than initially perceived.
Therefore, analyzing the ratio of liquidations to market capitalization can help us better understand how market psychology and liquidity conditions undergo significant changes during periods of extreme volatility.
3.4. Comparison of Liquidation Scale and Total Market Capitalization
To gain a more comprehensive understanding of the impact of major liquidation events, we compared the "real" total liquidation amounts of these events with the total cryptocurrency market capitalization at the time. The calculation formula is: Liquidation-to-Market Cap Ratio = (Liquidation Amount / Market Cap) × 100.
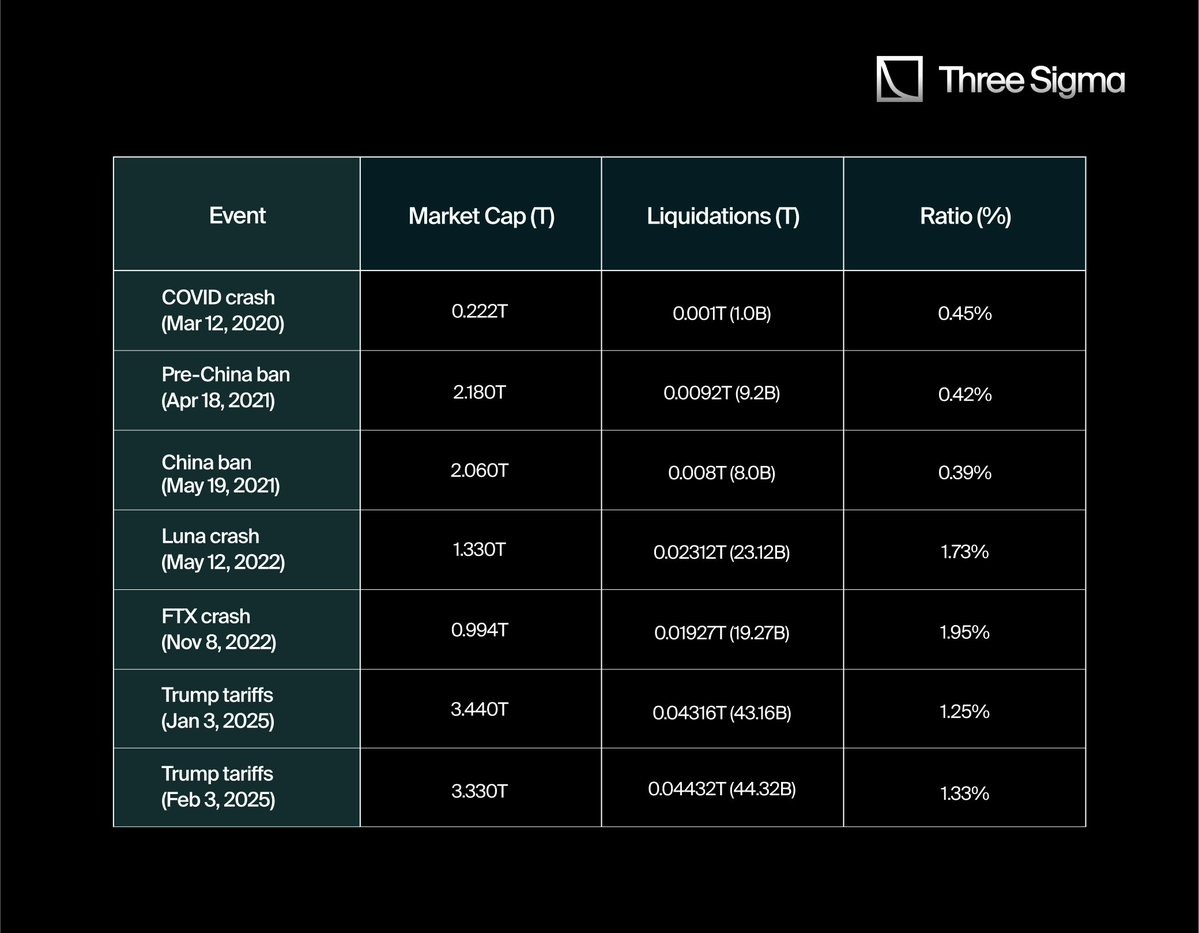
This ratio helps us analyze the extent of each liquidation event's impact on the market more deeply. On one hand, it shows the scale of capital liquidated in the market over a short period; on the other hand, it reflects the dramatic changes in market sentiment during the unwinding of leverage.
After adjusting for underreported data, we found that the ratio of liquidations to market capitalization became more significant. This indicates that market participants may have faced higher systemic risks than previously anticipated, which may not have been fully recognized at the time of the events.
Thus, analyzing the ratio of liquidations to market capitalization can help us better understand the psychological changes in the market and the shifts in liquidity conditions during periods of extreme volatility.
4. Conclusion
Through the data and comparisons presented above, we can clearly see a trend: the liquidation data published by CEXs is often significantly lower than the actual liquidation activities that occur. After adjusting for the transparent ratios provided by Hyperliquid, events like the Luna collapse and the FTX collapse exhibited market impacts far exceeding what the official data indicated. This phenomenon further supports the view that CEXs may underreport liquidation data to mitigate market volatility or influence public perception.
This comparison is particularly evident when analyzing historical events. For example, while the COVID crash in 2020 was massive at the time, it appears relatively small compared to now, primarily because there were fewer participants in leveraged trading back then. As leveraged trading has become more widespread, the scale of liquidations has significantly increased, both in absolute and relative terms. However, due to the limitations of official data streams, traders and analysts may not fully grasp the actual state of systemic risks.
Moreover, exchanges often restrict the disclosure of real-time liquidation data under the guise of "optimizing data flow" or "ensuring fair trading conditions," but in reality, such practices may serve broader interests. For instance, underreporting liquidation data can reduce panic among novice retail investors while providing exchanges with more proprietary insights into overall market risk exposure.
Nevertheless, transparency in the industry is gradually improving. For example, Bybit's Ben recently announced that Bybit has begun to publicly disclose real liquidation data, which may signal a trend toward greater transparency in the industry. More details can be found at this link.
While Bybit's initiative may help narrow the gap between reported and actual liquidation activities, the completely on-chain and unrestricted reporting method provided by Hyperliquid still highlights the importance of transparency. For those seeking to understand the complexities of cryptocurrency leveraged trading, true transparency is an indispensable tool.
免责声明:本文章仅代表作者个人观点,不代表本平台的立场和观点。本文章仅供信息分享,不构成对任何人的任何投资建议。用户与作者之间的任何争议,与本平台无关。如网页中刊载的文章或图片涉及侵权,请提供相关的权利证明和身份证明发送邮件到support@aicoin.com,本平台相关工作人员将会进行核查。


