Author: Bitcoin Magazine Pro
Translated by: Blockchain in Plain Language

The price movement of Bitcoin is typically analyzed through on-chain data, technical indicators, and macroeconomic trends. However, a severely underestimated yet extremely important factor is Global Liquidity. Many investors may not fully utilize this metric and may even misunderstand how it affects Bitcoin's cyclical trends.
1. The Impact of Global Liquidity on Bitcoin
As discussions about global liquidity heat up on platforms like Twitter (X), and analysts delve deeper into liquidity data, understanding the relationship between global liquidity and Bitcoin prices has become a must for traders and long-term investors. However, recent trends have deviated from traditional expectations, indicating that the market may require a more nuanced analytical perspective.
Global M2 money supply refers to the total of all liquid money, including cash, demand deposits, and easily convertible quasi-money assets.
When global M2 expands, capital typically flows into high-yield assets, including Bitcoin, stocks, and commodities, driving prices up.
Conversely, when M2 contracts, market liquidity tightens, and risk assets often face downward pressure on valuations.
In the current market environment, the traditional relationship between liquidity and asset prices may be changing, posing higher demands for understanding among investors.
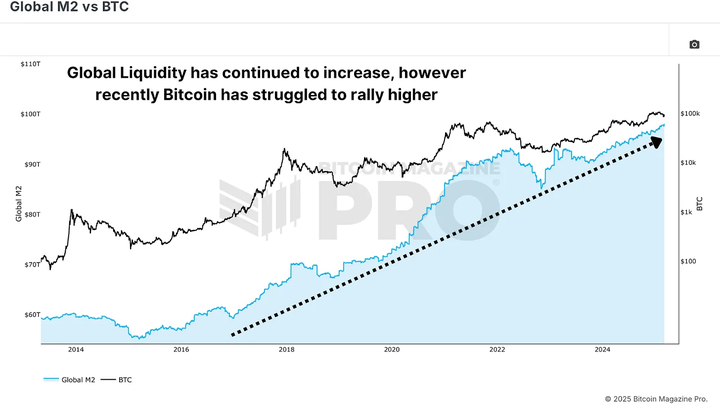
Figure 1: Global liquidity is rising, but Bitcoin prices have recently declined
Historical Trend: Divergence Between Bitcoin Prices and Global M2
Historically, Bitcoin prices have typically risen alongside the expansion of global M2 money supply, while facing pressure during liquidity contractions. However, in this cycle, we have observed a clear divergence: despite the continuous growth of global M2, Bitcoin's price movements have shown inconsistency.
2. Year-on-Year Changes: A More Accurate Measure of Liquidity
Rather than simply focusing on the absolute value of global M2, a more insightful approach is to analyze its year-on-year change rate (YoY). This metric reflects the speed of liquidity expansion or contraction, revealing a clearer connection between Bitcoin price performance and liquidity.
When we compare Bitcoin's year-on-year return with the year-on-year change in global M2, we find that the correlation between the two significantly strengthens.
Bitcoin's strongest bull market phases often occur during periods of rapid liquidity expansion.
Liquidity contractions typically precede Bitcoin price corrections or prolonged consolidation.
This finding suggests that investors need to pay closer attention to changes in the growth rate of global liquidity, rather than just the absolute level of liquidity.
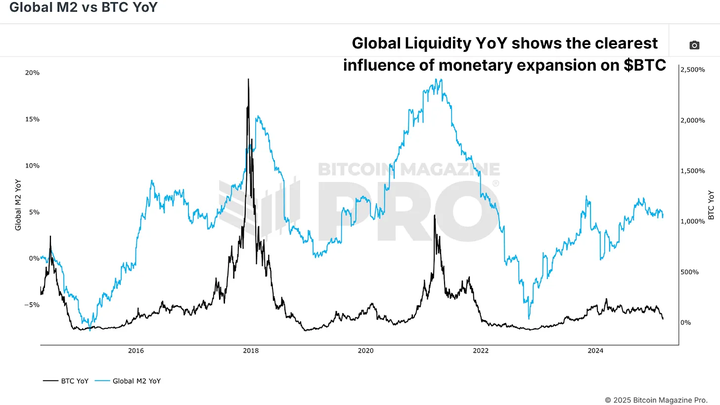
Figure 2: The annual change rate of global liquidity can more clearly reveal liquidity cycles
For example, during the consolidation phase of Bitcoin in early 2025, global M2 steadily increased, but its growth rate began to stabilize. Only when the pace of M2 expansion significantly accelerates can Bitcoin potentially break new highs.
3. The Lag Effect of Liquidity
Another key observation is that the impact of global liquidity on Bitcoin is not instantaneous. Research shows that Bitcoin's price typically lags behind changes in global liquidity by about 10 weeks.
If we shift the global liquidity indicator forward by 10 weeks, the correlation with Bitcoin's price movements significantly strengthens.
Further optimization reveals that the most accurate lag period is approximately 56 to 60 days, or about 2 months.
This lag effect means that investors need to consider the time delay when analyzing the impact of liquidity on Bitcoin, rather than just focusing on the current level of liquidity.
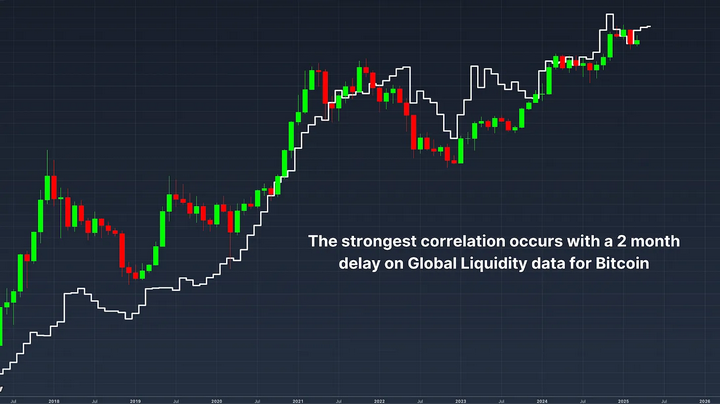
Figure 3: The strongest correlation occurs when liquidity data lags by two months
4. Bitcoin Outlook
For most of 2025, global liquidity entered a consolidation phase, following a strong expansion at the end of 2024 that propelled Bitcoin to new highs. This liquidity consolidation period coincided with Bitcoin's consolidation and correction to around $80,000.
However, if historical trends continue to hold, the recent rebound in global liquidity is expected to bring a new round of increases for Bitcoin around the end of March.
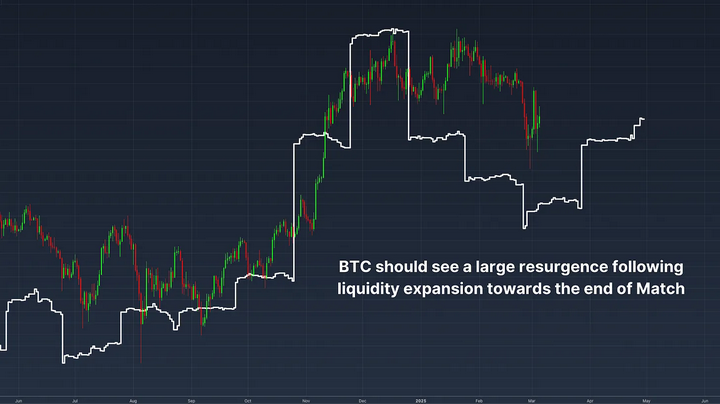
Figure 4: Liquidity is surging, but Bitcoin may need a few more weeks to truly benefit
5. Conclusion
Global Liquidity is an important macro indicator for predicting Bitcoin trends. However, rather than relying on static M2 data, a more effective approach is to focus on the rate of change of M2 and understand that Bitcoin prices typically lag by about two months.
As the global economic environment changes and central banks adjust monetary policies, Bitcoin's price will continue to be influenced by liquidity trends. The coming weeks are crucial—if global liquidity continues to accelerate, Bitcoin may experience a significant market rally.
免责声明:本文章仅代表作者个人观点,不代表本平台的立场和观点。本文章仅供信息分享,不构成对任何人的任何投资建议。用户与作者之间的任何争议,与本平台无关。如网页中刊载的文章或图片涉及侵权,请提供相关的权利证明和身份证明发送邮件到support@aicoin.com,本平台相关工作人员将会进行核查。


