We are in a transition of systems or environments, and this adjustment period may just be a market correction and economic contraction.
Author: Doug O'Laughlin
Translation: Deep Tide TechFlow
Sorry for disappearing for a while recently. I just finished moving to New York City while also facing some health issues. One update to share is that I will be taking a week off starting March 27 for recovery after outpatient surgery. But now, let's get to the point.
The market is rapidly adjusting pricing based on the impending economic recession, partly due to the policies of the Trump administration and significant pressure on the dollar. I will provide a casual summary from a macroeconomic perspective and discuss the semiconductor industry and areas of interest to me. Let's start with a macro view and then delve deeper.
"Man-Made" Economic Recession and 10-Year Treasury Yield
Recent commentary suggests that the current government is more focused on the 10-year Treasury yield than on stock market levels—this is different from past strategies (such as the so-called "Trump protection"). The term "adjustment period" was mentioned multiple times in an interview on Fox News, indicating a shift in government focus from stock market performance to signals from the bond market.
The main indicator for measuring this is the 10-year Treasury yield. The 10-year Treasury yield is the borrowing rate that the U.S. government pays, and by lowering this key rate, housing affordability or consumers' ability to purchase cars can be improved. However, "manipulating" the 10-year Treasury yield is not as straightforward as adjusting interest rates. Interest rate adjustments are primarily determined by the Federal Reserve's overnight bank lending rate, while the price of the 10-year Treasury is determined through market-driven auctions to investors willing to buy government bonds.
The problem is that the 10-year Treasury yield is not an exact science. No one really knows how the 10-year Treasury yield fluctuates; its price is determined by trading and is believed to reflect inflation and the real GDP growth of the issuing country.
This brings challenges. Tariffs may trigger inflationary pressures in the short term, and if the 10-year Treasury yield drops to 3% (as some, like Bessent, predict), it may reflect a downward adjustment in expectations for real growth. In this case, the market may view the economic recession as a necessary adjustment.
Currently, the market is anticipating just that. Here is the yield curve from a month ago compared to now. Specifically, the short end of the curve has begun to decline. This means the market is rapidly pricing in lower short-term rates and a lower federal funds rate. In this scenario, it may not be a sign of declining inflation but rather a reflection of economic weakness and the market's belief that the Fed's rate cuts are not fast enough.
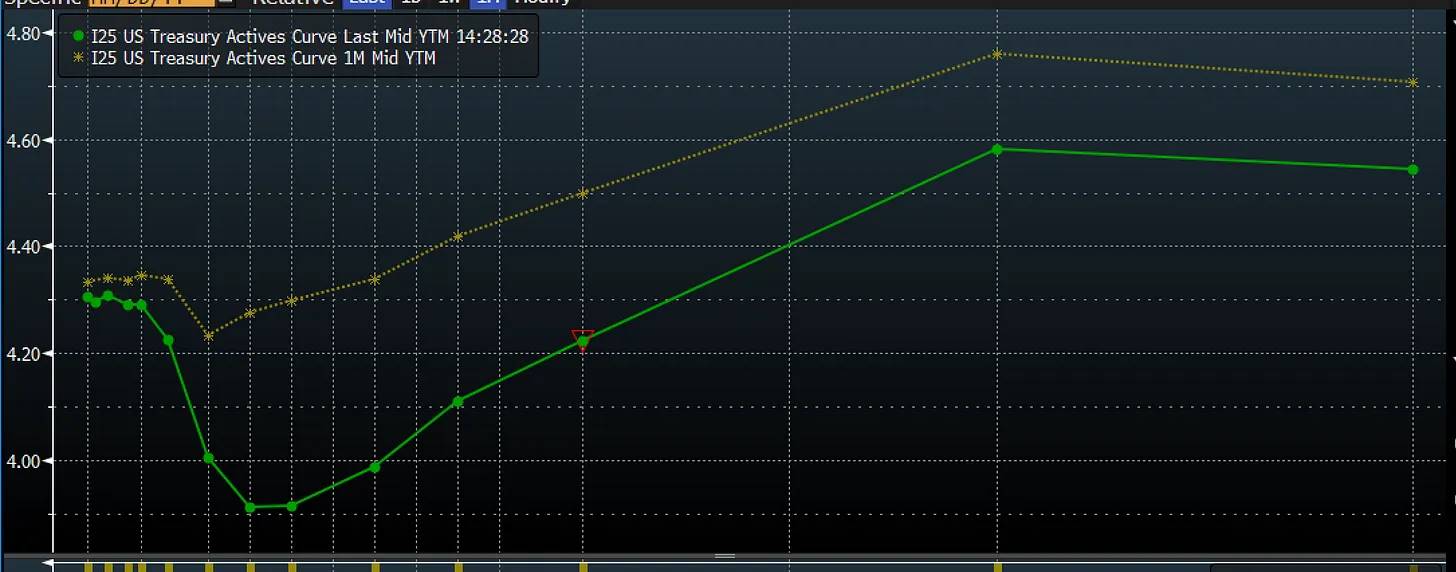
Source: Bloomberg
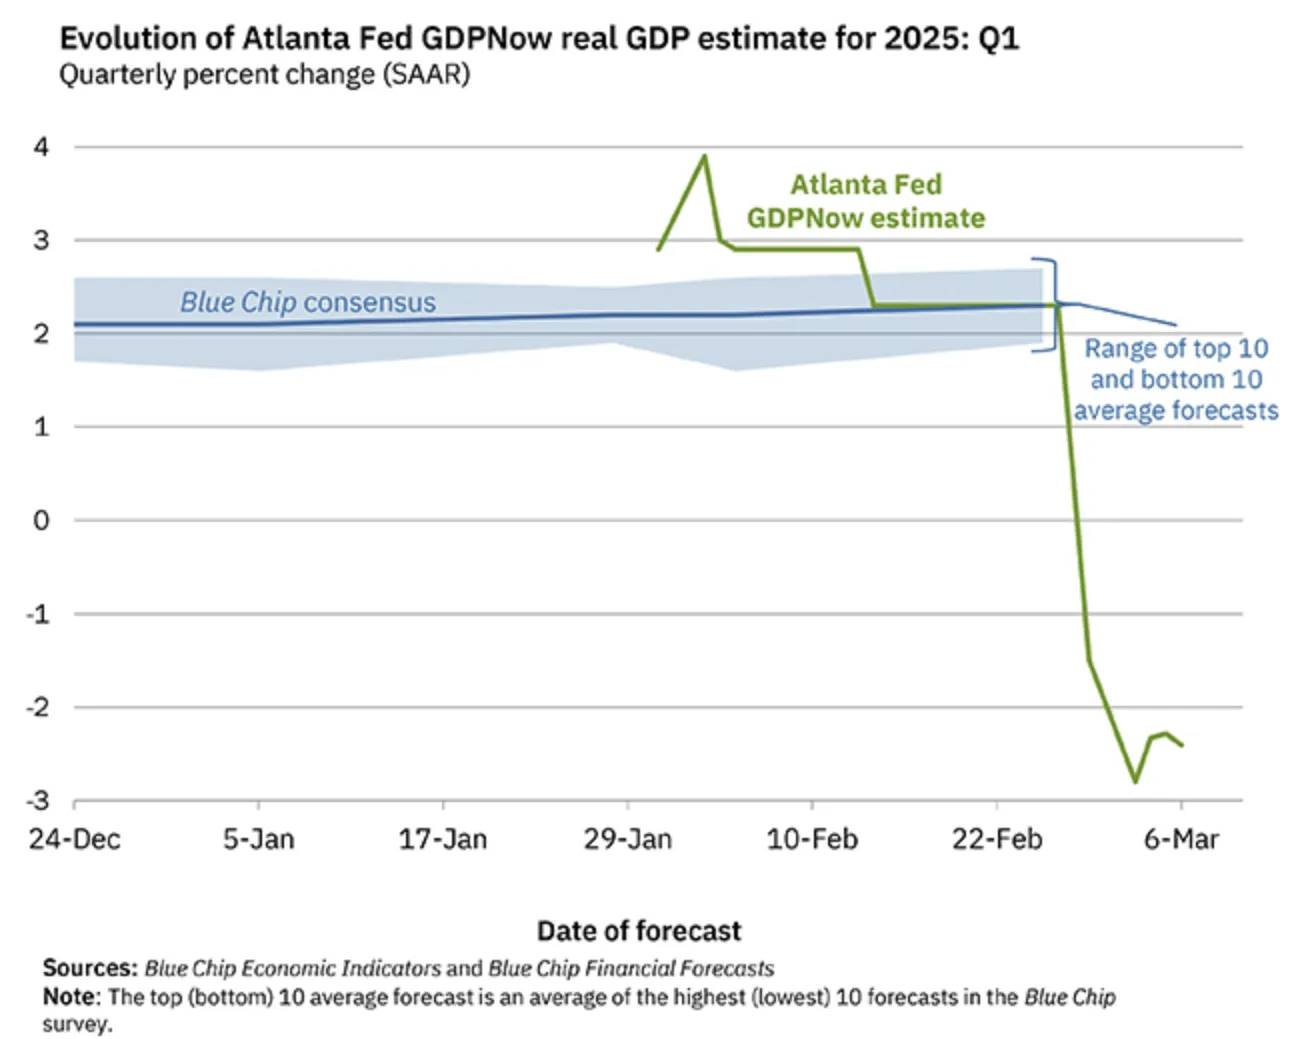
We are experiencing all of this in real-time. GDPNow (a real-time economic forecasting tool) now predicts a significant contraction in the economy in the first quarter, which has technical reasons behind it, but the overall trend is still weakening.
One important factor is the impact of net imports on GDP calculations. Net imports are deducted in GDP calculations, which is partly a response to tariffs. But beneath this surface, the economy is broadly weakening. The above chart shows the trend of changes in growth contributions and their estimates. Imports have been a significant drag, but more importantly, the change rates of most other categories are also deteriorating.
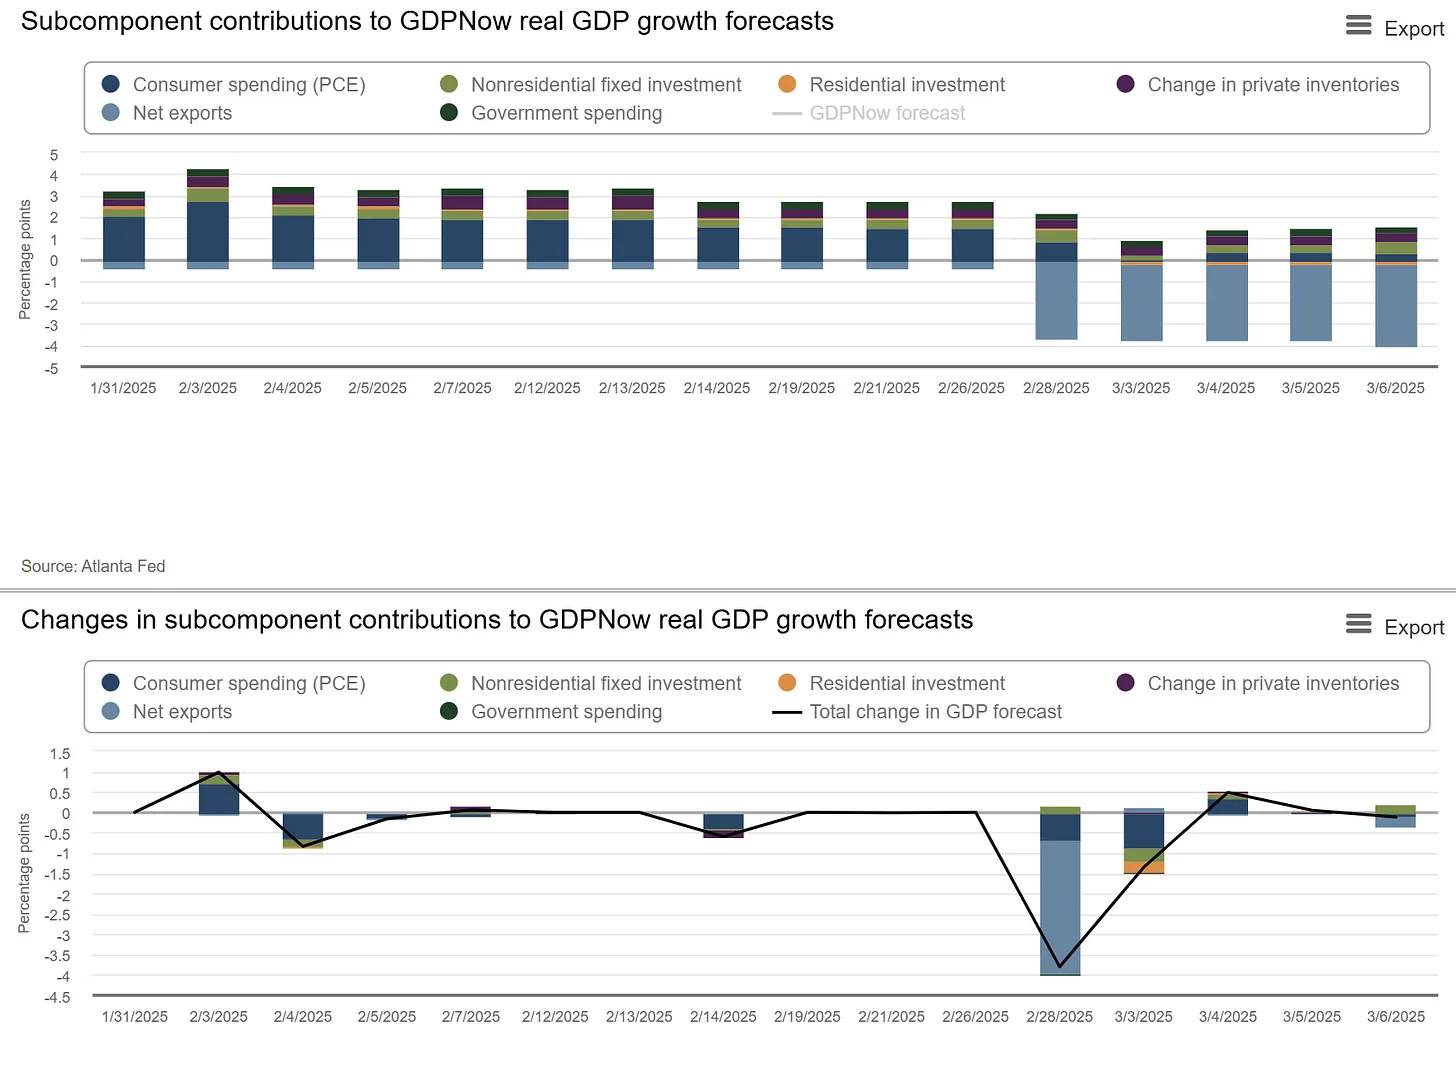
Source: GDPNow
The second chart further illustrates the weakness in imports, while residential investment, government spending (expected), and consumer spending are also weakening. Similar to the situation during the economic contraction in the second quarter of 2022, the change rates are deteriorating sharply. Below is a chart of growth contributions from 2022, when the economy was impacted by a significant reduction in inventories.
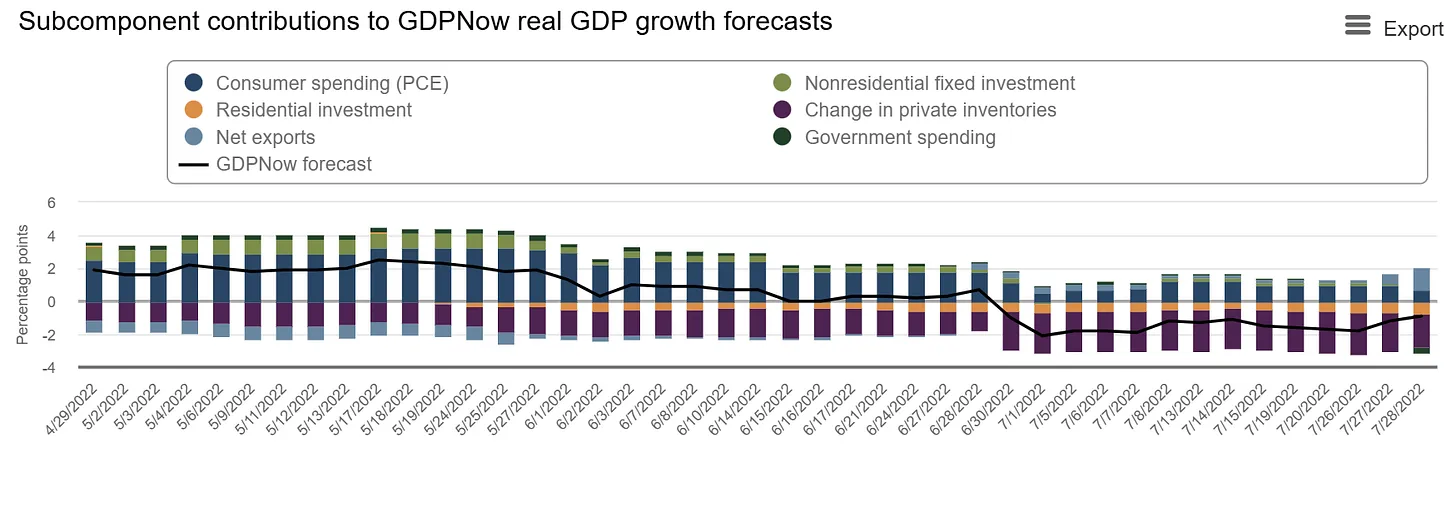
This situation quickly reversed as inventories normalized. So, will this tariff anticipatory effect recover as quickly (one-time) as the post-pandemic inventory adjustments, or will it lead to a downward spiral in consumer and business confidence?
The issue is that consumer confidence is beginning to decline, and some leading indicators (such as the Consumer Confidence Index and the Leading Economic Index) are also starting to slide. What is concerning is that this decline is accelerating. Most economic indicators and consumption data seem to point to further weakness and uncertainty.
The yield curve shows signs of economic weakness alongside a surge in imports, declining consumer confidence, and the possibility of a technical recession. Expectations of economic weakness can have a reflexive effect, as seeing economic weakness prompts people to increase savings. Trump is now using the term "transition period," but this phrasing is generally not a good sign in the market.
Timing is very delicate. The yield curve has just normalized, and this almost always marks a painful beginning. When the curve steepens, a correction or recession begins. In other words, an inverted yield curve typically signals a recession; and when the yield curve normalizes, the recession and its impact on the stock market begin. What we are seeing now is that the yield curve inverted at the end of September last year.
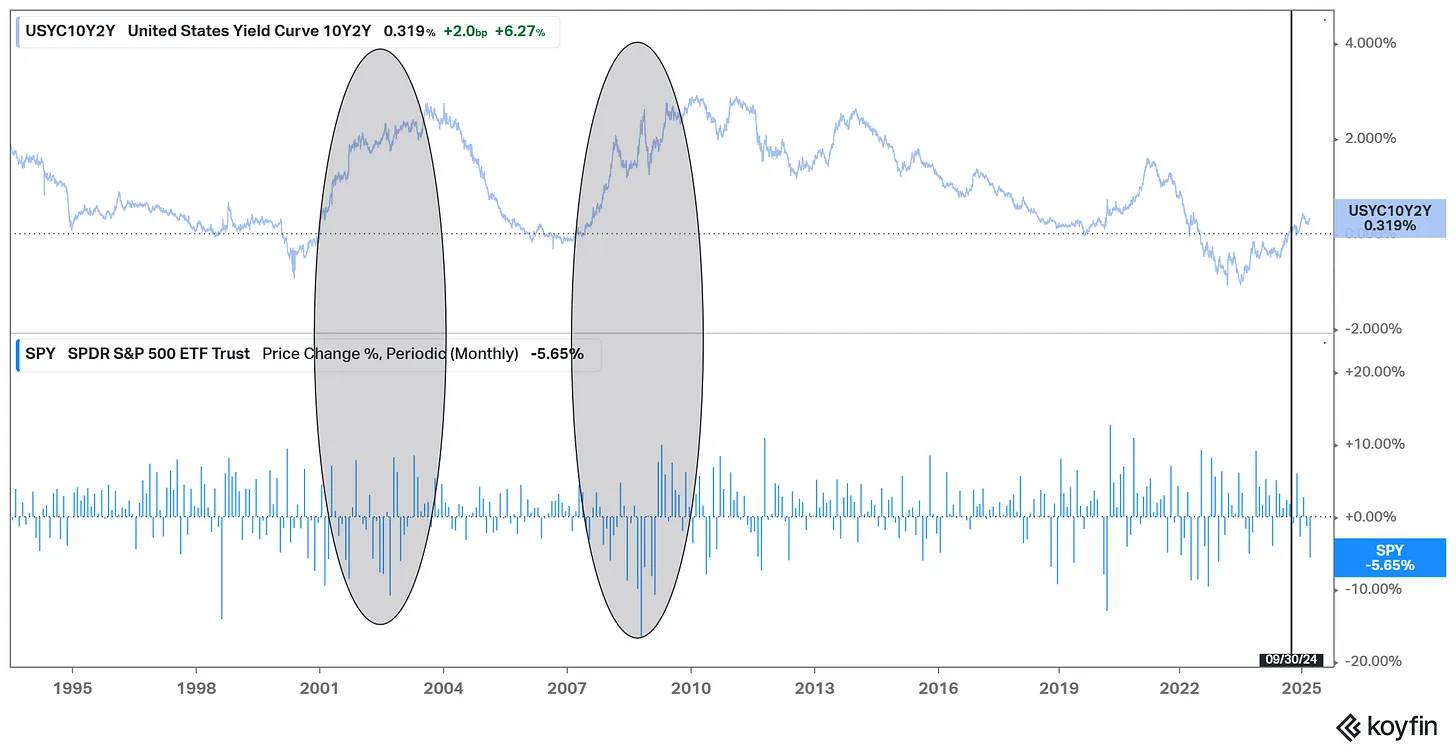
Source: Koyfin
We are currently experiencing pain. Another key factor is tariffs and uncertainty, as uncertainty in economics is almost synonymous with volatility. When we cannot determine whether the tariff rate is 10%, 20%, or 25%, decision-making becomes more difficult. However, an overwhelming theme is trade.
Trade Deficit and Capital Flows
The U.S. has long had a massive trade deficit, meaning imports exceed exports. However, these dollars do not just disappear; they are transferred to foreign entities as payment for goods and services. These foreign exchange funds typically flow back into U.S. financial markets through investments. In this way, the trade deficit is accompanied by capital inflows that fund the purchase of U.S. assets.
This creates a natural impetus to purchase U.S. assets with dollars accumulated from the trade deficit. It can be seen as a natural inflow of dollars brought about by trade.
However, Trump's policies have explicitly focused on trade through tariffs. Tariffs naturally raise consumer prices, reduce trade, and, if high enough, decrease the trade deficit. This reduces the dollars flowing back to the U.S., which in turn has a more adverse effect on asset prices—capital outflow.
Raising tariffs may mean a reduction in the dollars accumulated by foreign entities, which are already the largest buyers of U.S. assets. For example, a large Japanese corporate group with a trade surplus with the U.S. will reduce its asset purchases, including U.S. Treasuries, due to reduced business. Given that a significant portion of U.S. Treasury auctions is now facing capital outflow, and 24% of Treasuries are held by foreign investors, this will lower foreign investors' demand for purchases, thereby pushing up the 10-year Treasury yield. This is a very tricky situation.
The U.S. continues to raise tariffs and adopt a negative stance toward global trade, which can lead to a natural outflow of assets and prompt some foreign entities to choose to flee U.S. assets. After decades of trade deficits, this mechanism may automatically realize and spiral out of control. The trade deficit has long existed as a natural source of capital inflow. The following chart regarding the U.S. share of global market capitalization has been discussed repeatedly—now it seems there is a way to prevent capital inflow, which is tariffs.
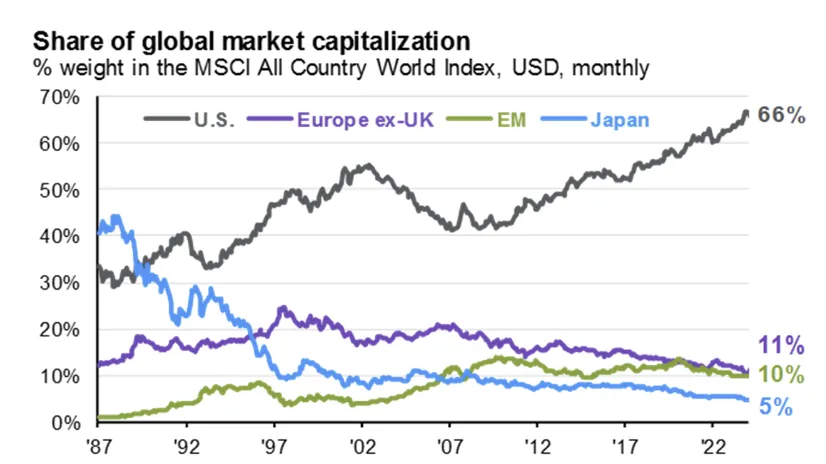
Source: JPMorgan Market Guide
Another uncertainty factor is that the "West" is no longer as united. The Financial Times is questioning the transatlantic partnership. Storing assets in allies' financial markets is one thing, but if they are no longer strong allies, it is entirely different. As the U.S. withdraws and implements reciprocal tariffs similar to the Smoot-Hawley Act (essentially unilateral tariffs that evolved into a bilateral tariff war with Canada), it is hard to say whether their alliances remain strong.
The division of trade is the division of alliances. And as this situation continues, assets will flee. A retaliatory U.S. government may push European trade toward China, the world's largest manufacturing base. The past world order is at risk, and betting all chips on the U.S. basket no longer seems like a wise strategy. So where will the assets flow? So far, Europe seems to be the biggest beneficiary.
Reversal of Roles Between the U.S. and Europe
An ironic pattern is that the U.S. and the EU are strangely swapping roles. Driven by a surge in AI investment announcements and new potential defense spending plans, Europe is doing something that has long been neglected—deficit spending.
Meanwhile, it can be argued that increasing revenue through tariffs while significantly cutting costs is the definition of austerity. This is precisely the strategy Europe adopted after the financial crisis, and now the roles are reversing. The record of austerity policies has been abysmal, while deficit spending has created the U.S.'s economic dominance and differentiation after the financial crisis.
This partially explains why assets are starting to flow out, with the largest differentiation of developed country assets shifting towards Europe. The massive funds that previously flowed into the U.S. are now reversing, initially moving towards large liquid assets in Europe or markets with similar language. One way to represent this trend is the ratio of IEV (European ETF) to the S&P 500 ETF. In 2025, the trend of the U.S. performing relatively well was broken, and the trend of funds flowing into Europe became significant.
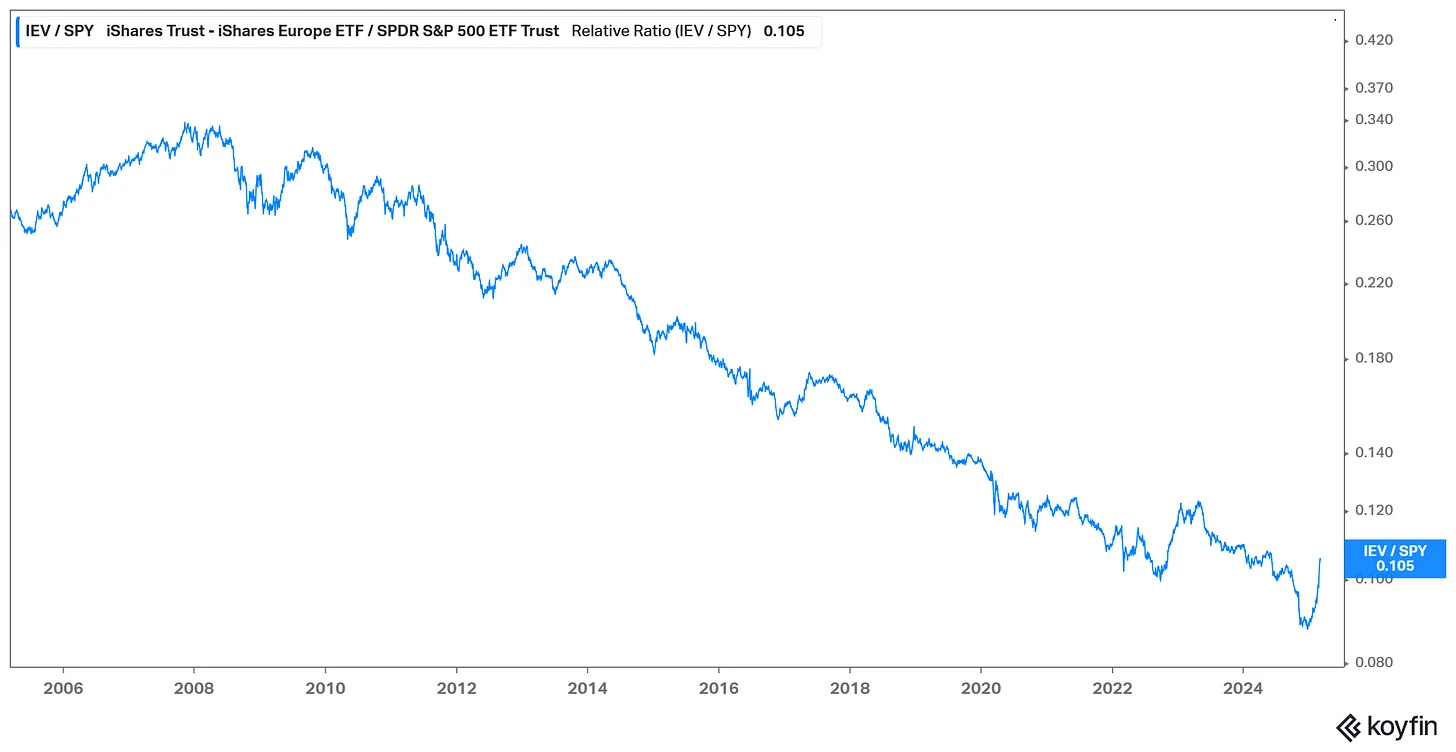
This will be a long-term trend as a significant amount of American exceptionalism trading is unraveling. Another factor accelerating this trend is the rapid decline in U.S. asset prices, while other regions of the world are performing relatively better.
But to be honest—this is a communication about semiconductors rather than macroeconomics. Most of the dynamics mentioned here are essentially a relatively consistent macroeconomic view and are being rapidly priced in by the market. The reality is that significant changes in the market take time and are quickly approaching a final outcome. This could be a dramatic process.
Market Dynamics and Semiconductors
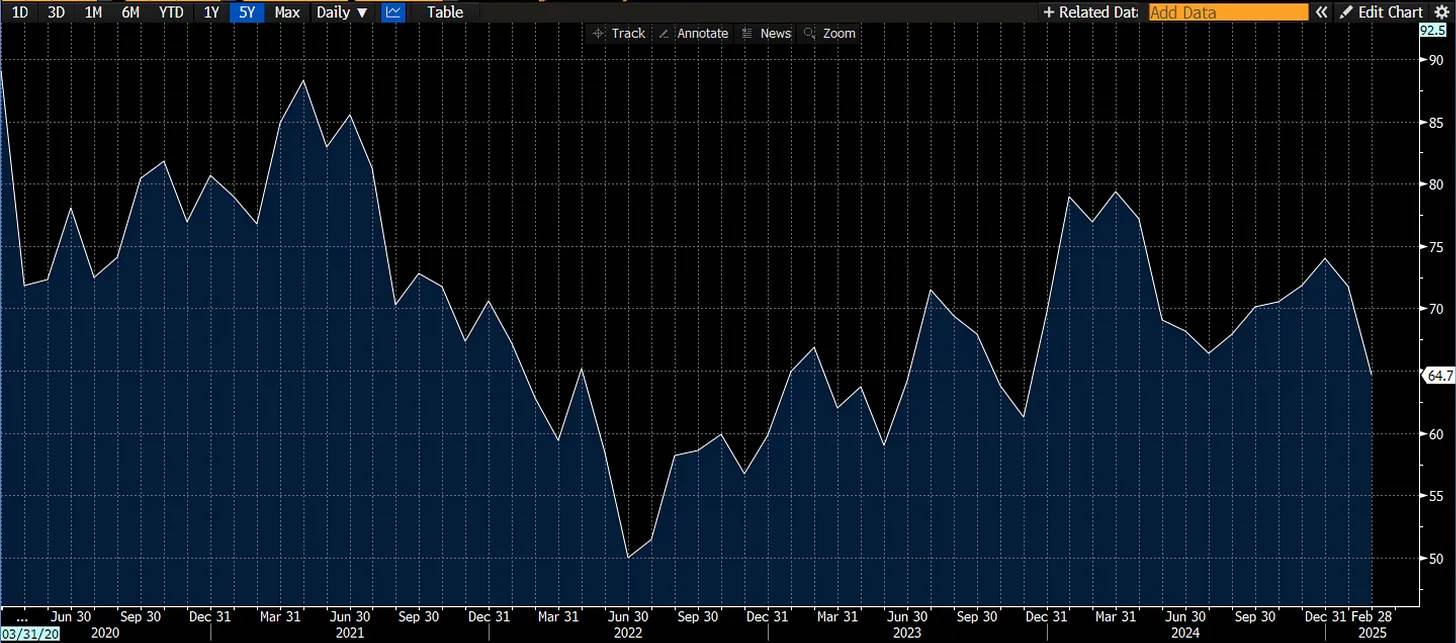
Finally, let's return to my beloved semiconductor industry. I want to make some observations. First, the situation of the market peaking is reminiscent of most market downturns. There is an old saying that the semiconductor industry leads the market, and based on my observational experience, this statement holds true.
The chart below illustrates that when the semiconductor sector stops its relative strong performance, the market often experiences a significant pullback in the following months.
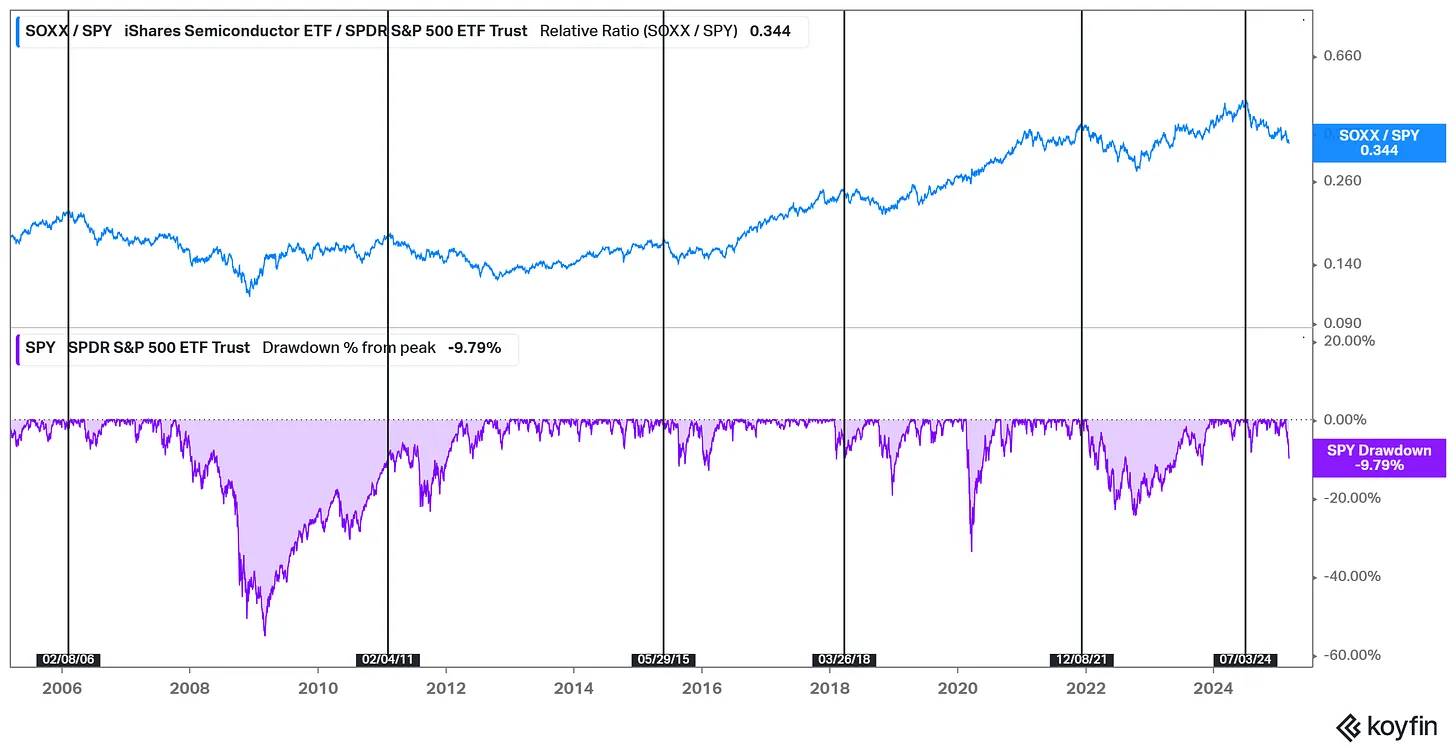
However, the semiconductor industry is cyclical. We have already experienced a downturn; if the S&P 500 index drops by 10%, the semiconductor sector typically declines by 20%, and even a 40% drop is possible. The market is telling us that the economic health is poor, which is a leading indicator reflecting changes in semiconductor company orders and future revenue growth.
The question now is, how large will this decline be? We have just seen a 10% drop, which is consistent with history. Declines usually take more time and are often more severe than this. Considering that the growth panic in 2022 was enough to cause a 20% market drop, I believe this decline may also end within that range, not to mention that this growth panic is far more severe than in 2022.
Will this lead to a recession? This question is beyond my predictive capabilities. But it is clear that there are currently some uncertain economic factors, such as trade headwinds and potential capital flows moving outside the U.S. At the very least, it is certain that we are in a transition of systems or environments. This adjustment period may just be a market correction and economic contraction.
免责声明:本文章仅代表作者个人观点,不代表本平台的立场和观点。本文章仅供信息分享,不构成对任何人的任何投资建议。用户与作者之间的任何争议,与本平台无关。如网页中刊载的文章或图片涉及侵权,请提供相关的权利证明和身份证明发送邮件到support@aicoin.com,本平台相关工作人员将会进行核查。


