Source: Cointelegraph Original: "{title}"
Driven by the news that Telegram founder Pavel Durov was permitted to travel from France to Dubai, Toncoin (TON) has surged over 50% in the past week.
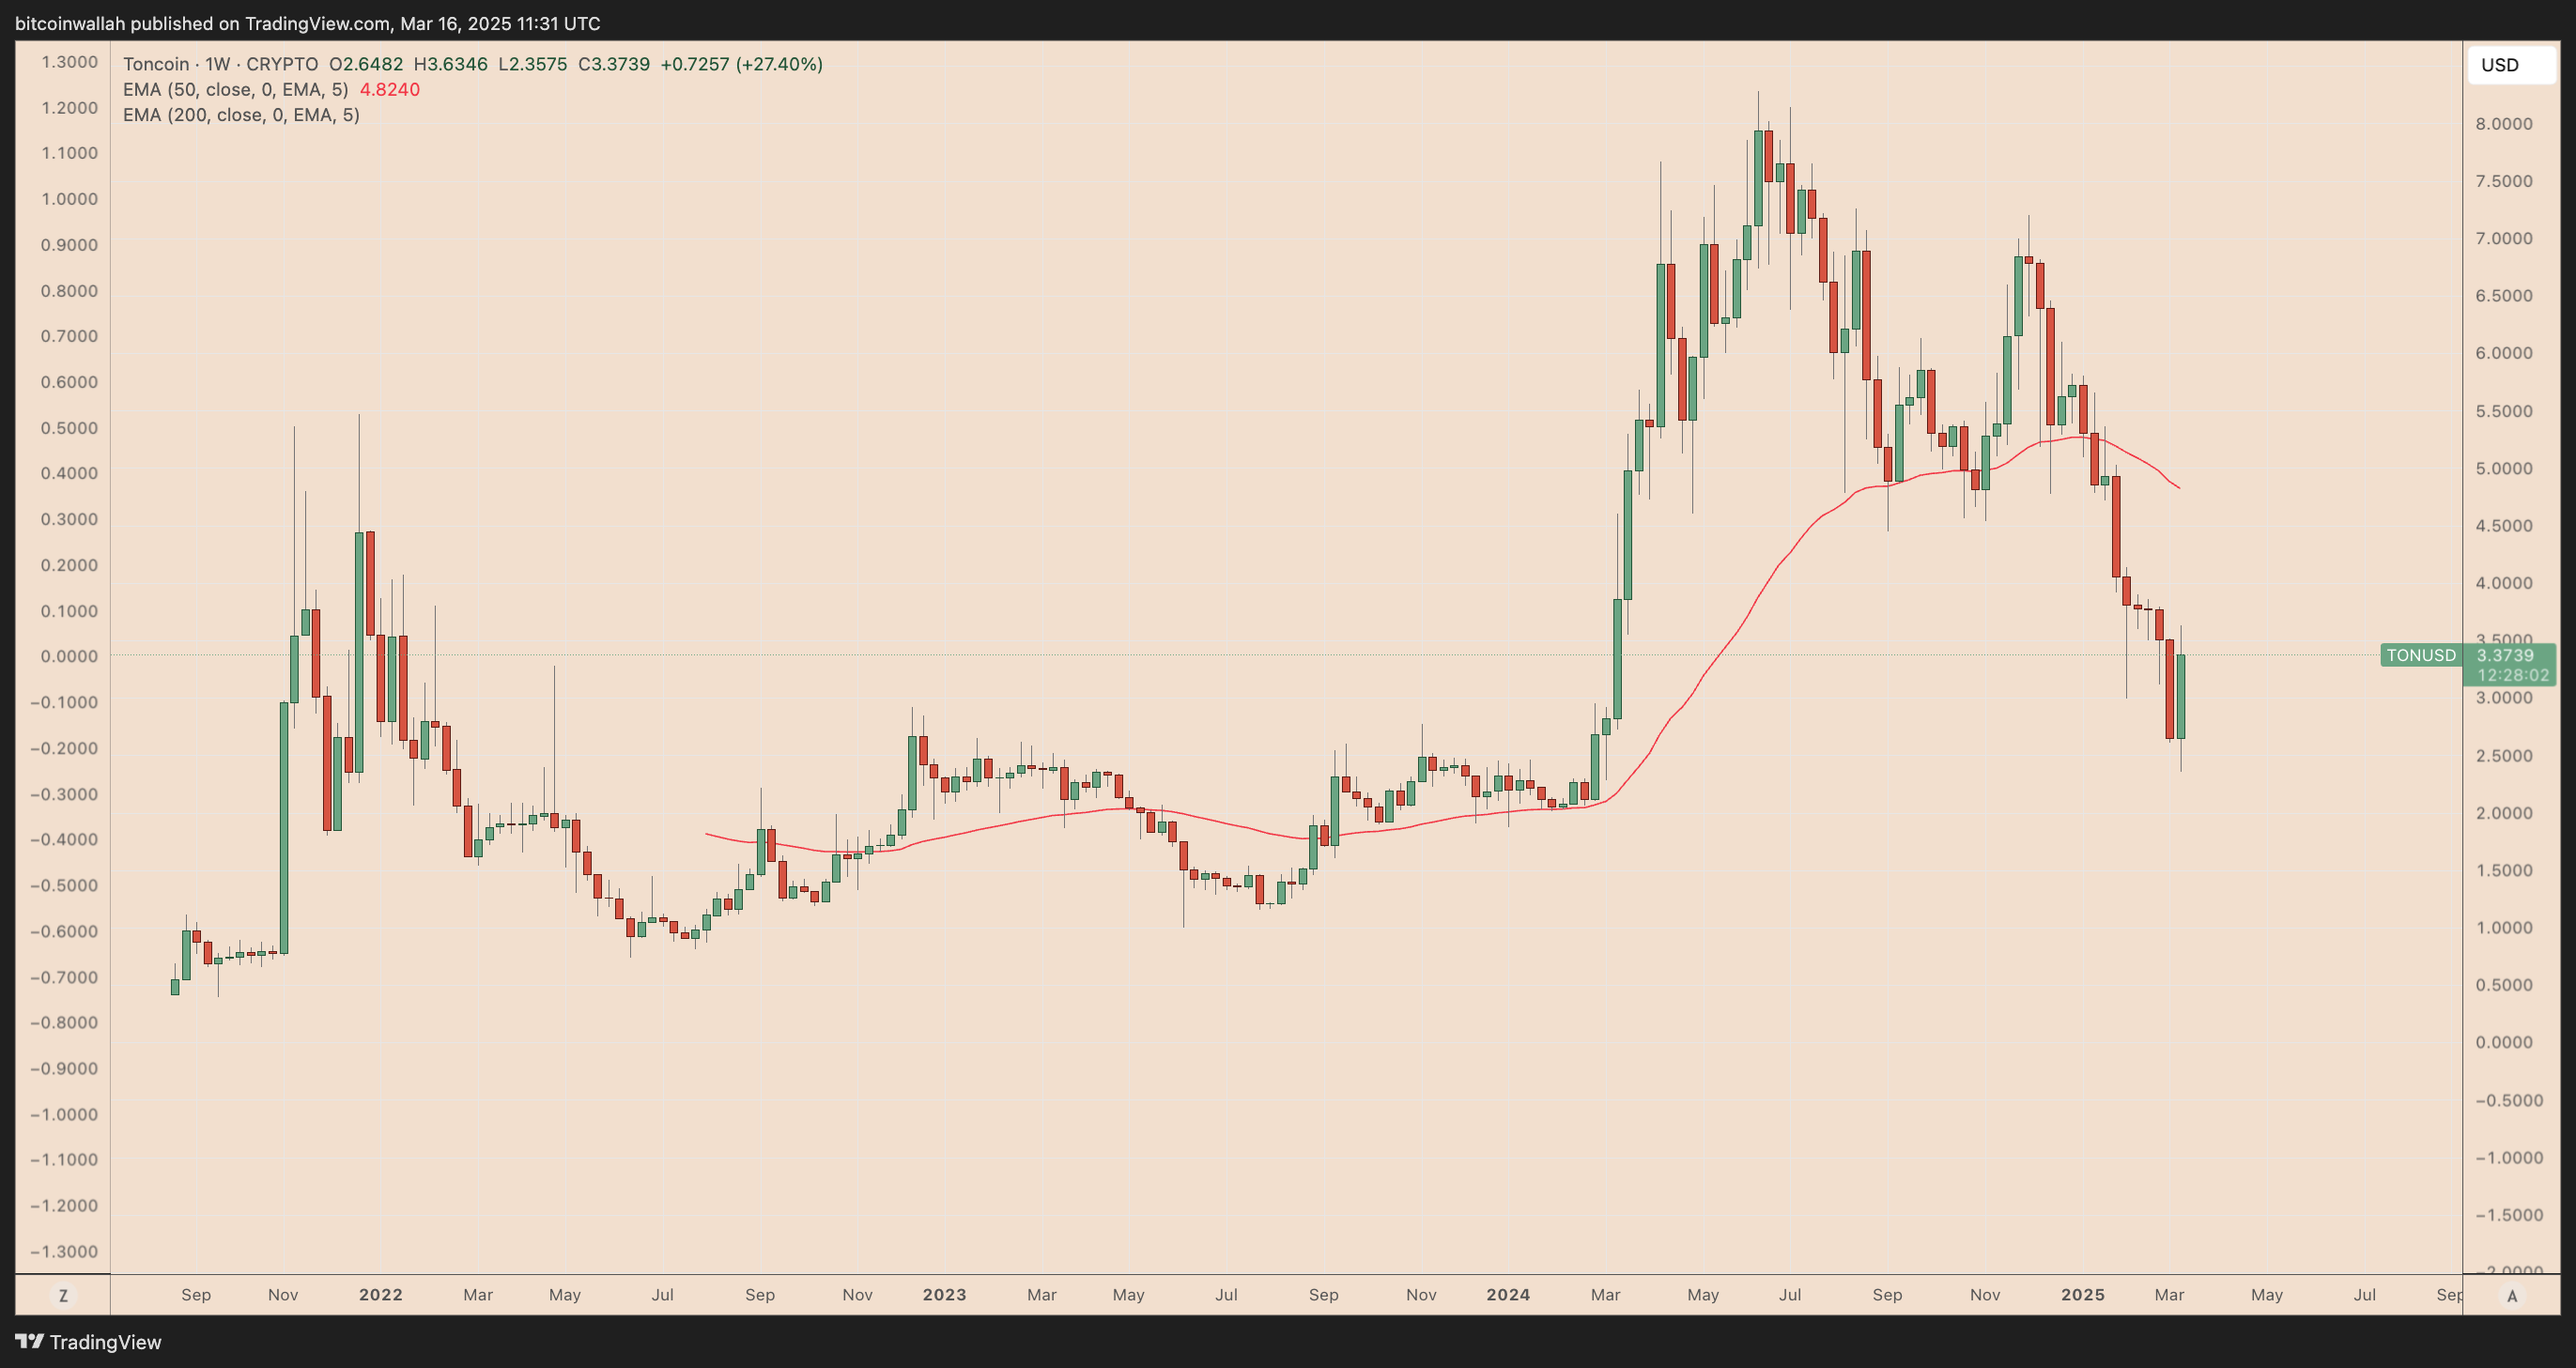
TON/USDT weekly price chart. Source: TradingView
The strong reversal in TON's price, especially the rebound after dropping to a one-year low of $2.35, has attracted traders' attention to key price points. Cryptocurrency analyst Crypto Patel emphasized that this is an "excellent entry zone" for long-term investors.
TON is expected to achieve a 100% increase by 2025
As noted by Crypto Patel, TON's price has "perfectly rebounded" from a support level of around $2.50.
Additionally, this support level is within the range of $2.40 to $3.00, which had previously served as a resistance level from December 2022 to April 2023 and from September 2023 to April 2024. The analyst believes that since TON is continuously rebounding from the same range, this area has now become an "excellent entry zone."
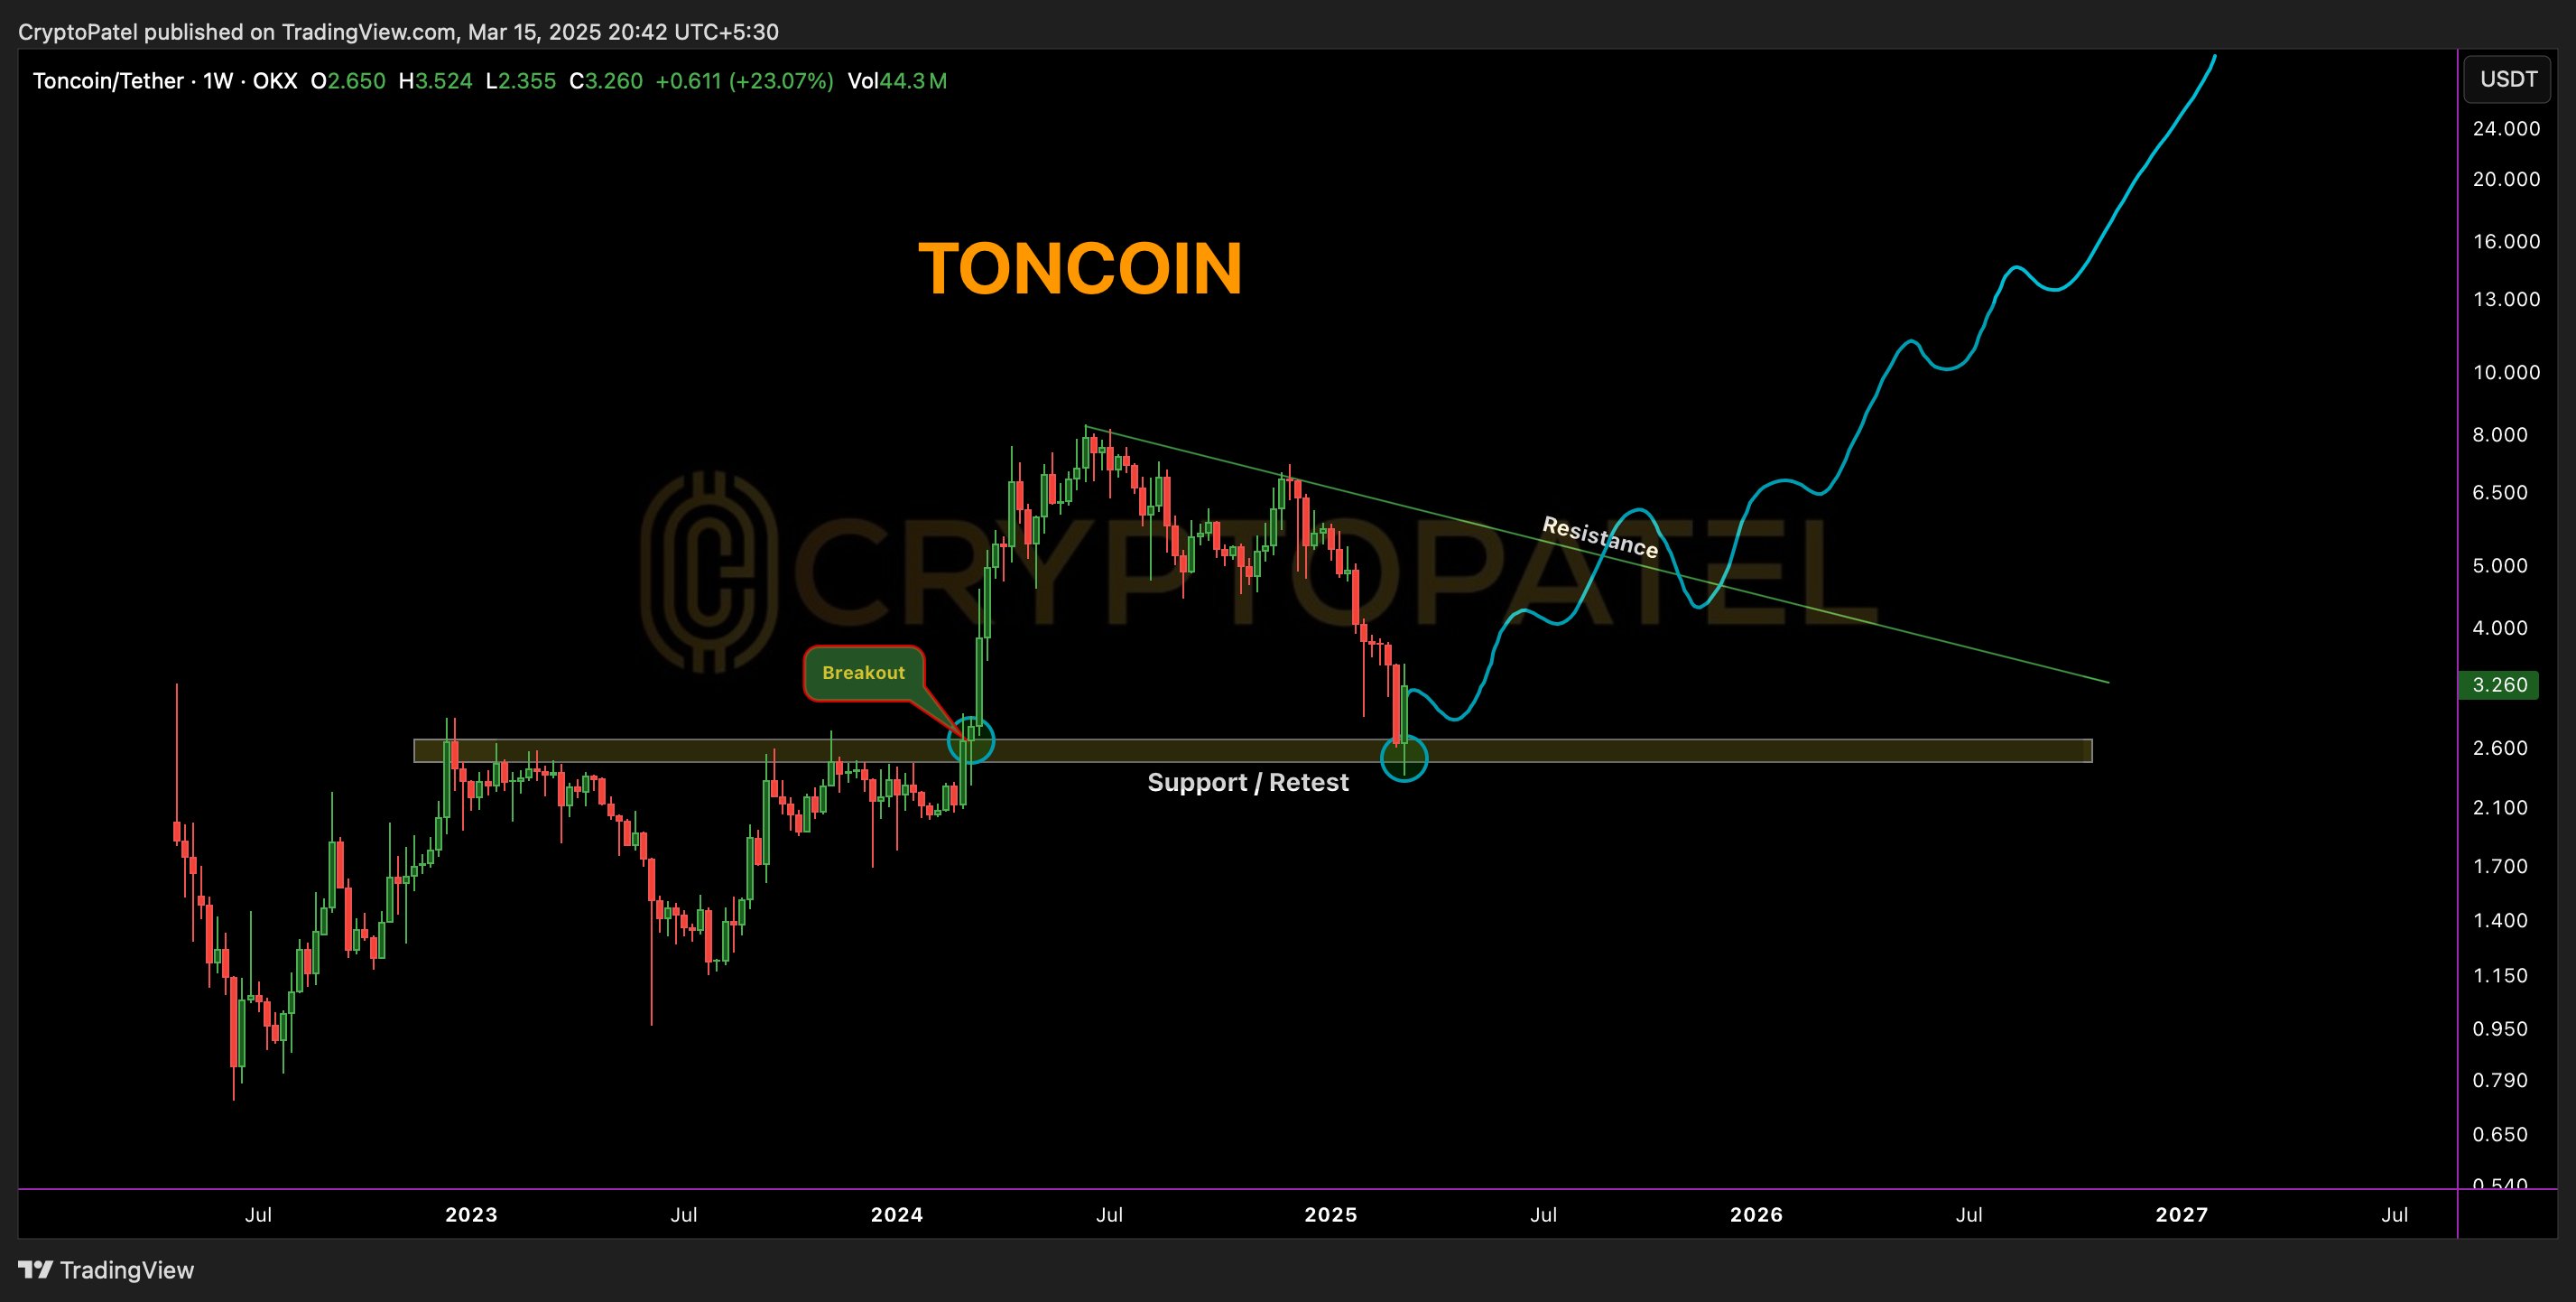
TON/USDT weekly price chart. Source: TradingView/Crypto Patel
If a decisive rebound occurs from the $2.40 to $3.00 range, TON may challenge the current descending trend line resistance in the coming weeks, potentially pushing its price to $5 in June or July.
This bullish expectation aligns with the descending wedge pattern pointed out by analyst Profit Mind. Profit Mind anticipates that if TON's price breaks above the upper trend line of the wedge, it will target an upward movement towards $6.
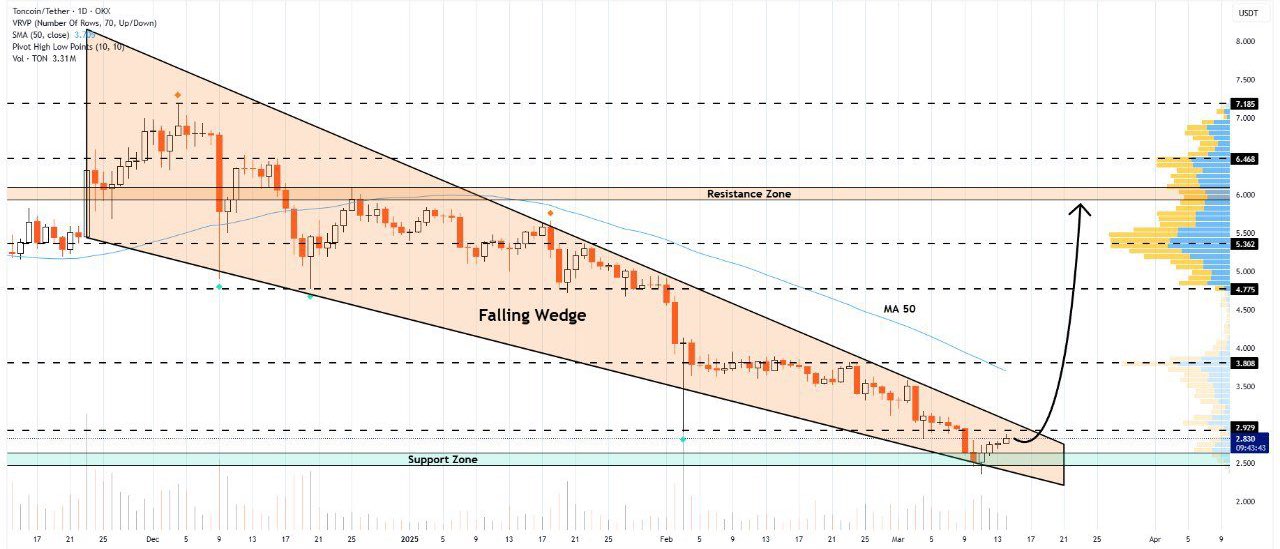
TON/USDT daily price chart. Source: TradingView
Typically, a descending wedge pattern is confirmed when the price breaks above the upper trend line and rises to the maximum height of that pattern.
Analyst Crypto Billion further predicts a bullish reversal in the TON market, noting that TON's relative strength index (RSI) is in an oversold state, which is a major driving factor for potential long-term accumulation.
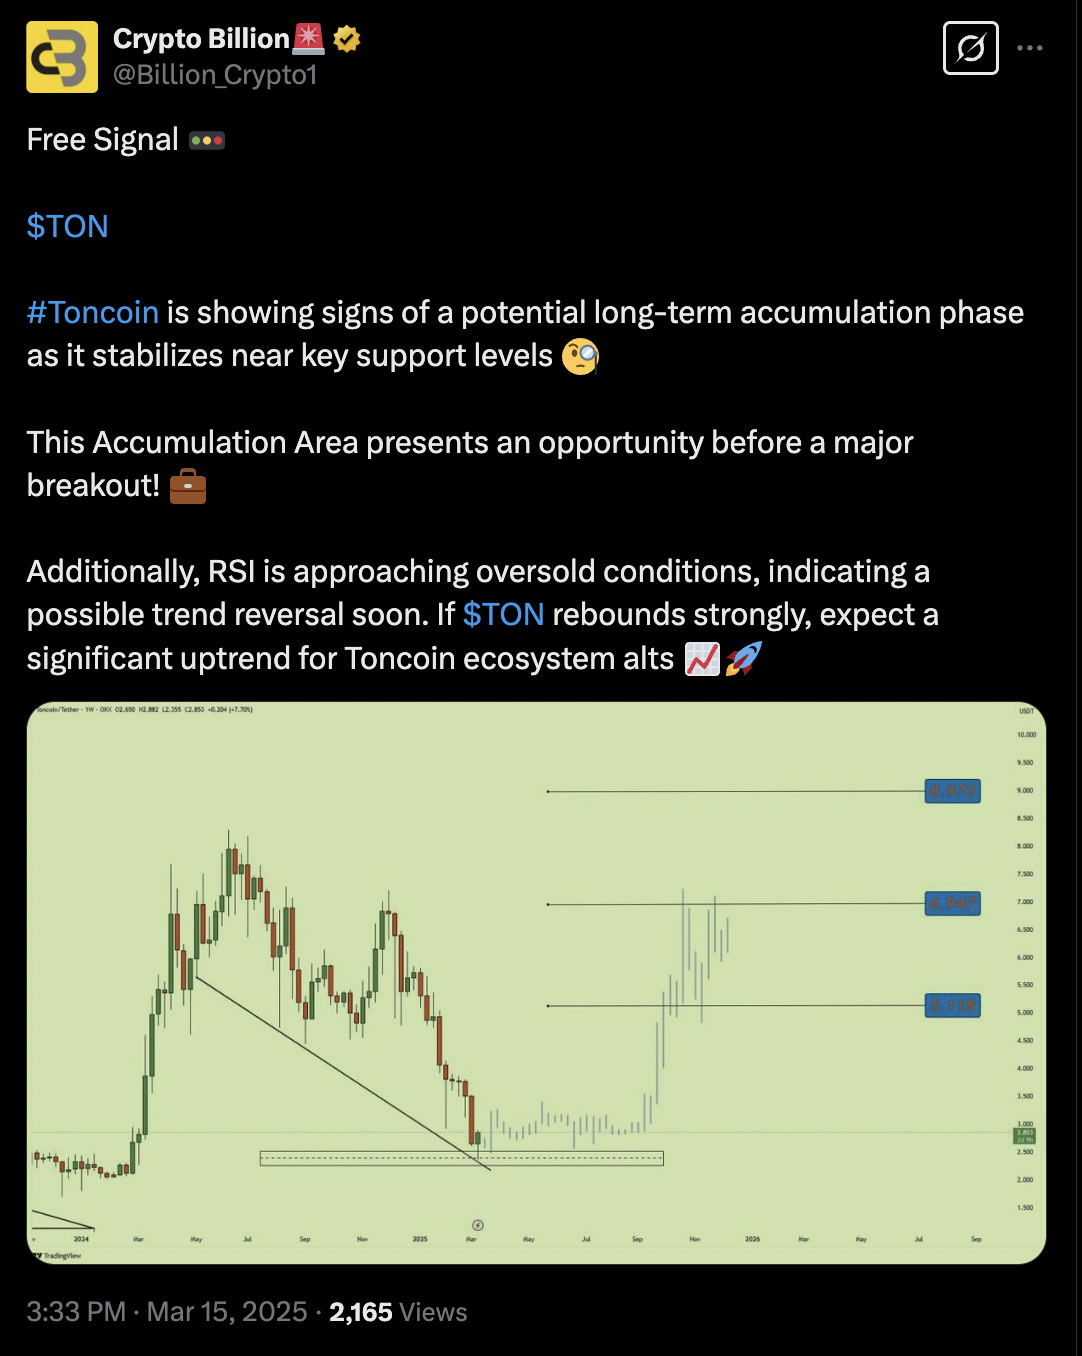
Source: Crypto Billion
Toncoin’s Sharpe ratio (a financial metric used to measure risk-adjusted returns) further indicates that the TON market is currently in an oversold state.
As of March 16, the 180-day average Sharpe ratio has dropped below -25, as indicated by the blue mark. Historically, when TON's Sharpe ratio turns blue, its price often experiences a bullish reversal, as seen at the end of 2022 and mid-2023.
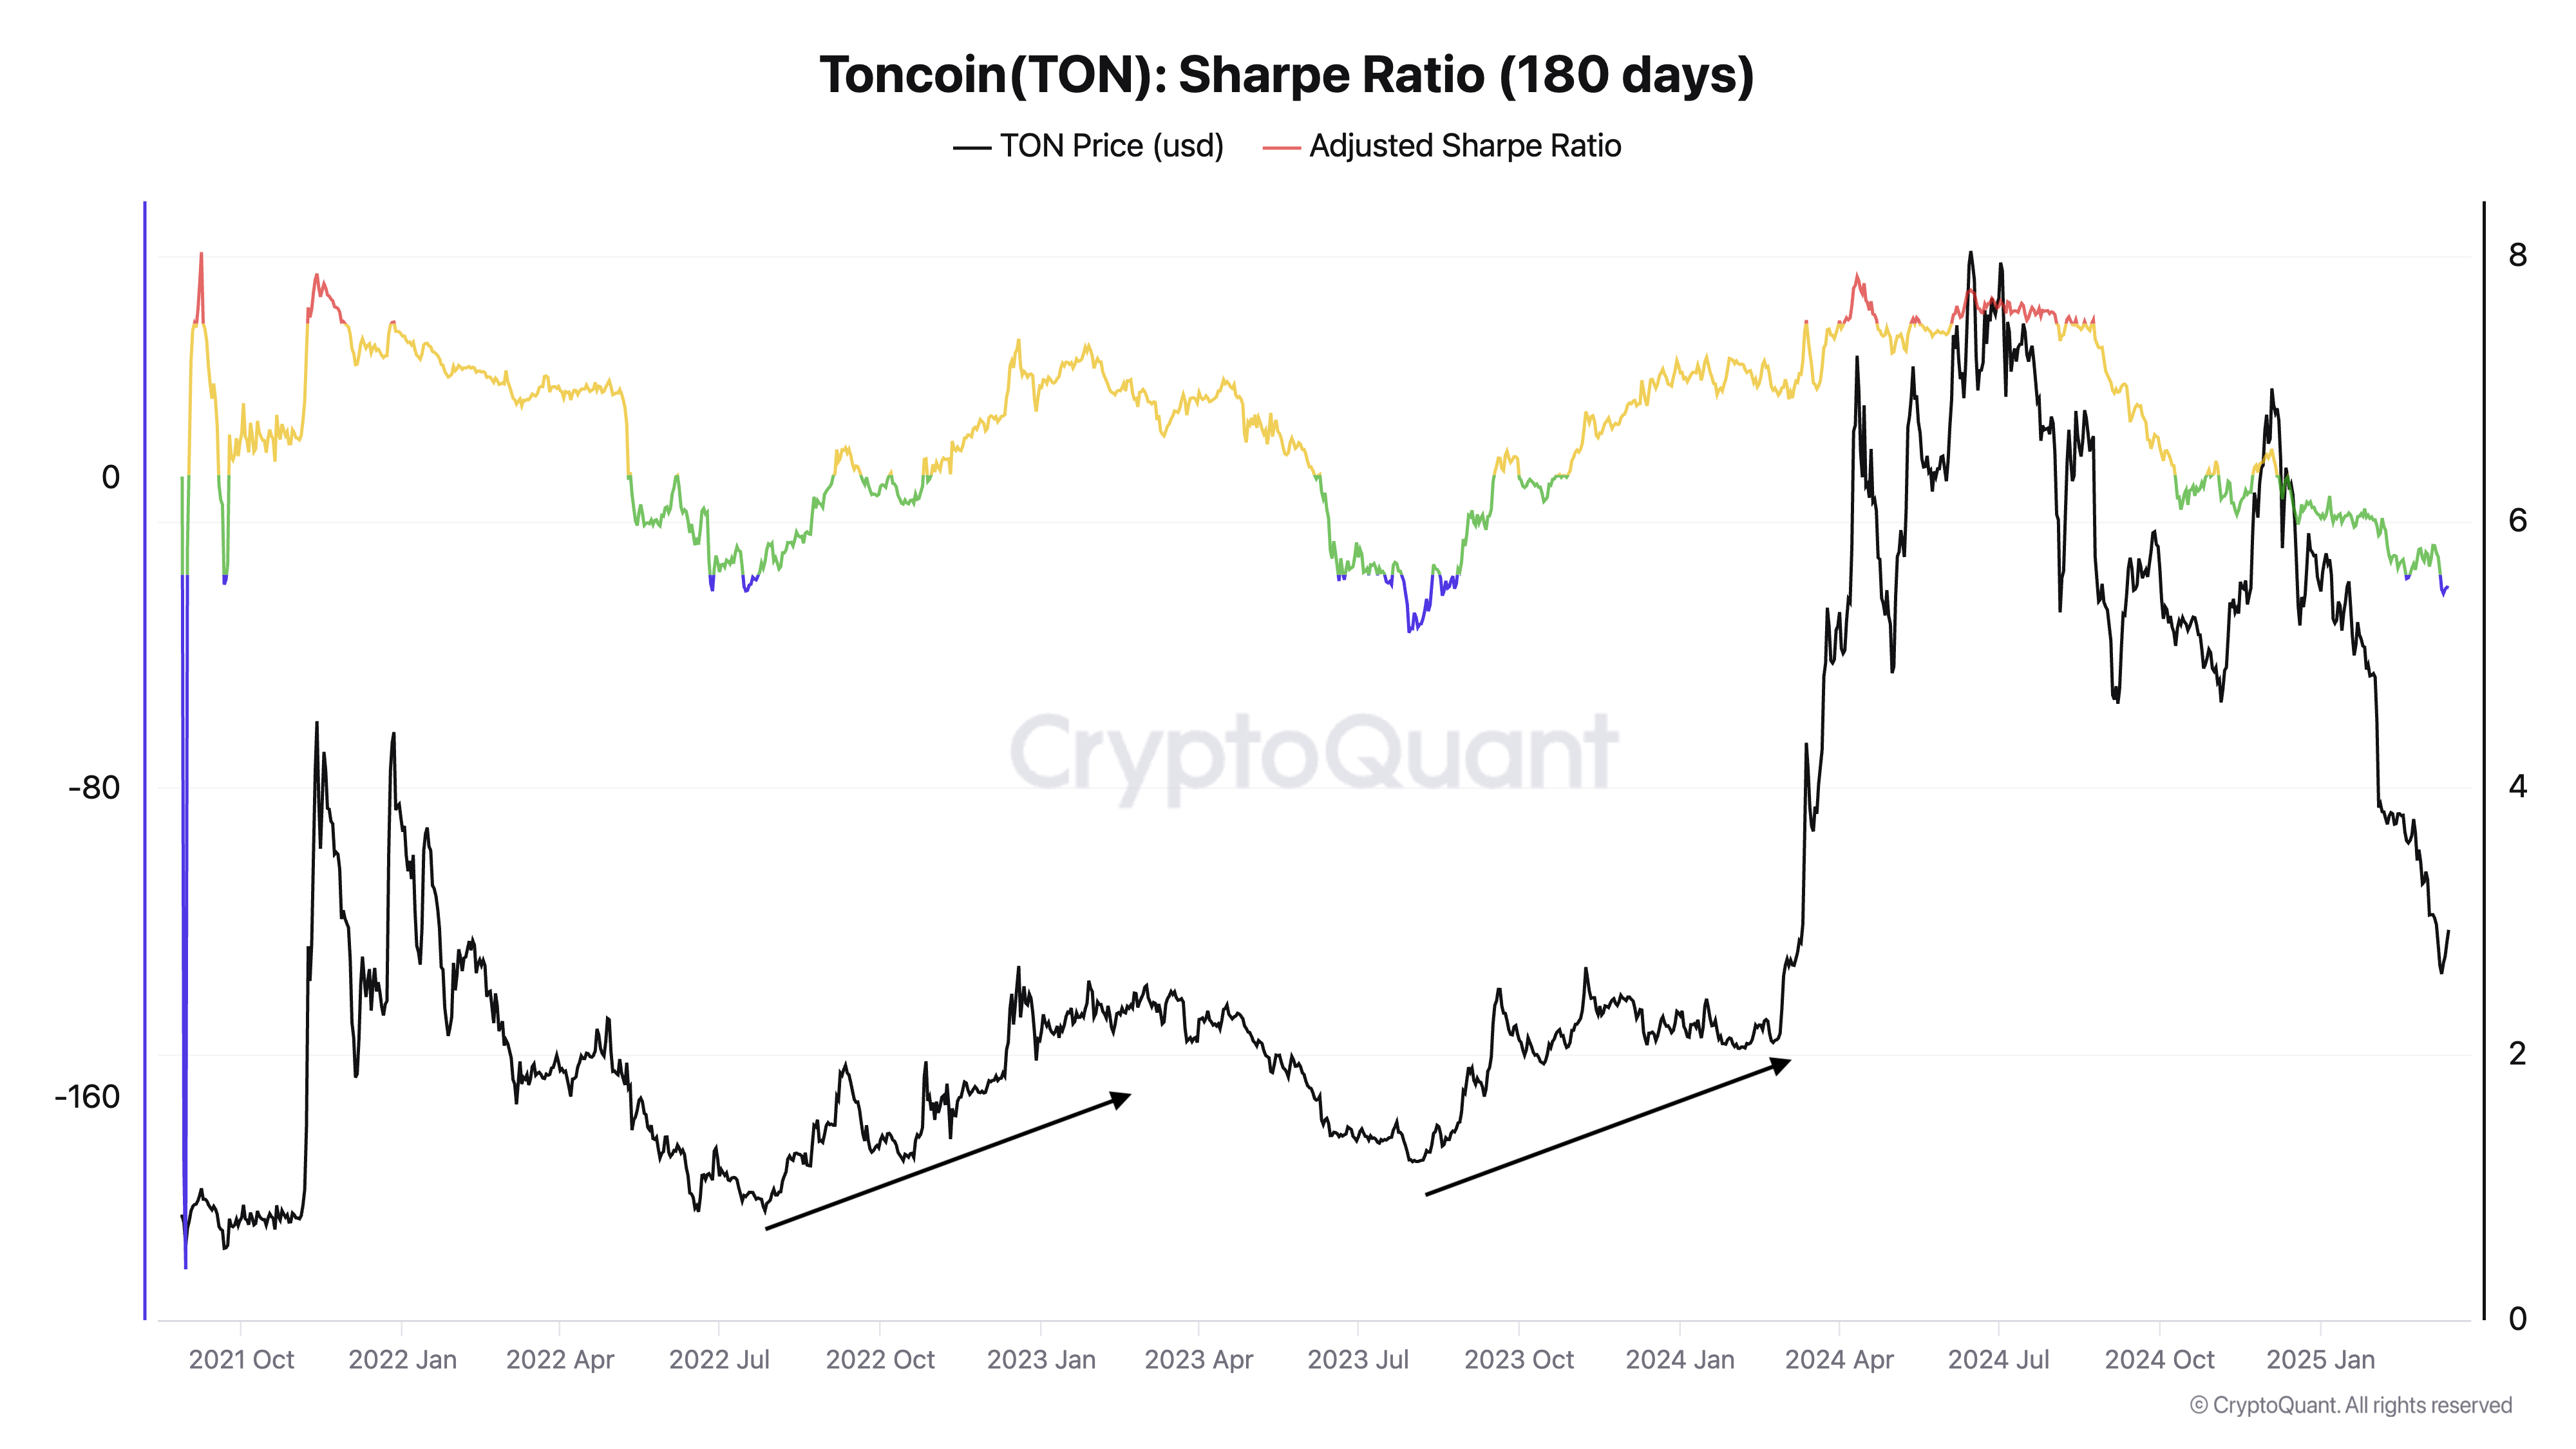
TON Sharpe ratio (180 days). Source: CryptoQuant
TON shorts still dominate the market
In the derivatives market, the open interest (OI, a metric tracking the total number of unsettled TON contracts such as options and futures) for Toncoin is on the rise.
As of March 16, TON's open interest was approximately $169.12 million, up from $80.75 million just five days prior.

TON futures open interest and funding rate. Source: CoinGlass
On the other hand, TON's weekly funding rate hovers around negative values—after plummeting to -0.678% earlier on March 16, it has slightly rebounded into positive territory.
When the funding rate is negative and open interest is rising, it typically reflects bearish sentiment in the market, with active short trading. According to Bybit's 30-day liquidation chart tracking TON/USDT, if Toncoin's price drops to $2.54, it will face nearly $10 million in liquidation risk for long positions.
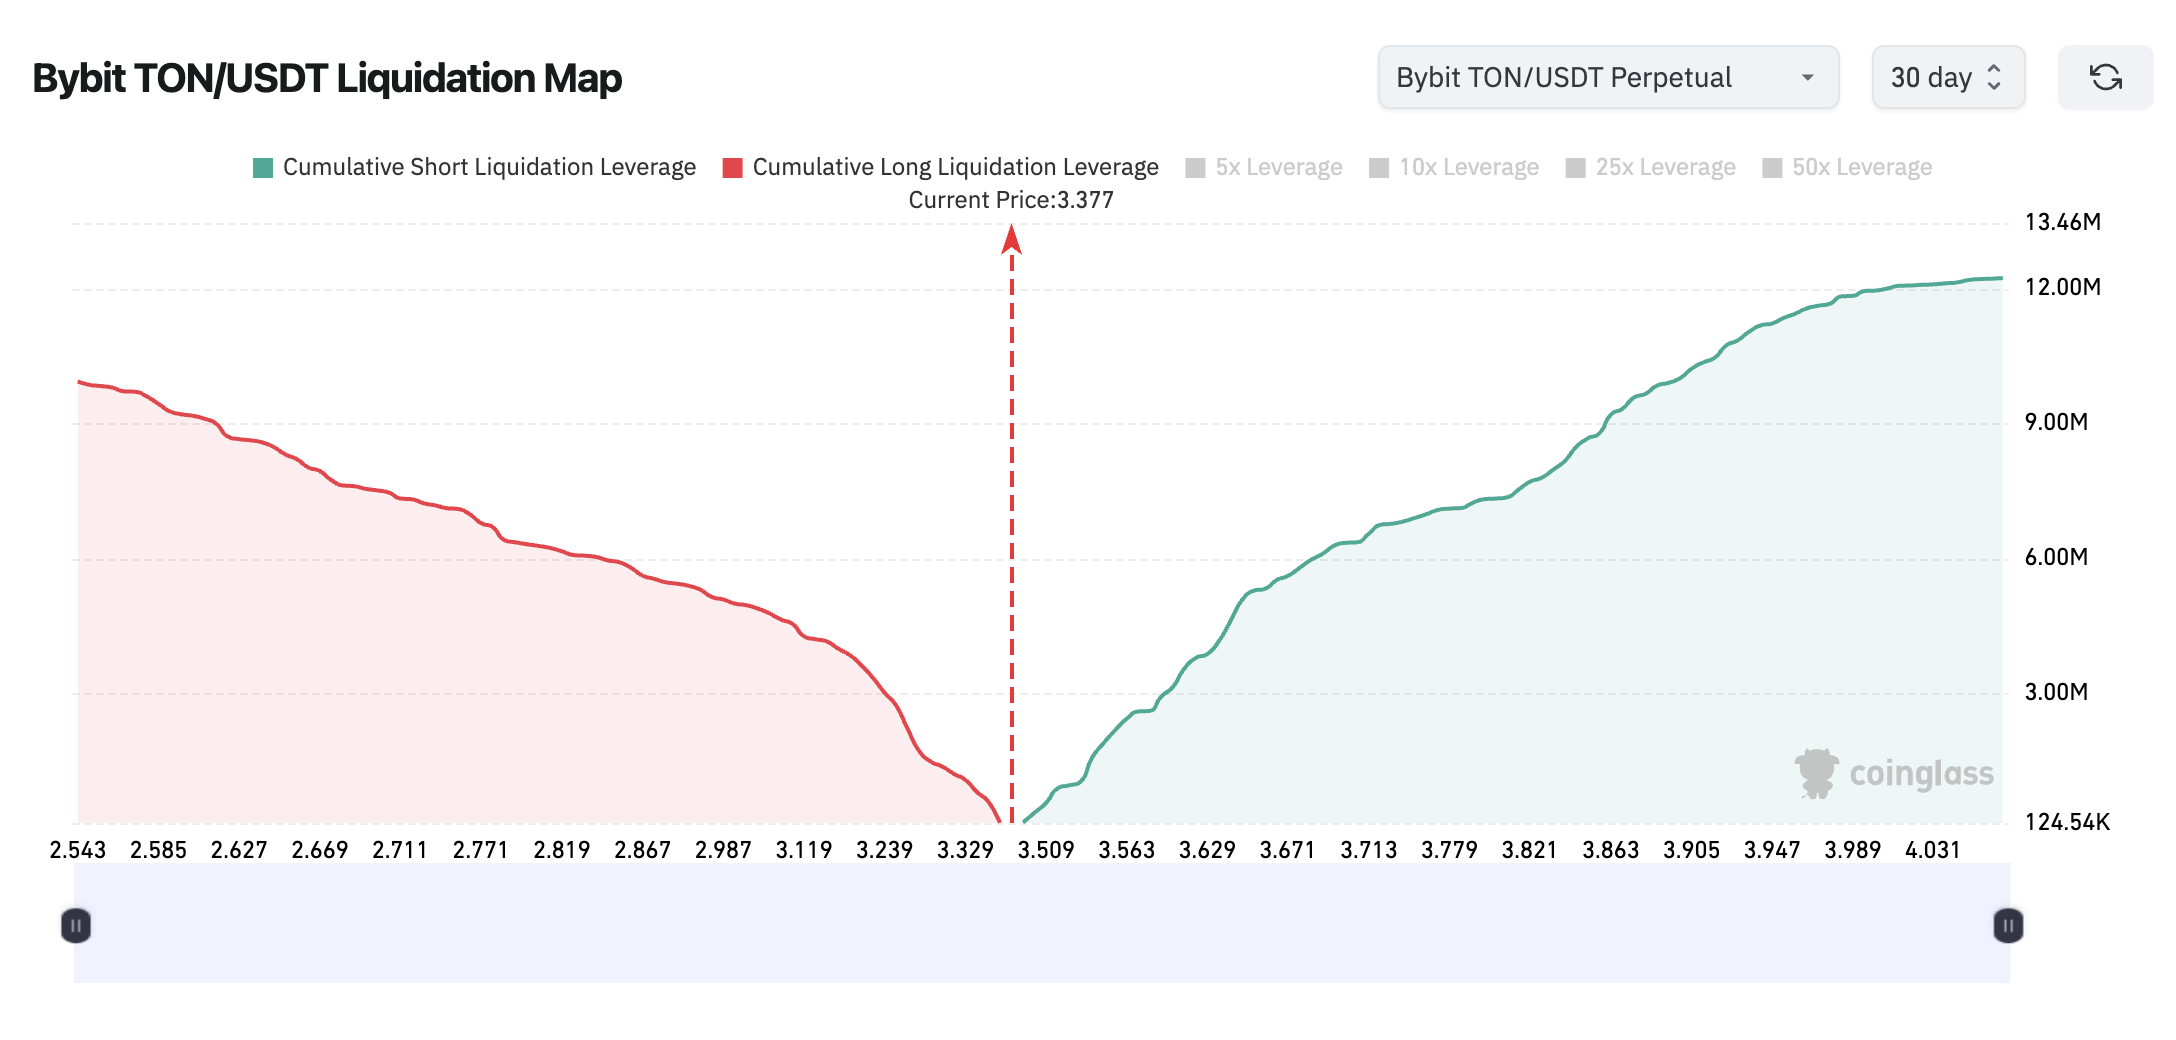
Bybit platform TON/USDT 30-day liquidation chart (as of March 16). Source: Coinglass
Conversely, the same liquidation chart indicates that if TON's price breaks above the $4 mark, approximately $12 million in short positions may be at risk.
If this occurs, the chain reaction of forced buybacks could accelerate Toncoin's upward momentum, pushing its price to the expected levels mentioned above.
This article does not contain investment advice or recommendations. Every investment and trading operation carries risks, and readers should conduct their own research when making decisions.
Related: Telegram wallet to list 50 tokens and launch yield program
免责声明:本文章仅代表作者个人观点,不代表本平台的立场和观点。本文章仅供信息分享,不构成对任何人的任何投资建议。用户与作者之间的任何争议,与本平台无关。如网页中刊载的文章或图片涉及侵权,请提供相关的权利证明和身份证明发送邮件到support@aicoin.com,本平台相关工作人员将会进行核查。


