
The weekly candlestick for Bitcoin shows a doji pattern, indicating that the rebound strength remains weak. The daily chart has rebounded for a week but still hasn't effectively reclaimed the MA200, and is also being suppressed by the MA20, suggesting a narrow range of fluctuations in the short term. Attention should be paid to the possibility of forming a triple bottom before any rebound.
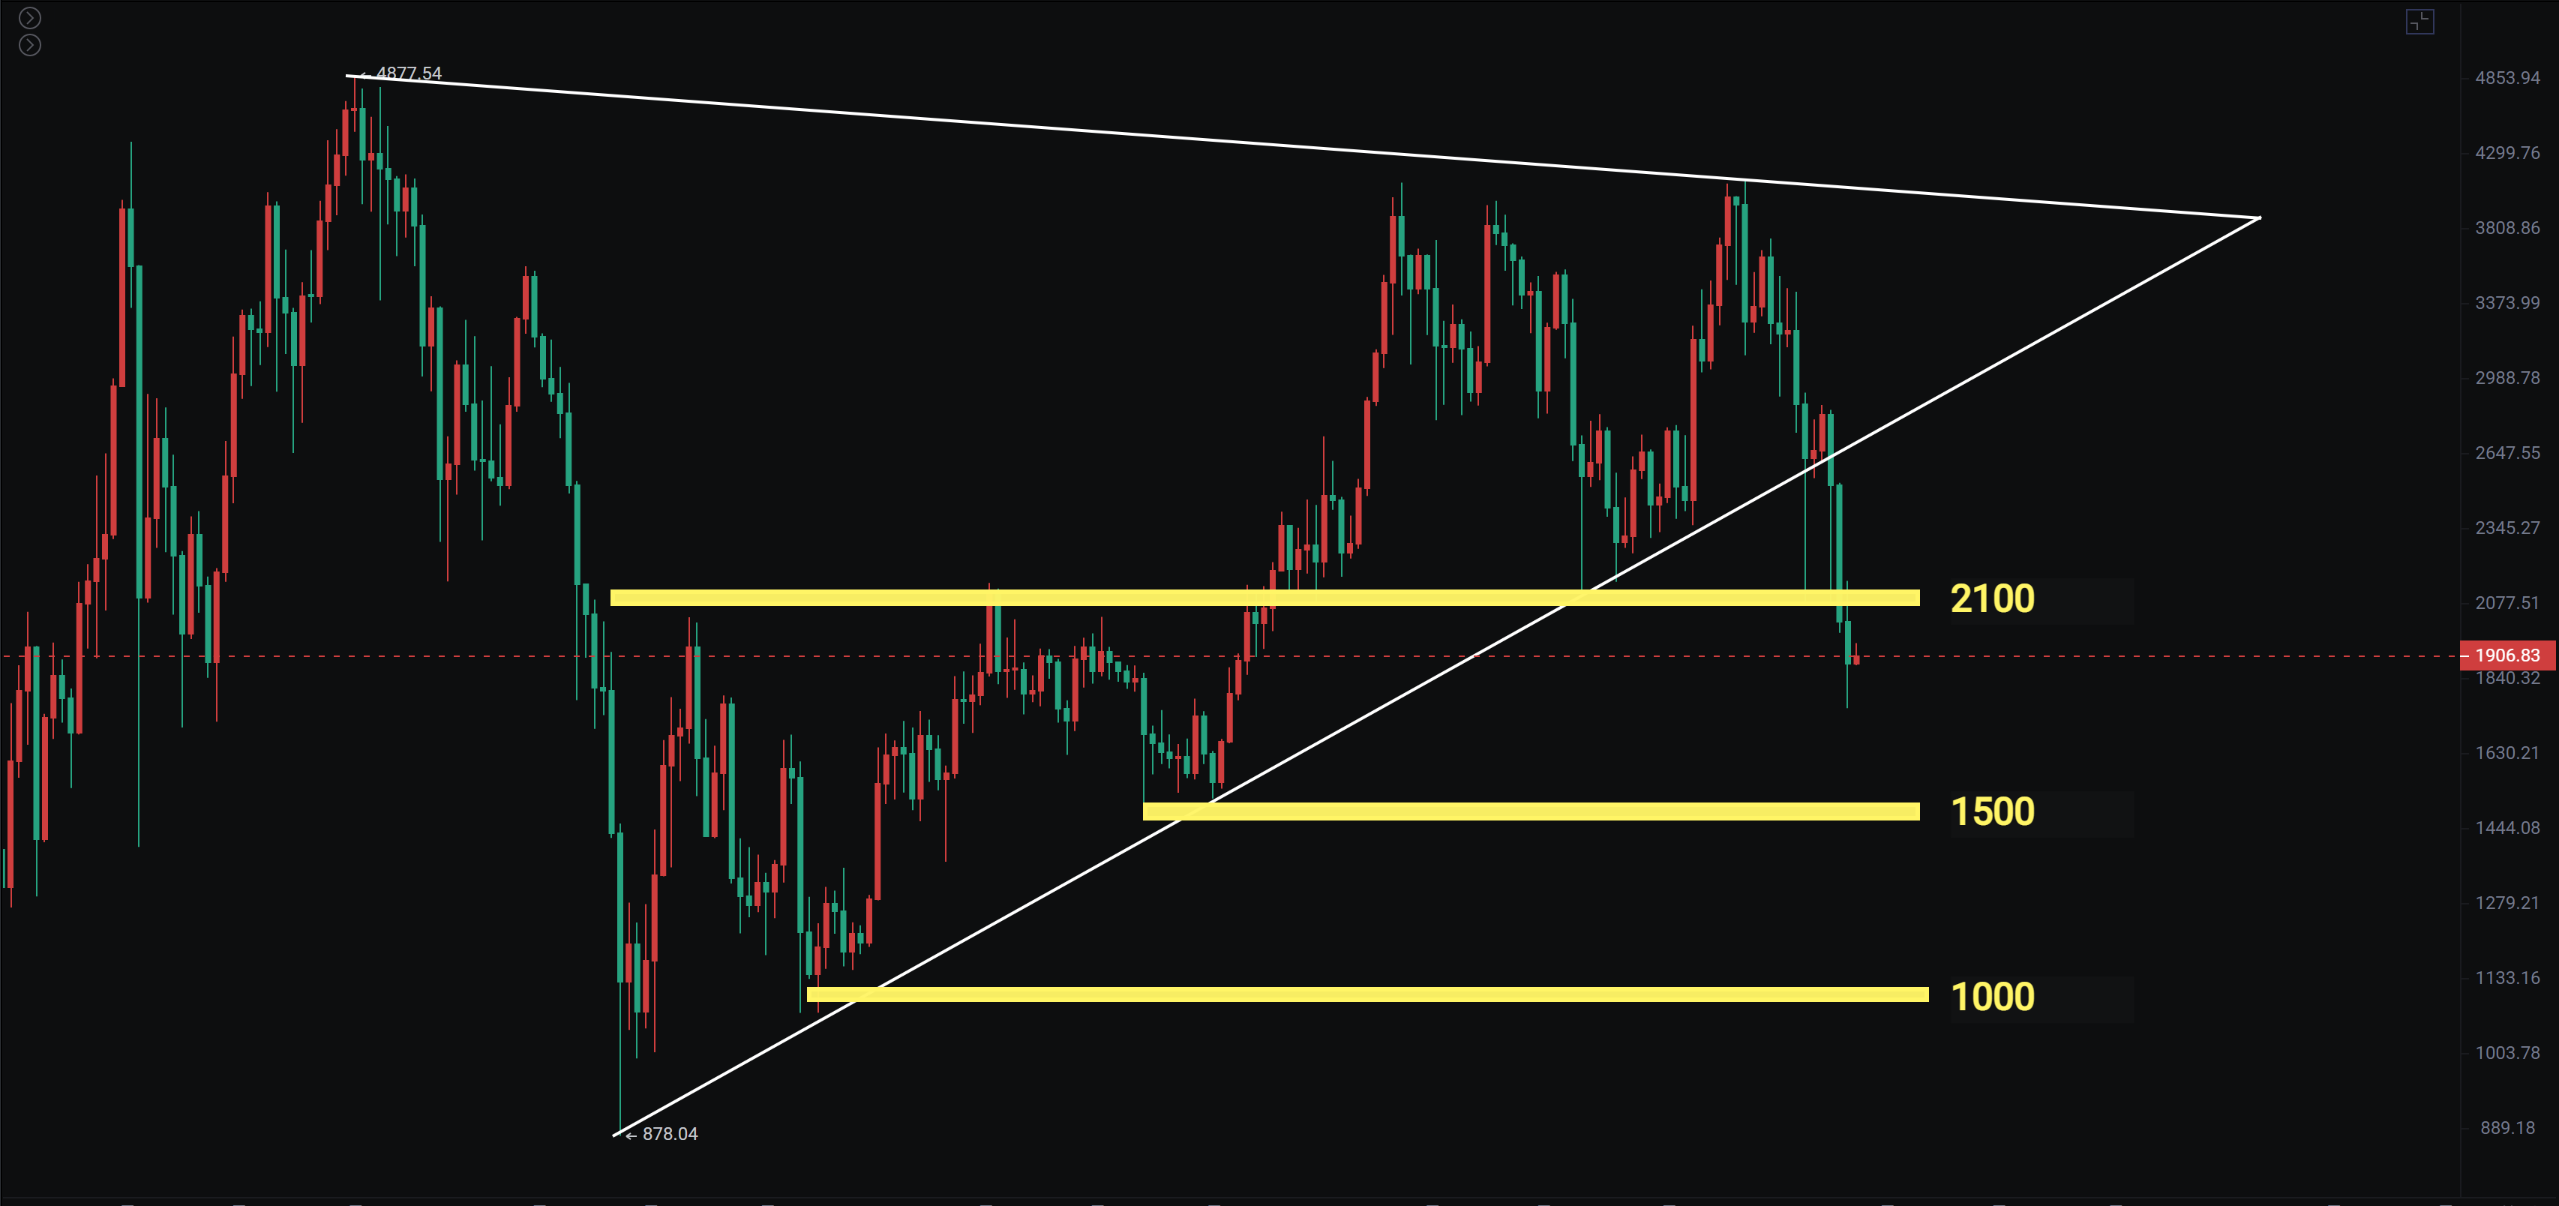
Ethereum's weekly chart has completely broken below the 2100 support level from the previous platform. Currently, the rebound strength is even weaker, while some altcoins are showing relatively good rebounds.
The three major U.S. stock indices have touched the MA60 on the weekly chart and have rebounded. We will first observe whether this rebound will test the previous upward trend before continuing to decline.
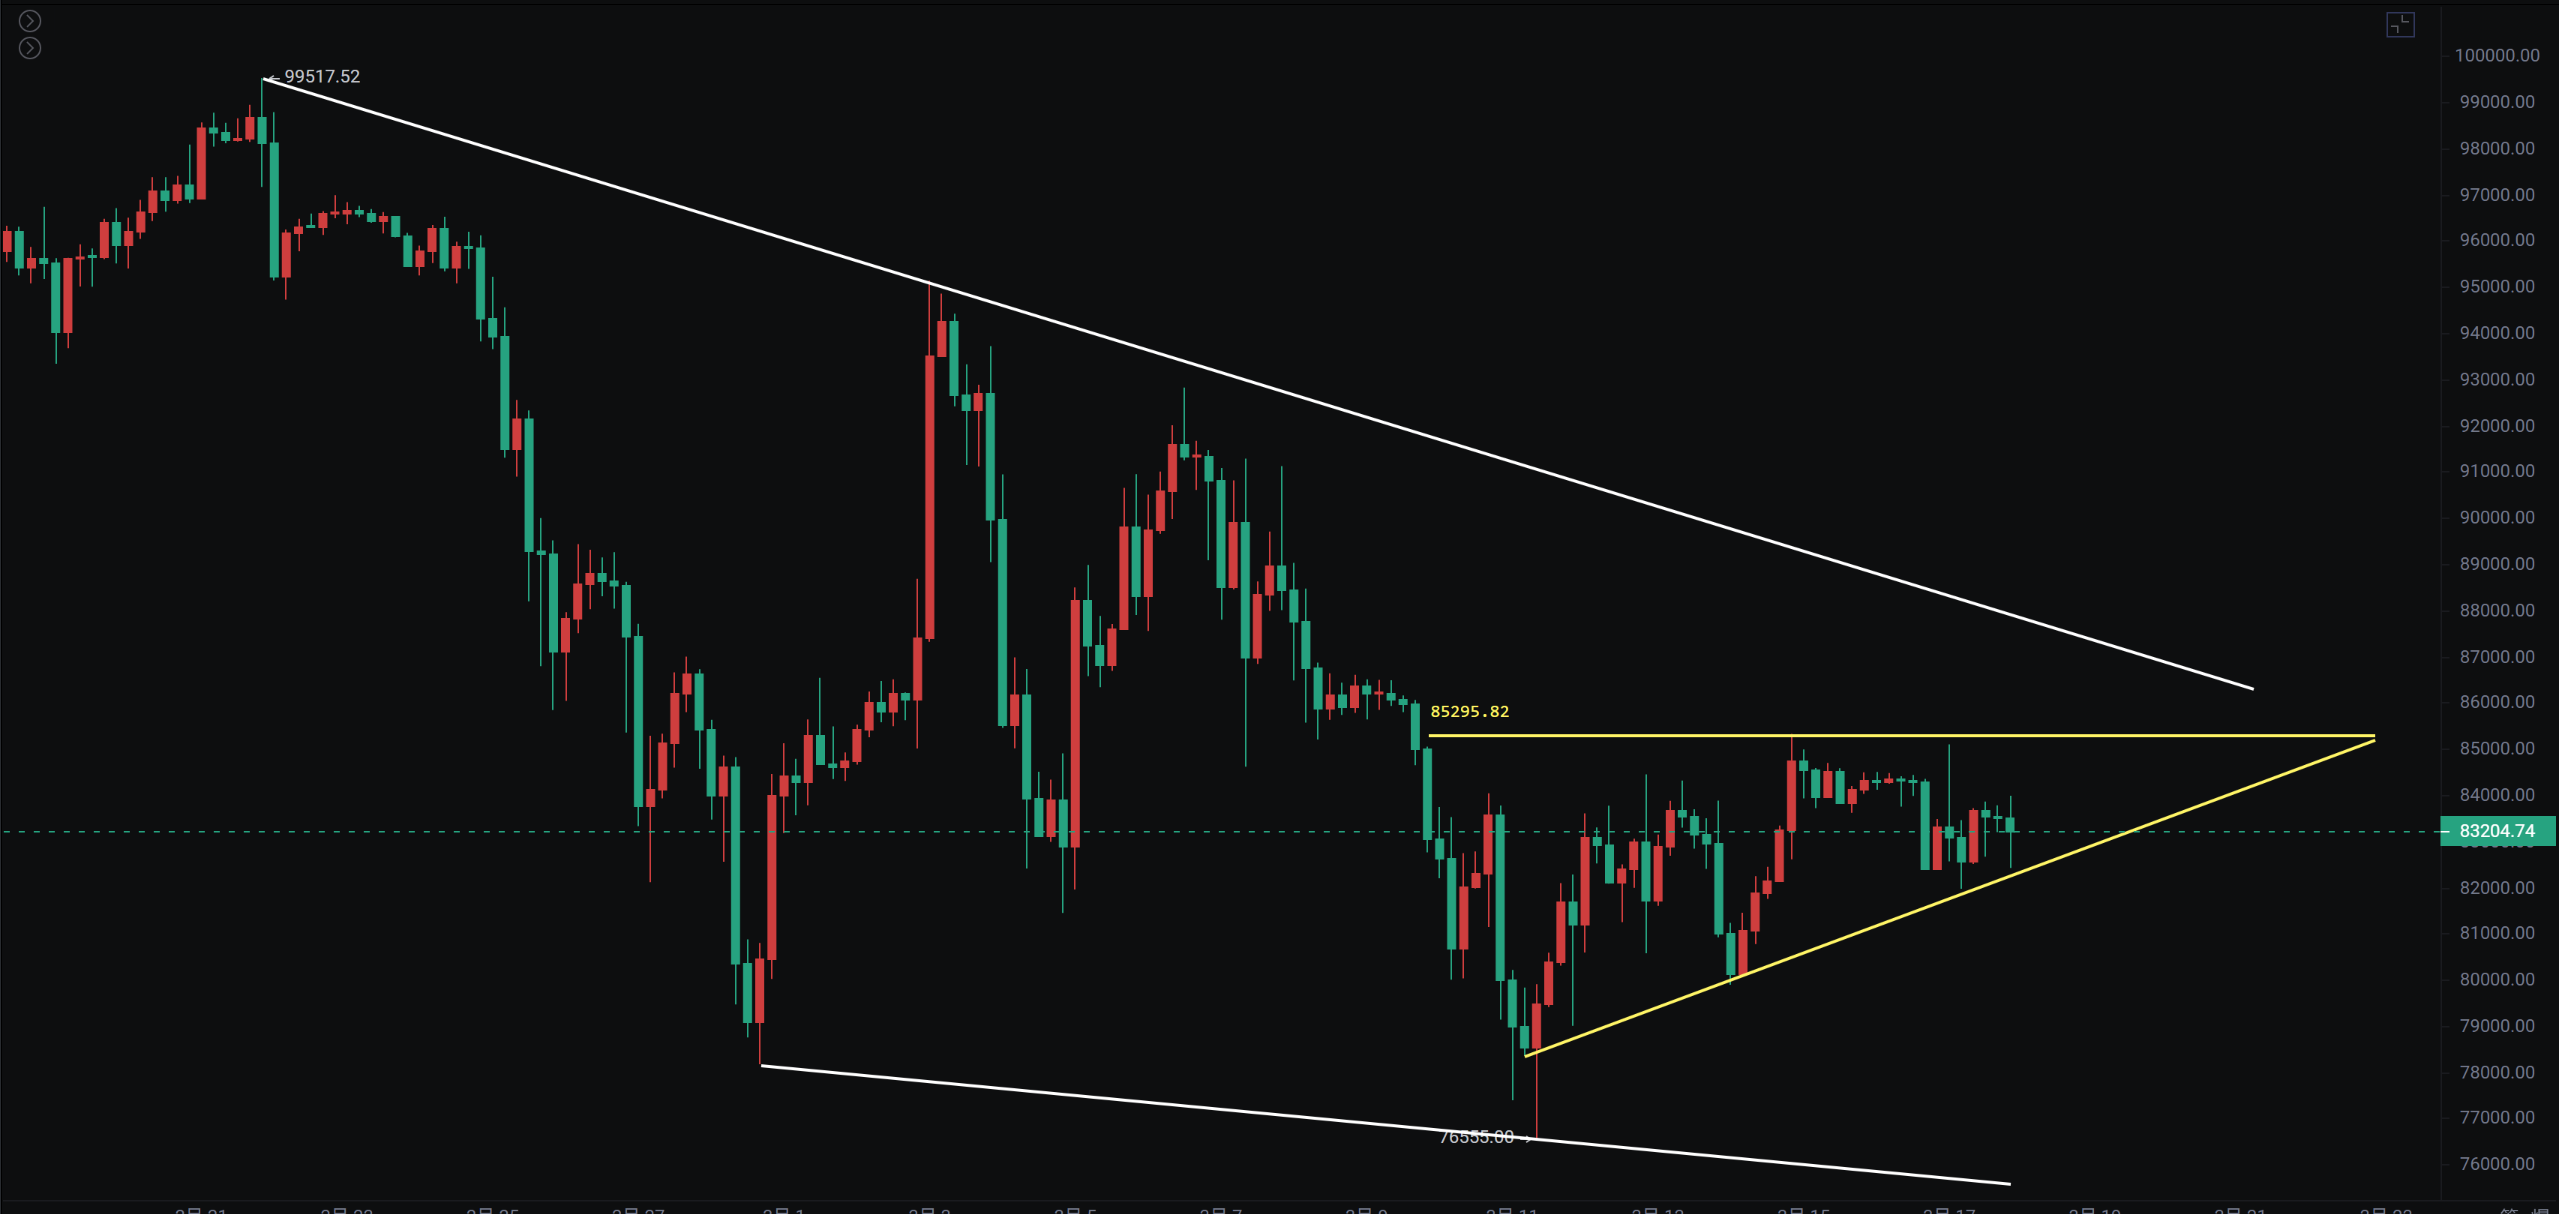
Bitcoin
Previously, it was thought that the head and shoulders bottom pattern had a chance to break upward, but the last three rebounds have still not broken through the 0.382 level. The daily chart is rebounding below the MA200, so attention should be paid to the breakout situation of the 4-hour converging triangle.
Support:
Resistance:
Ethereum
The weekly chart has broken below the 2100 support level and the rebound has not been reclaimed, so the risk of further decline remains. The recent rebound is too weak, so we still need to see if the U.S. market's rebound will be strong.
In the altcoin sector: Cake and BAKE are leading the gains, with the BNB chain experiencing a general rise.
If you like my views, please like, comment, and share. Let's navigate through the bull and bear markets together!!!
This article is time-sensitive and for reference only, with real-time updates.
Focusing on K-line technical research, sharing global investment opportunities. Public account: Trading Prince Fusu

免责声明:本文章仅代表作者个人观点,不代表本平台的立场和观点。本文章仅供信息分享,不构成对任何人的任何投资建议。用户与作者之间的任何争议,与本平台无关。如网页中刊载的文章或图片涉及侵权,请提供相关的权利证明和身份证明发送邮件到support@aicoin.com,本平台相关工作人员将会进行核查。


