Author: ltrd
Translation: Tim, PANews
OM (Mantra) experienced a nearly 95% drop in a single day amidst a series of highly unusual and closely watched market events. I have gathered information from multiple sources and carefully examined the relevant data. In the following article analysis, I will gradually outline the possible reasons behind this crash.
I will explain:
- Why OKX is not the source of this sell-off (despite this being the initial accusation I heard)?
- Why are some people selling OM tokens as if it were the end of the world?
- Why might a wallet that started staking OM 448 days ago be directly related to this event?
In the first part, we will focus on the market microstructure and how to properly analyze such events. Then, I will outline how the entire situation may have unfolded and which roles may have played a key part.
It must be made clear that:
- This sell-off is by no means "ordinary," even in the cryptocurrency market.
- Its scale and chaos have, in my view, pushed several market participants to the brink of liquidation. This is evident in the order book data and capital flows.
- Additionally, this is just my personal understanding of the events. These are not formal accusations, nor do I expect you to take anything stated here as absolute truth.
Aside from—perhaps only a few insiders—no one knows exactly what happened.
I hope you can read my content with a critical mindset. If you find any inconsistencies in my logic or analysis, please be sure to point them out. I share this out of goodwill, aiming to demonstrate how to handle complex trading events. Of course, I also enjoy it.
Overview of the OM Crash Event
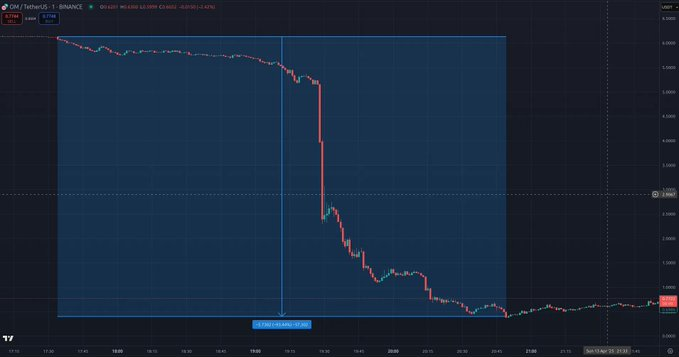
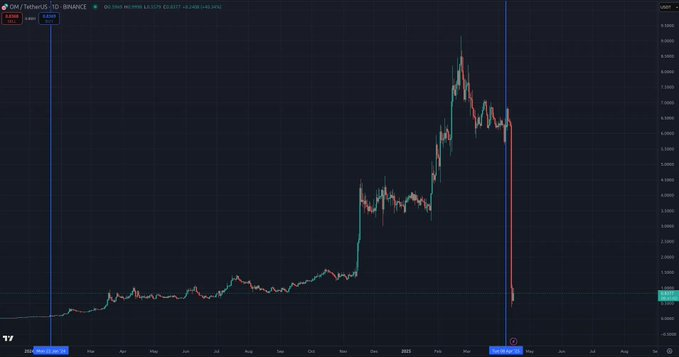
Around 19:30 (UTC) on April 14, the OM token faced a massive sell-off, having been listed on almost all major exchanges, including perpetual contract markets. It is important to note the existence of its perpetual contract market as a significant detail.
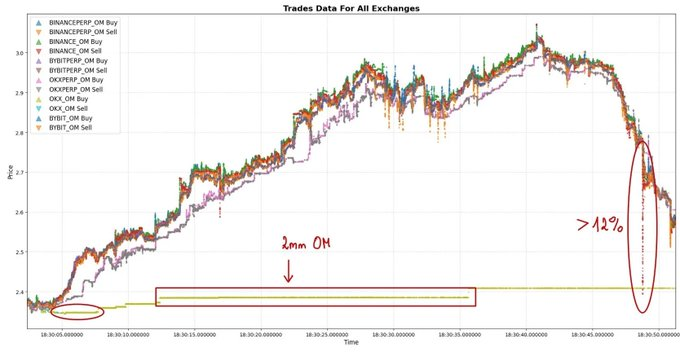
Before the crash, OM was ranked among the top 25 cryptocurrencies by market capitalization. However, within just a few hours, its price plummeted by about 95%, with nearly a 90% drop occurring in just one hour.
Such volatility is astonishing even for low-market-cap altcoins outside the top 2000, let alone for a coin ranked in the top 25.
Market Microstructure: Finding the Source of the Sell-off
We will primarily focus on the critical few minutes during the crash. Next, I will analyze a three-minute period, which I have divided into three parts for clarity.
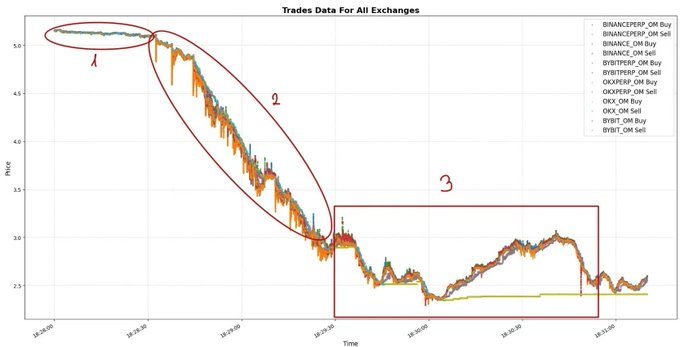
In the first phase, there was slight but notable selling pressure in the market. This pressure was mainly concentrated in the perpetual contract markets of Binance and Bybit, as these platforms provide the most convenient shorting channels for traders.
Keep in mind: you do not need to hold the underlying asset to create selling pressure. Perpetual contracts are actually a better option for large directional investments due to their high liquidity and leverage characteristics.
The second step is crucial, as it determines the significance of the entire event, so let’s analyze it closely.
First, from a macro perspective:
Although Binance's perpetual contracts have the deepest liquidity in the market, the market impact they cause (i.e., the price volatility triggered by a single market order) far exceeds that of any other exchange.
This phenomenon conveys key information:
The main capital orchestrating this round of sell-off is primarily active in the Binance perpetual contract market.
Why is this so? There may be two reasons:
- Every round of price fluctuation is initiated by Binance's perpetual contracts, in fact, this platform always leads market movements (which will be detailed later);
- Even with deep liquidity support, large market orders still trigger severe price shocks, causing other market participants to be unable to react or withdraw their orders in time.
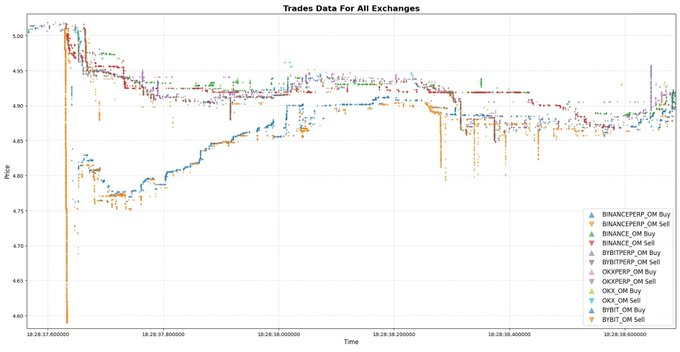
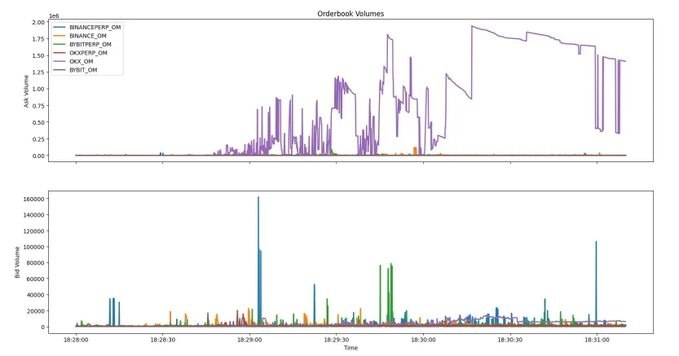
Here is evidence from the micro data level:
This describes a classic case in high-frequency trading. A trader possesses a large-scale shorting ability relative to market liquidity, and we observe trades of approximately $1 million occurring every 5 seconds during specific time intervals (18:29:00, 18:29:10, 18:29:15), which clearly reflects the characteristics of institutional-level high-frequency trading strategies.
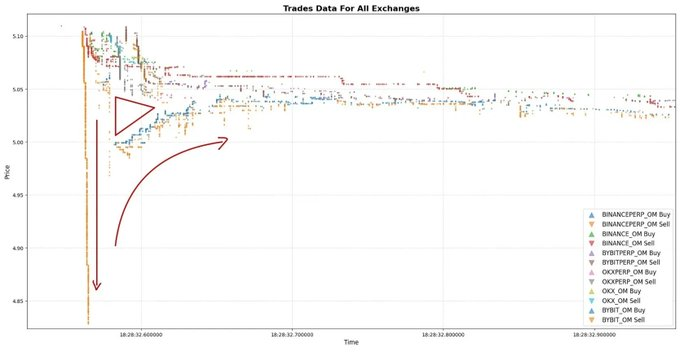
Now, the situation is: a well-capitalized market participant is frantically shorting OM tokens, as if the apocalypse is near. Clearly, each market sell order triggers a massive market impact (about 5% volatility), but this impact is only temporary, merely the immediate price effect of the trade moment.
Subsequently, the market will return to a short-term price equilibrium. This process will create a liquidity gap between exchanges (presenting a triangular shape), where the transaction price on one trading platform is significantly lower than the market fair price.
This is why, after each large market order on the Binance perpetual contract market, most of the capital flow is merely the market re-seeking equilibrium or transmitting price signals to other exchanges.
Even if there is generally strong selling pressure in the market, there is only one true driving force: someone is controlling every tiny fluctuation of OM on the Binance perpetual contract (which isn’t so “tiny” after all).
We have seen many similar situations. As you can see, this pattern is almost identical: Binance perpetual contracts act first, followed by other exchanges.
We encounter huge instantaneous market shocks, followed by liquidity gaps, ultimately forming short-term equilibrium.
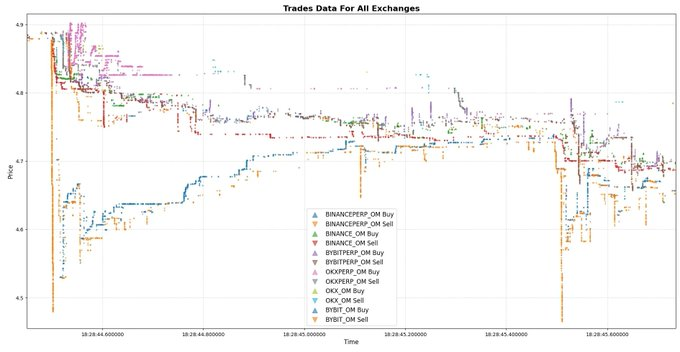
Once again, the same pattern occurred. I hope you enjoy these types of charts as much as I do; honestly, every time I see such works, it truly stirs my heart. This is pure art.
After a series of similar events, nearly 4 million OM tokens were shorted in a completely unprofessional, dirty, and chaotic manner. This attack was clearly well-planned, as its operational mode was rapid, brutal, and completely cost-ignorant.
But then, things started to get strange.
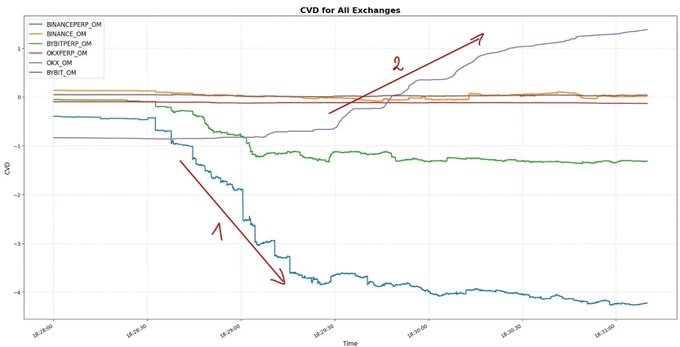
On our cumulative volume delta (CVD) screen, we can see that the OM token position delta on Binance perpetual contracts is -4 million, while on OKX (after the Binance price hit bottom), its CVD continued to rise.
Unfortunately, at this point, the data from these exchanges began to mislead. Not just you, many very smart analysts were also misled.
This is exactly what I mentioned on Twitter today; drawing clear conclusions from trading data is extremely difficult. This data is almost always incomplete. You cannot know who the market participants are, nor their intentions. You only see the surface, and your analysis is as close to the truth as possible.
At this moment, I can confidently tell you: within the next 120 seconds, a user on OKX will initiate an unprecedented crazy sell-off. The ferocity of this sell-off will likely exceed your cognitive boundaries.
Buckle up; what happens next will be even more thrilling!
Let’s look at the third part of the initial plot.
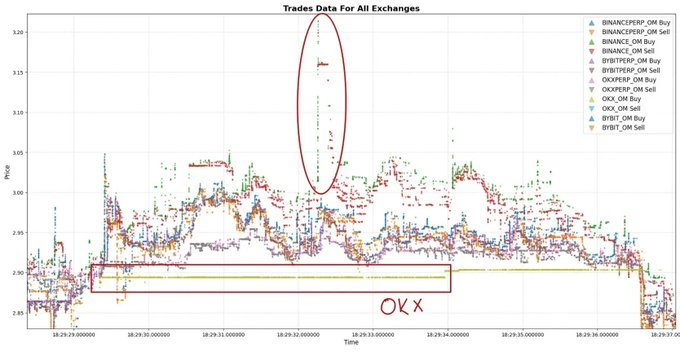
One minute after the OM sell-off began, the price had already dropped by 50% from the starting point, and at that moment, suddenly someone appeared out of nowhere, let’s temporarily call them the “OKX OM Whale.”
This "whale" began placing market sell limit orders a few percentage points below the top of the order book. In an instant, the transaction price on the OKX exchange was significantly lower than on other platforms.
You already know the reason, right? A massive limit sell order is currently hanging: millions of OM tokens are waiting to be sold.
This is why the CVD shows a positive value, not because the market is buying frantically, but because one participant is selling heavily, while others are taking the opportunity to arbitrage. They are buying on the OKX spot market while shorting on the perpetual contract market or other spot platforms for hedging.
Even on the OKX exchange, a single limit order of 2 million OM kept the price stable for a full minute. And this is the only reason you see the CVD showing a positive trend.
This is not because people are buying frantically, but because some (most likely just one) market participant sold all the assets they could sell.
You can check the order volume of the top 10 levels on the order books of each exchange here.
Noticed all the anomalies?
Yes, the selling side is always OKX.
Now there are only two possibilities left:
- Either this market participant was forced to sell (otherwise they would face serious trouble)
- Or they are fully aware of the market trend and realize it is time to liquidate
These executable limit orders do not appear to be pre-planned, nor are they executed algorithmically.
It feels like a decision made in haste within the first minute of the sell-off, and the decision-maker had no other choice.
What is the second possibility?
They were already well aware of the inside story of OM. When they saw such a massive wave of sell-offs, they immediately realized the crash had begun and rushed to escape while they still could.
"But how could such a thing happen?"
There are some speculations circulating on the X platform. One particularly noteworthy claim is that the OM project team allegedly encouraged certain trading firms to use OM tokens as collateral to provide them with USDT loans.
How does this claim fit into the "death spiral" script?
Imagine such an operation:
- Stake OM as collateral, you borrow USDT.
- Deposit the USDT into the Binance exchange.
- Aggressively short OM through perpetual contracts. This method is not sophisticated, but with overwhelming position size, it triggers a market crash and chaos, leading to a chain liquidation.
- Ultimately resulting in the price halving.
This script is entirely plausible.
Am I stating facts? Not necessarily. We have no concrete evidence, only scattered clues and patterned behavioral trajectories.
The OM whale on the OKX platform could be:
- A user forced to sell due to loan terms or risk control red lines.
- A participant in this hunt.
- Or an OTC institution that made a fortune on OM but failed to exit in time, suddenly realizing they must take action as the situation turns dire, and they need to act quickly.
At this moment, the story begins to take a strange turn:
Take a look at this Ethereum wallet: 0xEbb8B59780170833E455b32f57CF03DC440A77D2
It started staking OM tokens 448 days ago and began claiming rewards six days before the market crash.
Let’s look at this chart.
The timing is quite clever. That wallet is associated with multiple transfers and a series of other wallets. But after several intermediary transfers, by tracing a certain link in the chain, we ultimately pinpointed wallet 0xB37D…f26A, which is connected to an account labeled "OKX Deposit Address." For more background information, you can refer to this tweet, which can provide you with key clues.
It is highly likely that this wallet, which started staking 448 days ago and withdrew rewards a few days before the market crash, is actually the same person who frequently placed aggressive market limit orders on the OKX exchange.
We know this well, and Binance is likely fully aware of the mastermind behind this attack.
According to the data, the market participant who was aggressively suppressing the order book on the Binance perpetual contract market is the main driving force behind this avalanche of sell-offs.
That’s all for now.
免责声明:本文章仅代表作者个人观点,不代表本平台的立场和观点。本文章仅供信息分享,不构成对任何人的任何投资建议。用户与作者之间的任何争议,与本平台无关。如网页中刊载的文章或图片涉及侵权,请提供相关的权利证明和身份证明发送邮件到support@aicoin.com,本平台相关工作人员将会进行核查。


