Author: Mr. Beggar, On-chain Data Analyst
I. The Principle of RUP Divergence as a Top Signal
For a detailed introduction to the RUP indicator, please refer to the following two articles:
“On-chain Data Academy (9): Market Barometer RUPL(I) Data Introduction & Bottom Fishing Application”
In today’s article, I will reference a more obvious example to help everyone understand the RUP indicator. Simply put, RUP measures the “current overall unrealized profit status of the market.”
From the perspective of chip holders, the higher the price, the more unrealized profit there is, so this indicator is highly positively correlated with the price trend of $BTC in most cases. Once a “non-highly positive correlation” trend appears, it is a signal worth paying attention to.
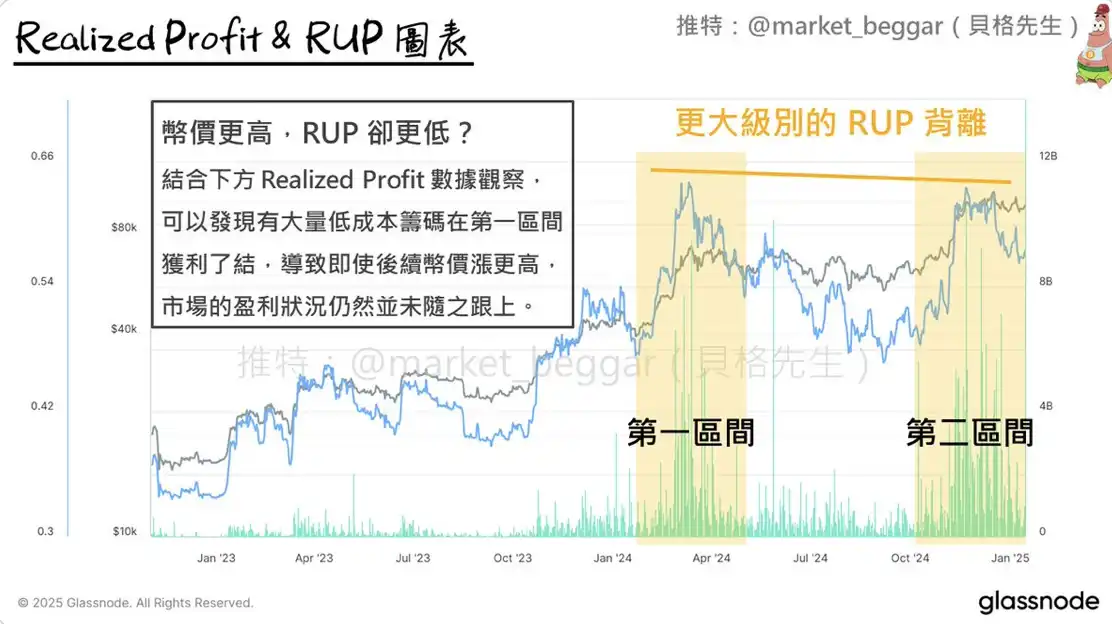
In previous articles, I provided a detailed breakdown of historical cyclical tops from the perspective of RUP. Today, we will observe the RUP of “this cycle” from a more macro perspective. As shown in the image above: I have marked the market conditions after two major upward waves in this cycle, the first being when the price rose and broke through 70,000; the second being when it broke through 100,000.
You will notice: The RUP at 70,000 was actually higher than at 100,000? Why did the RUP not keep up with the higher price? The reasons are as follows:
The main profit group in the market is often low-cost chips.
Low-cost chips have huge profits and account for a large proportion of unrealized profits.
If these low-cost chips are cashed out, it will greatly affect the RUP.
At this point, some readers should have fully understood: As shown in the image, when the price broke through 70,000, a large amount of Realized Profit appeared, indicating that a significant number of low-cost chips had realized profits. This led to the situation where: when the price subsequently rose to a higher position, the RUP did not rise in sync. Related reading resource: The significance of Realized Profit: “On-chain Data Academy (3): Did the Bottom Accumulating Institutions Take Profits?”
You may ask: “Well, those low-cost chips took profits, what does that have to do with me?” I have explained this question in detail in the first paragraph of a previous article; interested readers can refer to this piece: “On-chain Data Detailed Analysis: Perhaps You Need to Be Prepared to Escape the Top at Any Time”
II. Future Market Scenario Interpretation & Planning
From the perspective of RUP, during the market downturn, I previously published an article: “Market Update: Is the Bull Gone?”
Some of the content mentioned at that time is updated as follows:
As the price began to show bottoming signals two days ago (I immediately posted a reminder).
$BTC experienced a nice “rebound” market.
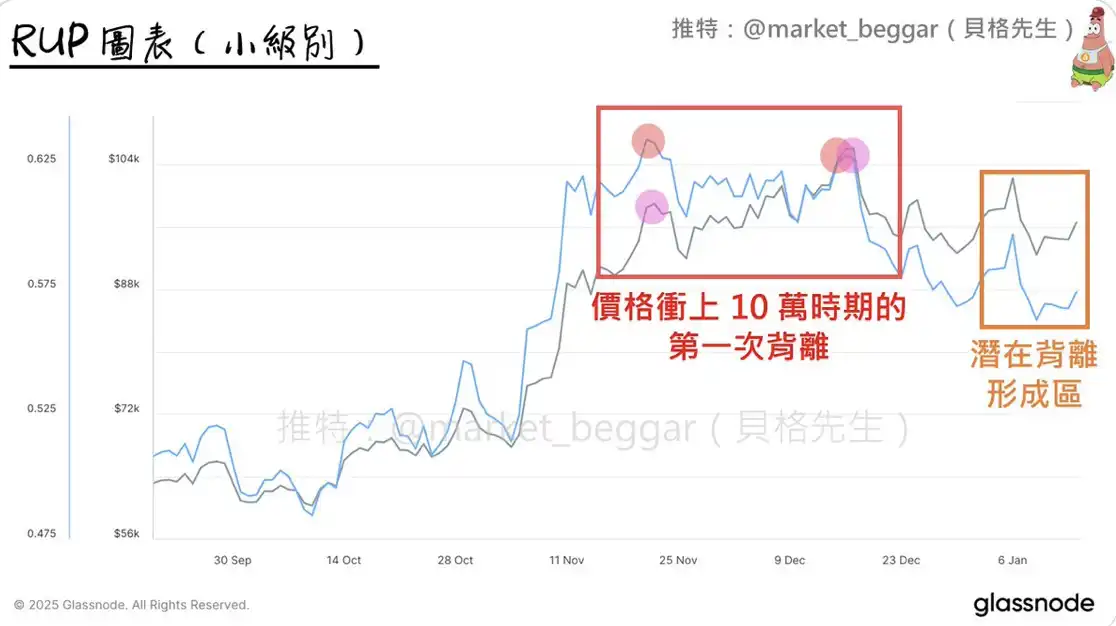
“Rebound”? Yes, I will define the current rise as a “rebound,” rather than a trend reversal signal. If you have read my previous articles, you should know that I am not optimistic about 2025. After the price first surged above 100,000, a RUP divergence signal appeared; the current market is within the orange box in the image, and attentive readers should notice:
In the current market, the RUP (blue line) is rising slower than the price (black line). Therefore, if the price rebounds to around 103k, it will create a new swing high, but the RUP is unlikely to reach a new high, thus forming a second divergence similar to 2017. What if the price continues to rise and sets a new historical high? Then it may create a top divergence structure similar to 2013 and 2021.
Regardless of which situation occurs, when the price turns and forms a swing reversal, I will update the RUP status here immediately.
III. Conclusion
Today, I explained the principle of RUP divergence again and outlined several possible future trends for $BTC, hoping to be of help to all readers!
免责声明:本文章仅代表作者个人观点,不代表本平台的立场和观点。本文章仅供信息分享,不构成对任何人的任何投资建议。用户与作者之间的任何争议,与本平台无关。如网页中刊载的文章或图片涉及侵权,请提供相关的权利证明和身份证明发送邮件到support@aicoin.com,本平台相关工作人员将会进行核查。


