Overview: Technical Digestion Phase After Breaking Through $107,000 Again
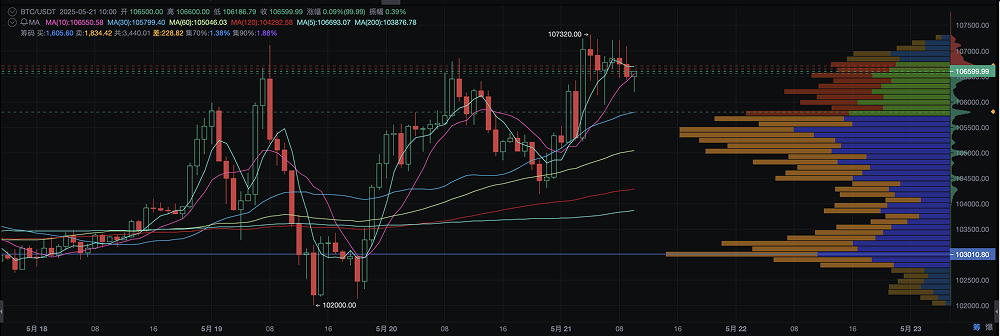
On the morning of May 21, 2025, Beijing time, Bitcoin (BTC) continued its strong upward momentum, breaking through the $107,000 threshold again, reaching a high of $107,320. Subsequently, the price exhibited a typical short-term oscillation and consolidation pattern, currently trading around $106,500, overall in a high-level oscillation range.
The catalyst for this round of increase partly stems from macro-positive policy stimuli—the U.S. Senate's procedural motion to pass the "GENIUS Act," indicating that stablecoins and their issuers are about to enter the federal regulatory system. At the same time, China's four major banks have rarely synchronized to lower the RMB deposit rates, pushing global asset hedging funds towards the digital asset market. These two major policy events triggered a short-term resonant surge in Bitcoin.
However, the technical indicators show frequent short-term overbought signals, and the current market is entering a structural consolidation phase, with future trends highly dependent on the continuity of capital and the performance of technical indicators.

K-Line Structure: Highs and Pullbacks Forming a Range, $107,000 Forms Initial Resistance
Upgrading from the 15-minute K-line to the hourly K-line chart (referencing data from May 21 at 11:00), we can observe:
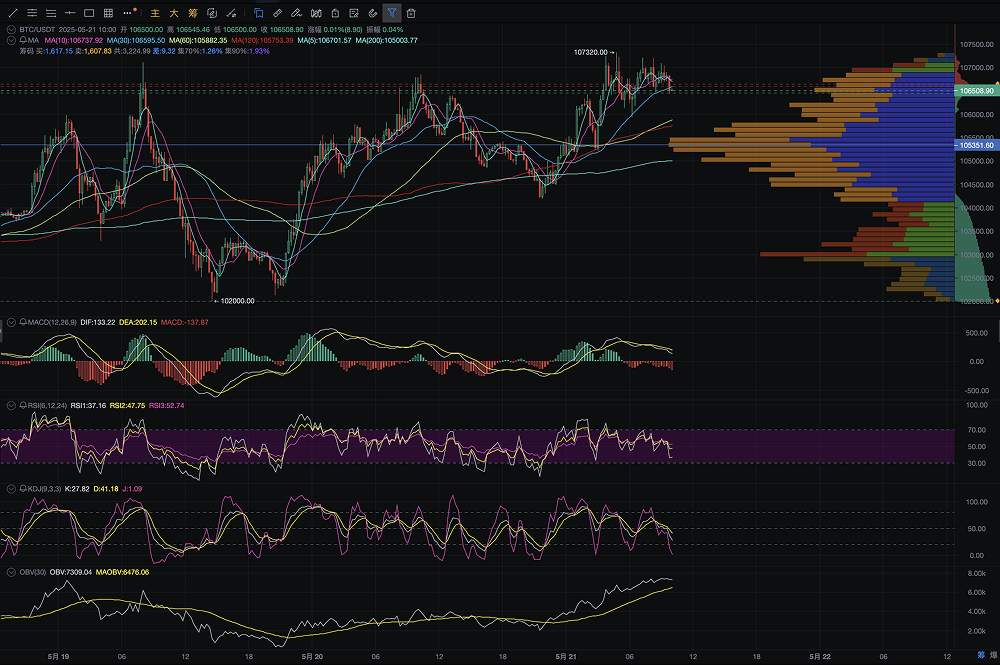
In terms of K-line patterns, two local highs were formed on the morning of May 19 and in the early hours of May 21 (approximately $107,108 and $107,320). The current price has pulled back to around $106,500, not yet breaking through the previous support range of $105,300-$105,500, technically forming a short-term platform of "highs-pullbacks-oscillation range."
Trading volume and horizontal behavior appeared simultaneously: from the right-side VOLUME PROFILE, the range of $105,300-$106,500 is a dense trading area, indicating active chip exchanges in this range. If the volume breaks above $107,320, it will enter an area not covered by previous highs, possessing potential for a technical breakout.
Preliminary definitions of intraday support and resistance: resistance above is at $107,300 and $107,800 (platform neck line and fluctuation highs), while support below is observed at $105,300 and $104,200.
Capital Movements: OBV Maintains Bullish Slope, Large Inflows Show No Signs of Exhaustion
The OBV (On-Balance Volume) indicator has continued its bullish trend line since May 18, currently maintaining a positive slope, indicating that proactive buying still dominates. Although the price is in a short-term horizontal range, net capital inflow has not significantly turned negative.
The minting of stablecoins is linked to market sentiment: Tether issued over $500 million in USDT on May 20, which is usually associated with enhanced short-term Bitcoin purchasing power, reinforcing bullish market expectations.

Technical Indicators: Momentum Pullback, Oscillation Continues Under Repair Pressure
- MACD: The DIF line remains above the DEA line, but the momentum bars are gradually shortening, indicating a weakening of upward momentum. The fast and slow lines are converging; if the price does not make a new high, a death cross signal may appear.
- RSI: The current value of RSI12 is 47.75, and RSI24 is 52.74, both in a neutral to weak range. The previous peak RSI broke through 77, reflecting that the short-term overbought repair process is underway.
- KDJ: K value is 27.82, D value is 41.18, and J value has fallen back to 1.09, showing a technical oversold pullback. If the J value turns upward and drives the K line up, it may trigger a new round of technical rebound.
- Moving Average System: MA5, MA10, and MA20 maintain a bullish arrangement, but MA5 shows a horizontal turn. This indicates that the short-term rhythm is slowing down, technically requiring time to exchange for space, waiting for MA10 to move up for support.
Fundamental Background: Policy Catalysts Drive the Reconstruction of "Structural Bull" Logic
U.S. "GENIUS Act" Procedural Passage
This act aims to establish a regulatory system for stablecoin issuers, with a unified review mechanism set up by the Federal Reserve, the Treasury Department, and other agencies. The stablecoin system is clearly defined, which is expected to provide stronger compliant payment channels for mainstream digital assets like Bitcoin, thus benefiting long-term valuation logic.

China's Four Major Banks Synchronize Interest Rate Cuts
Deposit rates have been comprehensively lowered by 15-25 basis points, marking the largest proactive adjustment in recent years. The interest rate cut is favorable for the valuation of risk assets, pushing domestic funds to focus on "asset replacement allocation," which may benefit Bitcoin from this liquidity flood turning towards risk appetite.
Continuous Net Subscriptions for ETF Products
Latest data shows that U.S. Bitcoin spot ETFs continue to attract capital, with BlackRock's IBIT recording a daily net inflow of over $100 million again. The stability of ETF funds is far higher than that of retail structures, making it one of the core pillars supporting Bitcoin in the medium to long term.

Market Outlook: After High-Level Oscillation, A Directional Breakthrough May Occur, Beware of False Breakout Risks
Combining the K-line structure and technical indicators, Bitcoin is currently in a typical short-term oscillation phase, with a directional choice approaching:
- Bullish Scenario: If capital continues to flow in, and an RSI bottom divergence forms, and the price breaks above $107,320 again, then the upper levels will challenge the $108,000 and $110,000 thresholds, entering a new trend initiation zone.
- Bearish Scenario: If the support at $105,300 is lost and OBV turns downward, it may trigger a rapid drop to around $104,000 or even $102,800, forming a "highs inducing long" pattern.
- Probability Assessment: Under the backdrop of macro-positive releases and continued policy expectations, the bullish structure has not yet been broken. High-level horizontal consolidation is more likely to be a continuation of the rise, waiting for clearer direction.
Conclusion
Driven by macro-positive factors in May 2025, Bitcoin has completed a phase breakthrough and entered a high-level oscillation accumulation period. In the short term, attention still needs to be paid to the completion of technical indicator repairs and whether capital shows signs of "lagging divergence." Regardless of whether it breaks upward or downward, once the direction is established, it may trigger a large-scale market movement. Investors need to closely monitor key price levels and trading volume coordination, maintaining a structural layout under risk awareness.
This article represents the author's personal views and does not reflect the stance and views of this platform. This article is for information sharing only and does not constitute any investment advice to anyone.
Join our community to discuss this event
Official Telegram Community: t.me/aicoincn
Chat Room: Wealth Group
免责声明:本文章仅代表作者个人观点,不代表本平台的立场和观点。本文章仅供信息分享,不构成对任何人的任何投资建议。用户与作者之间的任何争议,与本平台无关。如网页中刊载的文章或图片涉及侵权,请提供相关的权利证明和身份证明发送邮件到support@aicoin.com,本平台相关工作人员将会进行核查。


