
The "whale" that frequently appears in on-chain dynamics has made new moves—just as Bitcoin surged to $110,000, he placed a $10 million bet on a long position, using 20x leverage, and his unrealized profit instantly soared to $5.87 million! Now, his position has reached $250 million.

This is not just a big bet; it seems more like a precise interpretation of macro trends. From gold to U.S. stocks, from risk aversion to high-risk preferences, he seems to be "hitting everything." Today, I want to break down the logic behind this whale's operation from two dimensions: "macro + technical" and try to answer a question: Is Bitcoin really about to hit a historical high?
This time, the whale is betting on more than just Bitcoin
What kind of risk aversion signal is gold sending?
Gold is a traditional safe-haven asset. Whenever market uncertainty rises, the dollar weakens, or geopolitical risks escalate, gold often strengthens first. Now, as we enter June, the macro situation has once again brought gold's safe-haven properties into the spotlight.
- Inflation pressures are still accumulating: The aftereffects of the Federal Reserve's easing policy in 2024 are beginning to show, and the market is generally worried about rising inflation;
- Weak dollar index: If the DXY breaks below the key support of 100, funds will naturally flow towards non-dollar assets;
- Geopolitical unrest: Conflicts in the Middle East, the Russia-Ukraine situation, and tensions in Asia—all could act as catalysts for gold's strength.
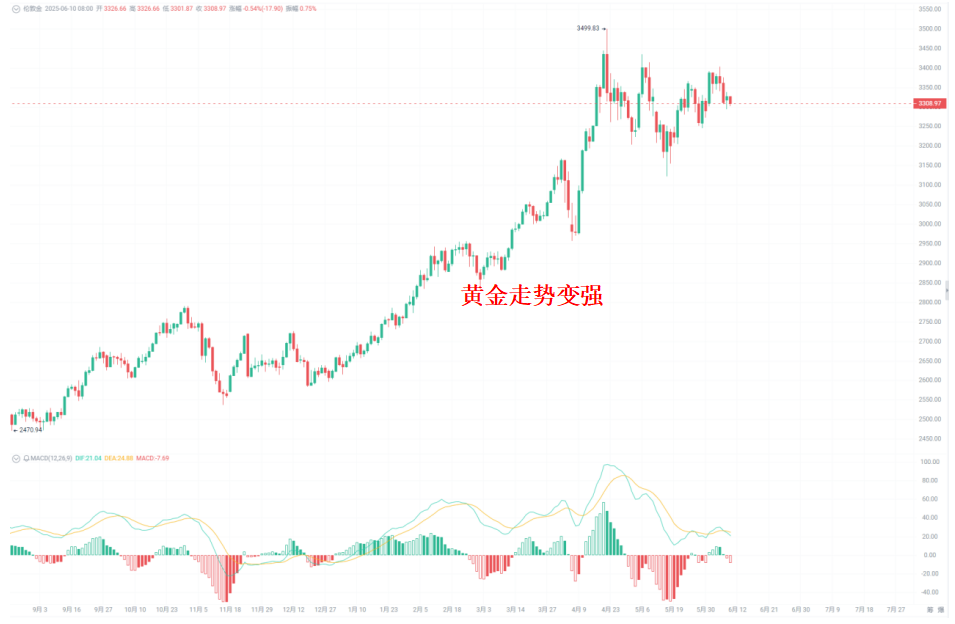
In this environment, Bitcoin's role as "digital gold" is once again emphasized. Glassnode data shows that between 2023 and 2024, the correlation between BTC and gold remains between 0.4 and 0.6.
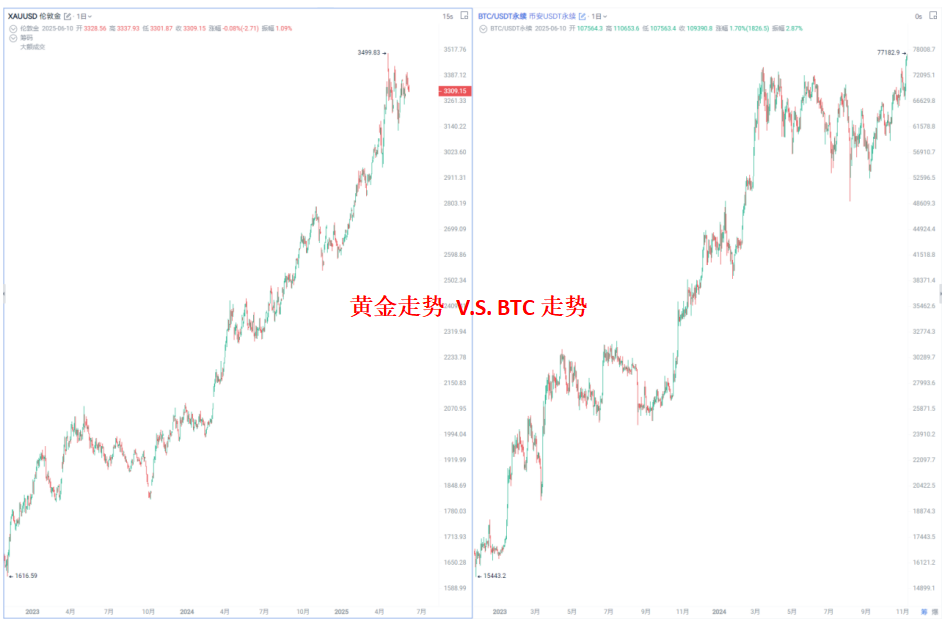
Therefore, this whale may not simply be betting on BTC, but rather on a combination logic of "risk aversion + new assets"—gold, as an old-school safe-haven tool, is already moving, and Bitcoin, as "digital gold," is expected to absorb the overflow of this sentiment, leading to a natural price increase.
"For traders, it might be worth paying more attention to the fund flows of the GLD ETF and the net positions of COMEX gold futures; perhaps the movements of these old assets can help you sense the direction of Bitcoin early."
Is the rise of the S&P 500 a sign that risk appetite has returned?
Of course, the market is not just worried about risks; sometimes it can also become "greedy."
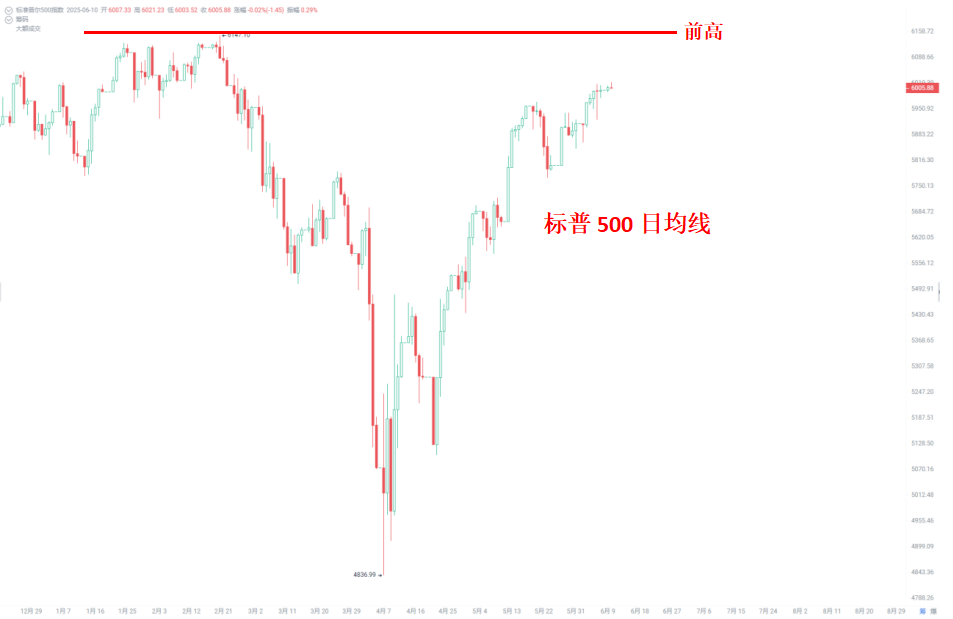
If you pay attention to the S&P 500's movements, you will find that it is currently in a rebound and recovery phase. Since hitting a low in April, the index has risen from around 4,800 points to the 6,000 point range. Although it is still some distance from the previous high of 6,147 points, it has already released an important signal: risk appetite is recovering.
At the same time, historical data shows that the correlation between Bitcoin and the S&P 500 tends to increase during bull markets—after all, Bitcoin is viewed by many institutions as a "tech asset." This may be one of the whale's judgment logics: "If U.S. stocks are still rising and the market is willing to take on more risk, then Bitcoin will not be absent."
Macro data + institutional movements, building a bullish consensus?
In addition to risk aversion and risk appetite, there are some hardcore "data-driven logic." These data provide fundamental support for the whale's aggressive strategy: he is not fighting alone but is aligned with the direction of the capital flow.
- Inflation & interest rate policy

If the June CPI annualized rate breaks above 5% (expected to be announced in mid-July, can refer to the AiCoin event calendar), market confidence in the dollar will waver, leading to more funds flowing into crypto assets. Whether the Federal Reserve adopts a dovish stance will also directly impact BTC's short-term trend.
- Institutional fund flows
Take BlackRock's Bitcoin ETF (IBIT) as an example; it surpassed $70 billion in assets under management in just 341 trading days. CoinShares data shows that institutional inflows into crypto ETFs exceeded $20 billion in 2024, and the pace is still accelerating in 2025.
From candlesticks and technical indicators: Can Bitcoin reach $120,000?
Having discussed the macro perspective, let's look at the charts. Currently, Bitcoin is around $109,000, close to the whale's opening price of $107,637. How should we assess the technical trend for the next 1-2 weeks?
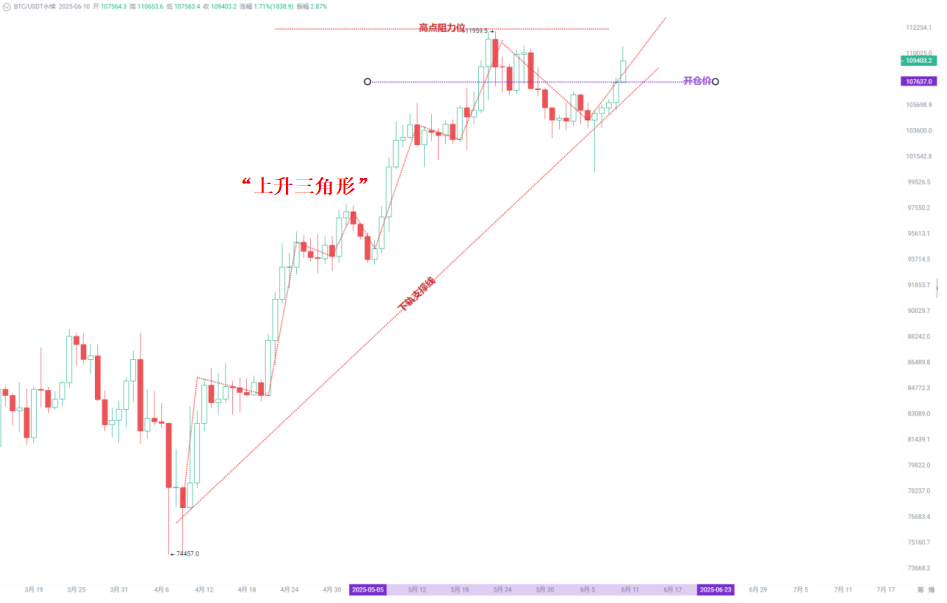
From a daily perspective, Bitcoin's current price is approaching the upper resistance level of $112,000, while the lower support has risen to the $108,000–$109,000 range. The gradually converging price pattern may indicate that a typical ascending triangle structure is forming. If it can break through $112,000 with volume, the trend is likely to continue upward.
At the same time, technical indicators also show alignment with the bullish direction:
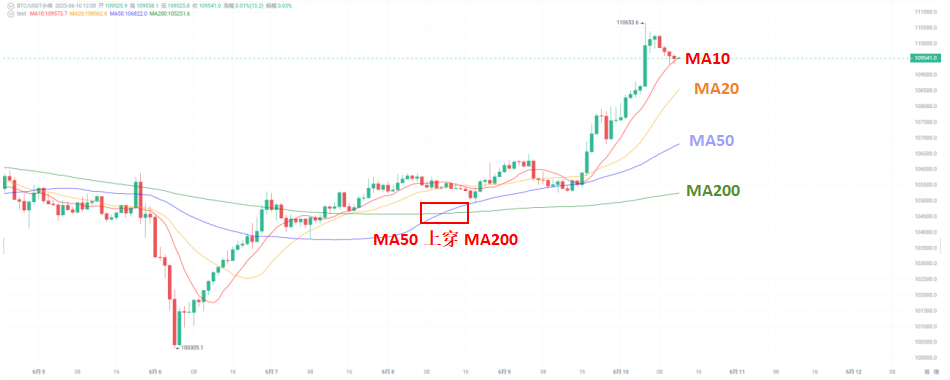
- Moving Average System (MA): Currently, the short-term moving averages (MA10, MA20) are in a bullish arrangement, reflecting that the market's short-term momentum remains strong; the price has also broken above the 50-day moving average, strengthening the mid-term bullish structure; the 50-day moving average has crossed above the 200-day line, forming a typical "golden cross," further confirming the mid-term bullish pattern; overall, the moving average system is gradually turning into a bullish arrangement, and the trend is likely to continue.
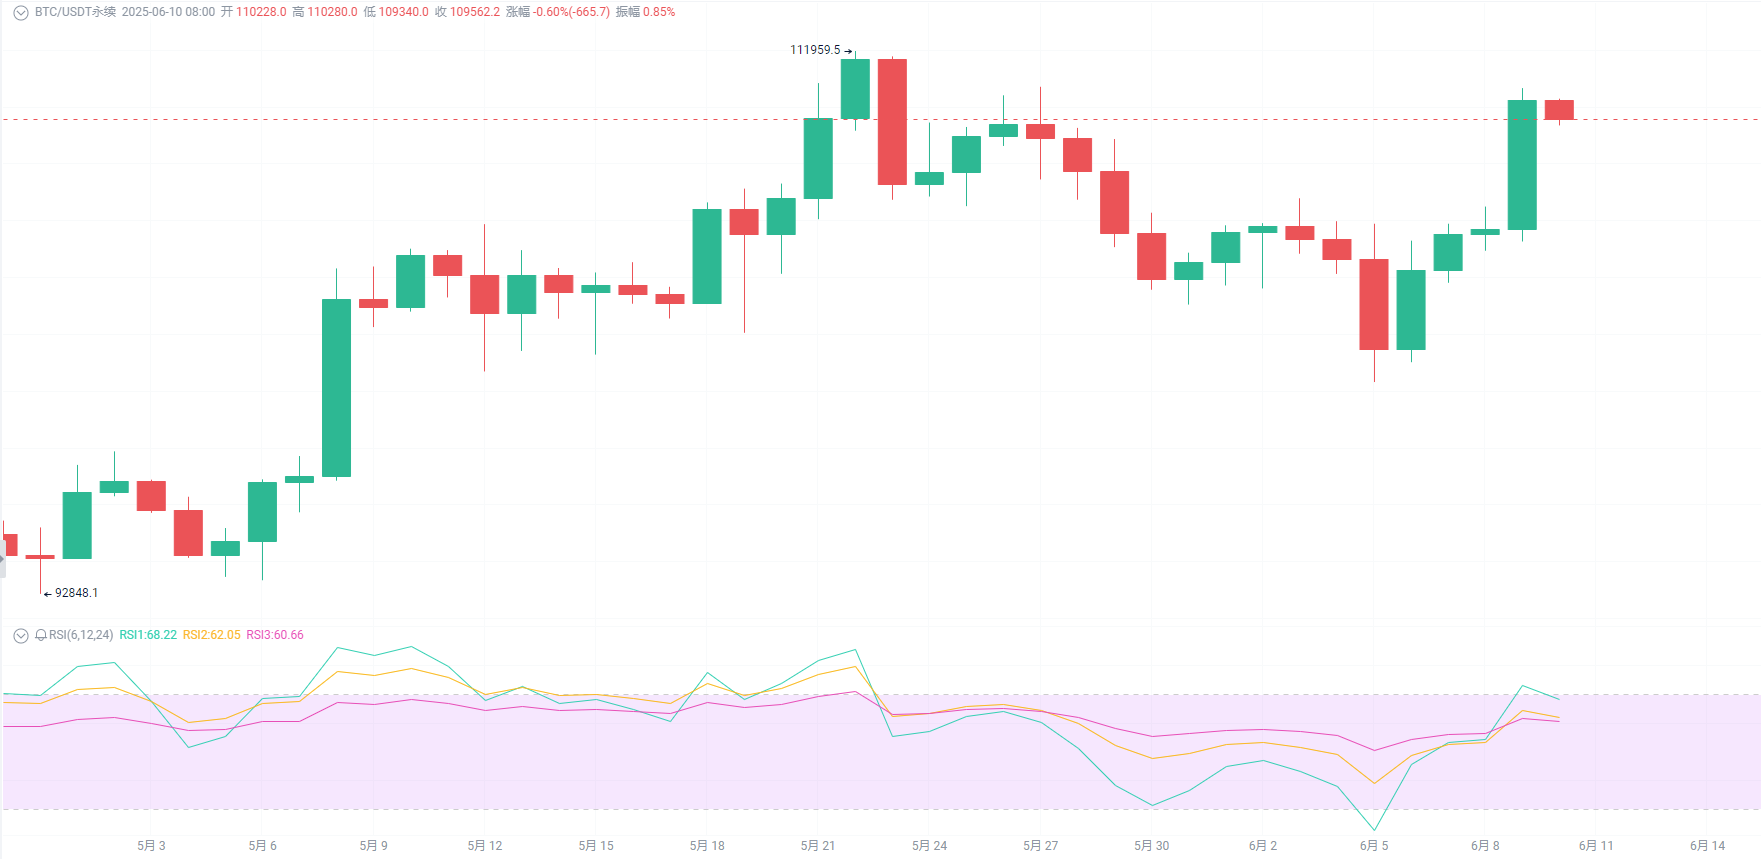
- Relative Strength Index (RSI): The recent daily RSI has risen to around 60, indicating strong bullish momentum but not yet overbought; if it continues to break above 70 with volume, it is likely to further challenge the $120,000 and higher target levels.
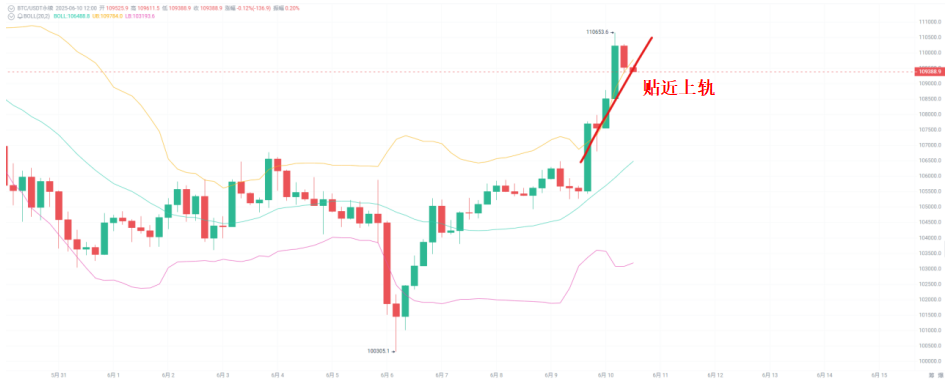
- Bollinger Bands: The recent price is running close to the upper band, and the bands are showing signs of expansion, indicating that the upward trend may continue.
- Volume: The effectiveness of the breakout depends on volume support. If the price breaks through $112,000 but lacks volume support, one should be cautious of the risk of a false breakout.
In fact, everyone should have noticed that every time we look at charts, draw lines, and set indicators, the core revolves around a few classic tools: moving averages, RSI, Bollinger Bands, volume… These indicators themselves are not mysterious; the key is whether they can validate your judgment of market logic.
For example, when you feel "macro is bullish," does the technical side also strengthen in sync? Or is it just a "false signal" during a rebound? In other words, technical analysis is a link to confirm your logical chain.
So, when we see risk aversion sentiment rising and institutional sentiment shifting, if the technical side shows a simultaneous increase in volume and price, along with trend confirmation, then you have more certainty to bet on the market; but if the technical pattern fails to give signals for a long time, one should be cautious—could it be another "false breakout" is coming?
Conclusion: Don't just watch where the "whales" swim; understand the water temperature too
This whale's operation is not just a "radical long position," but rather an example of a keen macro judgment combined with high-leverage tactics. For us ordinary traders, we may not be able to replicate such high-level operations, but we can learn three points from it:
- Trends are never determined by a single market; macro clues are becoming increasingly important;
- Price movement = sentiment + structure + capital + technology; resonance is key;
- Good risk control is always the starting point of trading—whales also set liquidation prices; what about your stop-loss?
免责声明:本文章仅代表作者个人观点,不代表本平台的立场和观点。本文章仅供信息分享,不构成对任何人的任何投资建议。用户与作者之间的任何争议,与本平台无关。如网页中刊载的文章或图片涉及侵权,请提供相关的权利证明和身份证明发送邮件到support@aicoin.com,本平台相关工作人员将会进行核查。


