This is a daily technical analysis by CoinDesk analyst and Chartered Market Technician Omkar Godbole.
Shares in cryptocurrency exchange Coinbase recently rose to $380, reclaiming valuations last seen on its Nasdaq debut on April 15, 2021, according to data source TradingView.
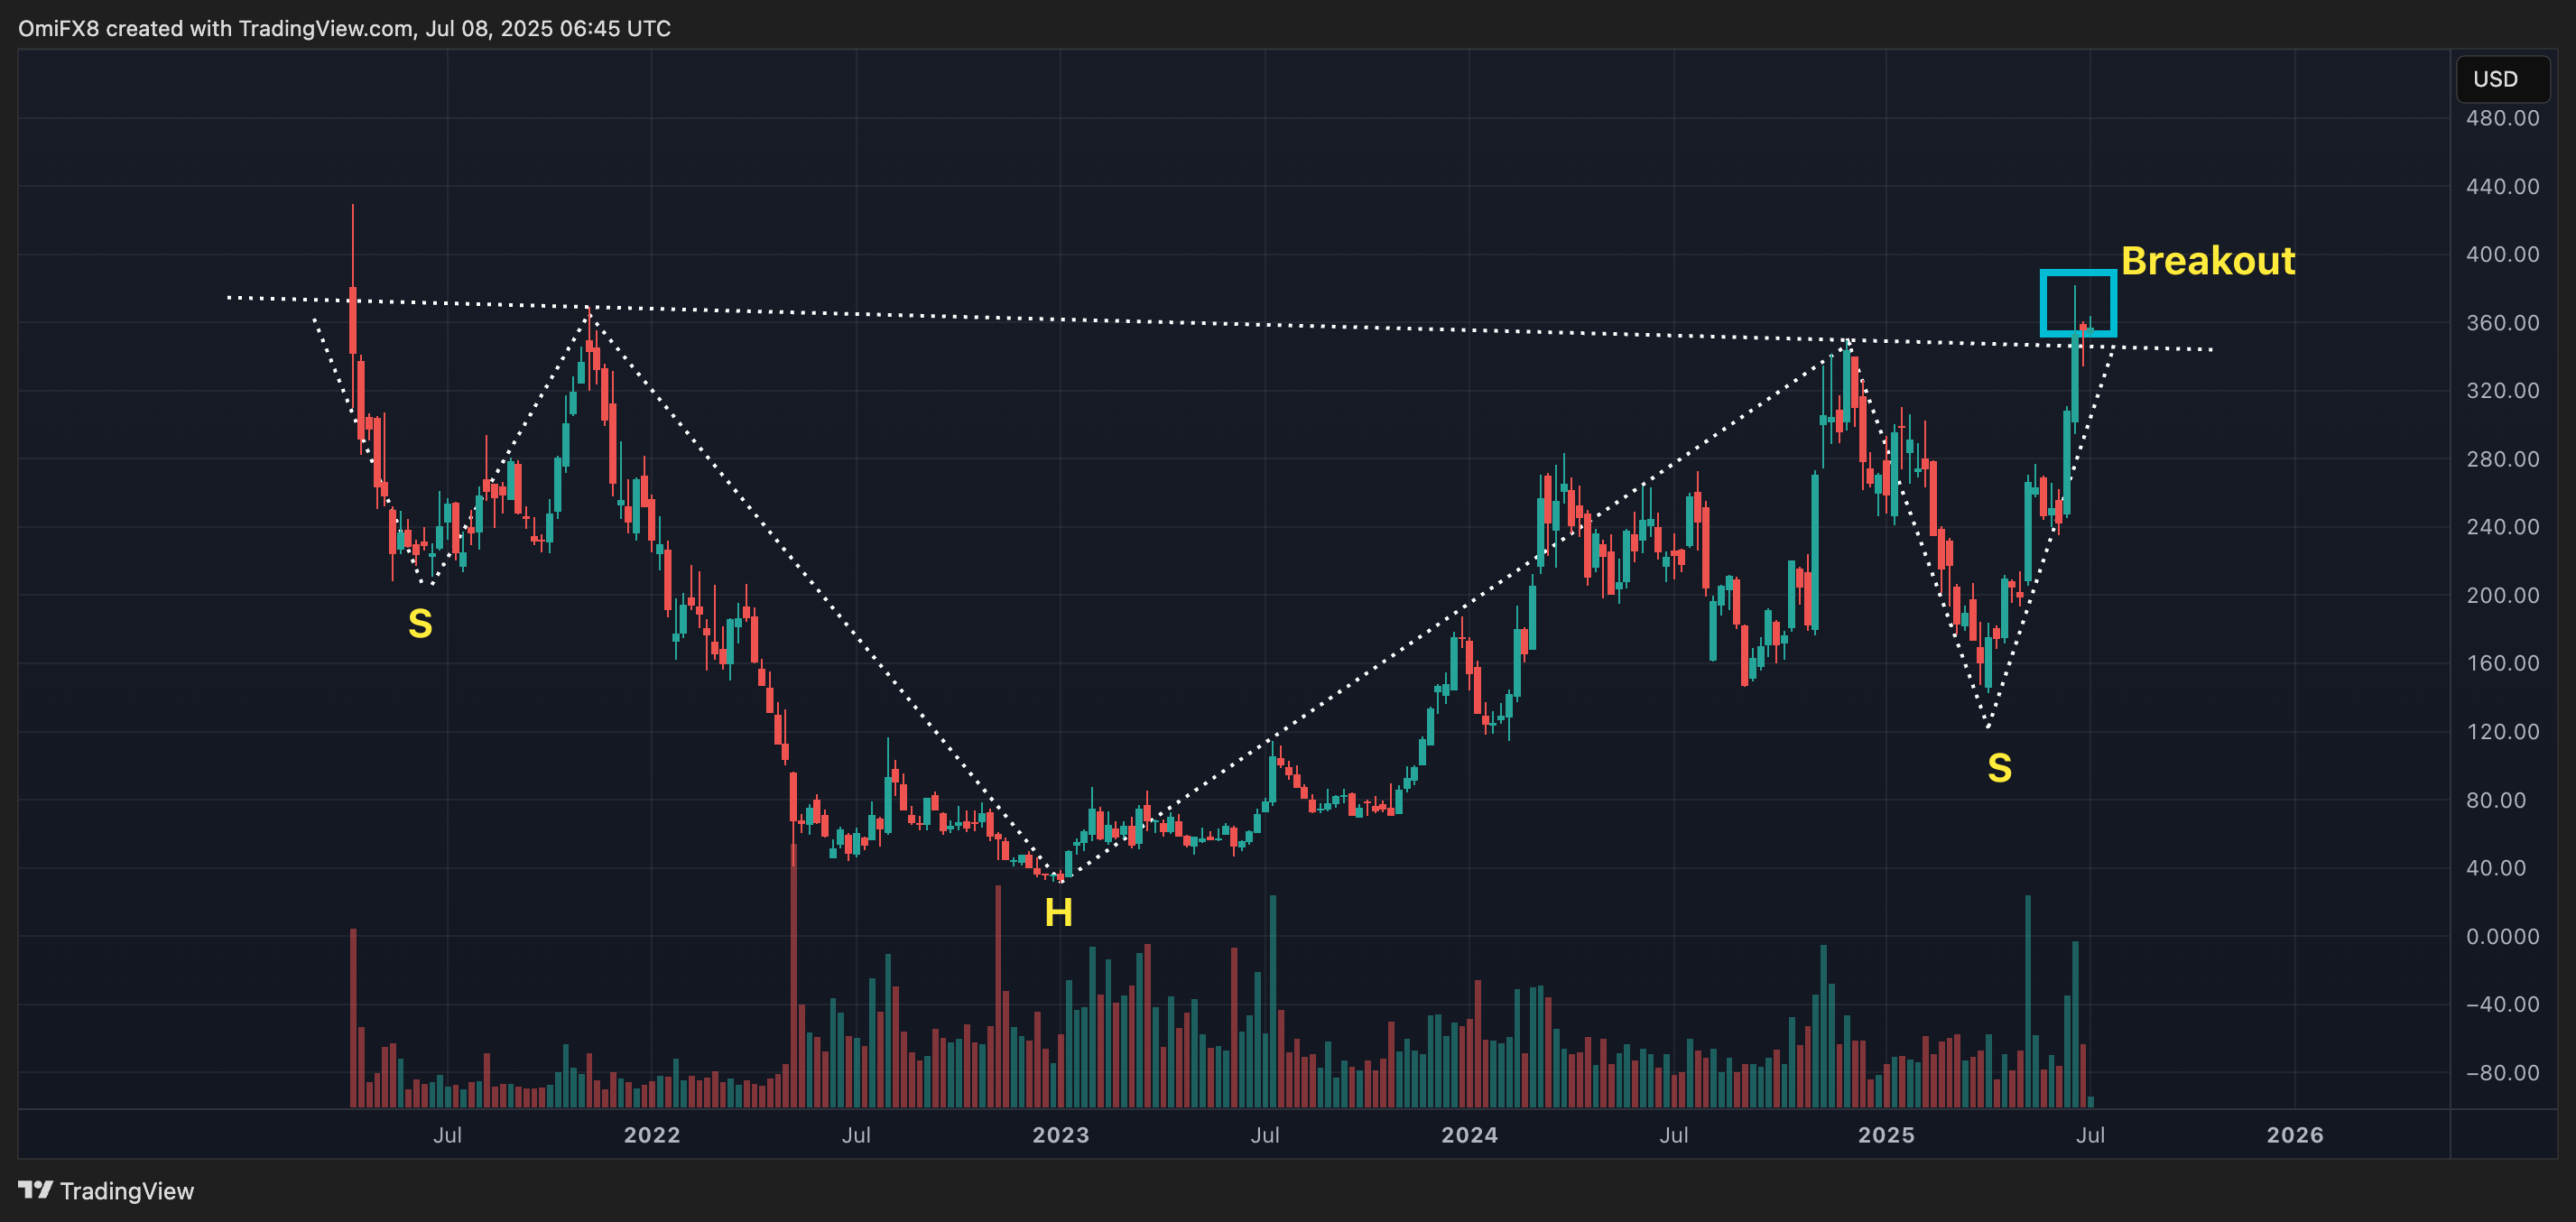
The round trip, encompassing a recovery from the 2022 low of $31.55, has triggered an inverse head-and-shoulders (H&S) breakout on the weekly chart, indicating a prolonged uptrend potentially to levels above $600.
Understand inverse H&S
An inverse head-and-shoulders pattern comprises three troughs, with the middle one being the deepest, marking peak bearishness, and the other two relatively shallower and roughly equidistant in magnitude.
The shallower right shoulder, a sign of buyers looking to reassert themselves, is where volumes tend to pick up. Still, the bullish trend change is confirmed only after prices move above the neckline, a line connecting recoveries between the troughs. Trading volume typically drop as the pattern unfolds and rise as it nears completion.
Chart analysts typically add the gap between the neckline and the low point of the pattern to the breakout point to calculate the possible upside in what's known as the "measured move" method of gauging potential rallies.
COIN's breakout

COIN recently topped the neckline resistance and has established a base above the same since then. The measured move method suggest a potential rally to $660.
Note how trading volumes remain depressed as the deepest tough, the head, was being formed through 2022-23 and picked up in April as the right shoulder neared completion.
The bullish technical development is consistent with the constructive outlook shared by most fundamental analysts. Recently, Oppenheimer raised its projection for COIN to $395 from $293, maintaining an "outperform" rating on the shares.
免责声明:本文章仅代表作者个人观点,不代表本平台的立场和观点。本文章仅供信息分享,不构成对任何人的任何投资建议。用户与作者之间的任何争议,与本平台无关。如网页中刊载的文章或图片涉及侵权,请提供相关的权利证明和身份证明发送邮件到support@aicoin.com,本平台相关工作人员将会进行核查。


