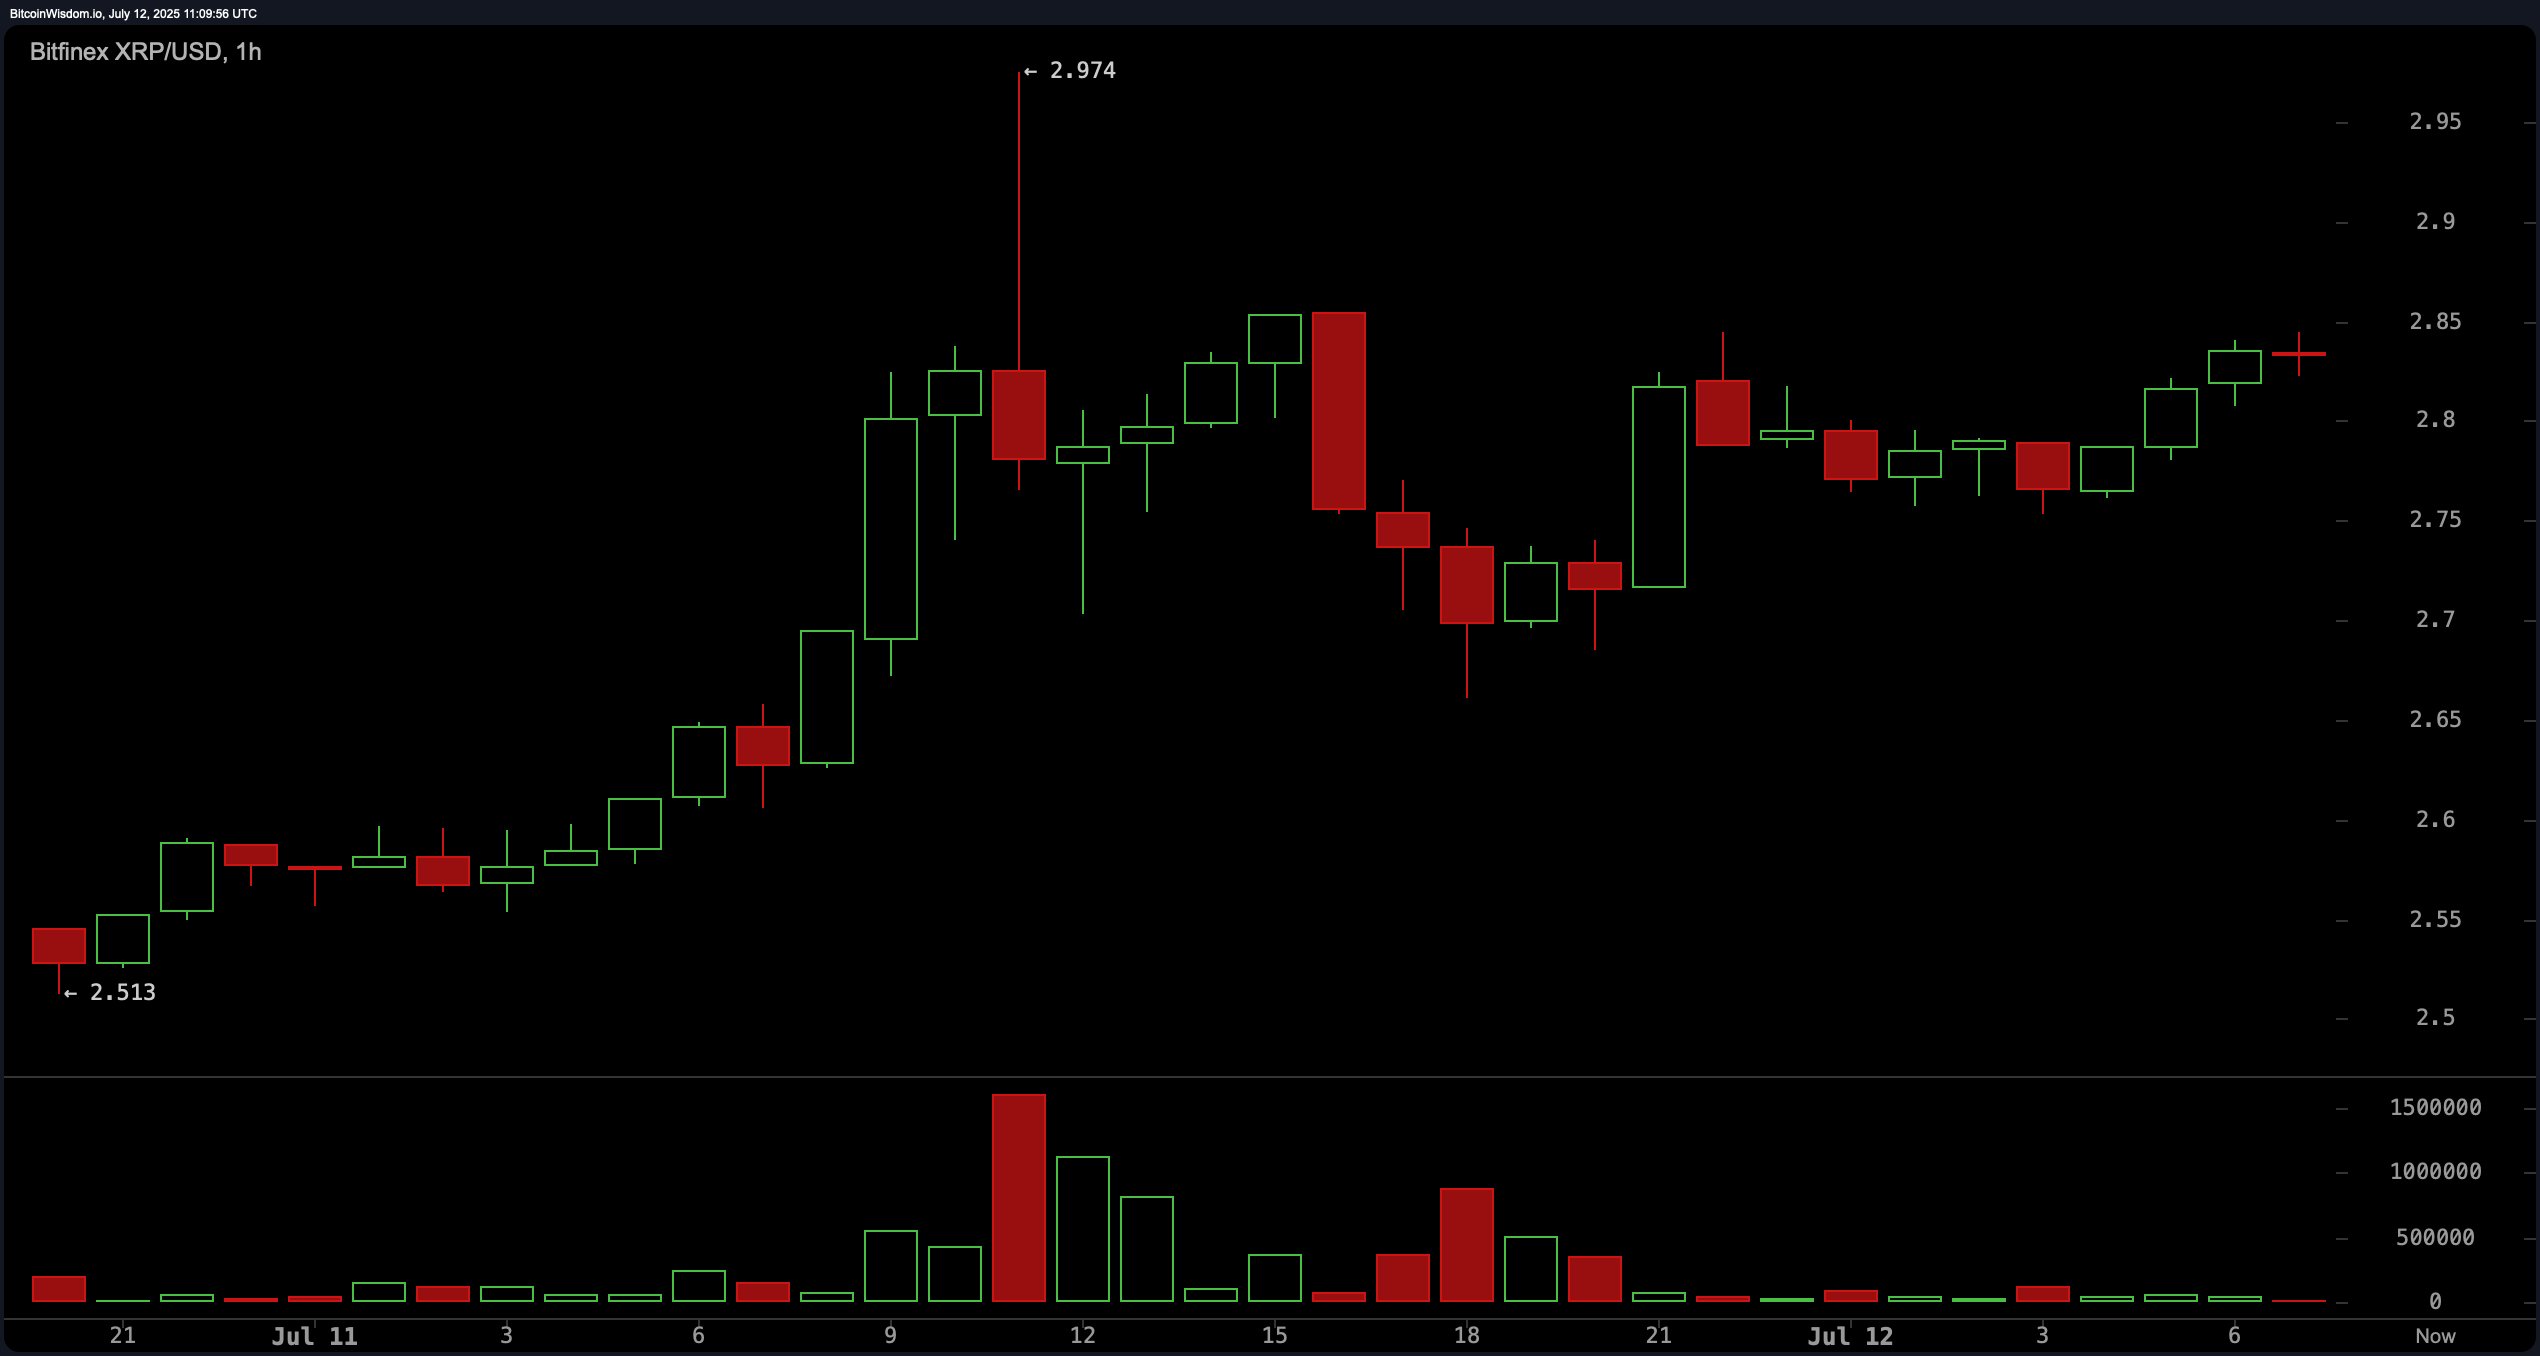
In the 1-hour chart, XRP’s recent price action signals a stabilization phase following its rapid ascent. After a post-rally pullback that found support around $2.70, the price has begun forming higher lows, indicating renewed accumulation and building strength. Lower selling volume, following bearish spikes, suggests sellers are losing momentum. Scalpers may consider long entries around $2.78 to $2.80, though positions above $2.87 are discouraged without a corresponding increase in volume. A tight stop-loss near $2.74 is advisable for short-term plays.

XRP/USD via Bitfinex 1-hour chart on July 12, 2025.
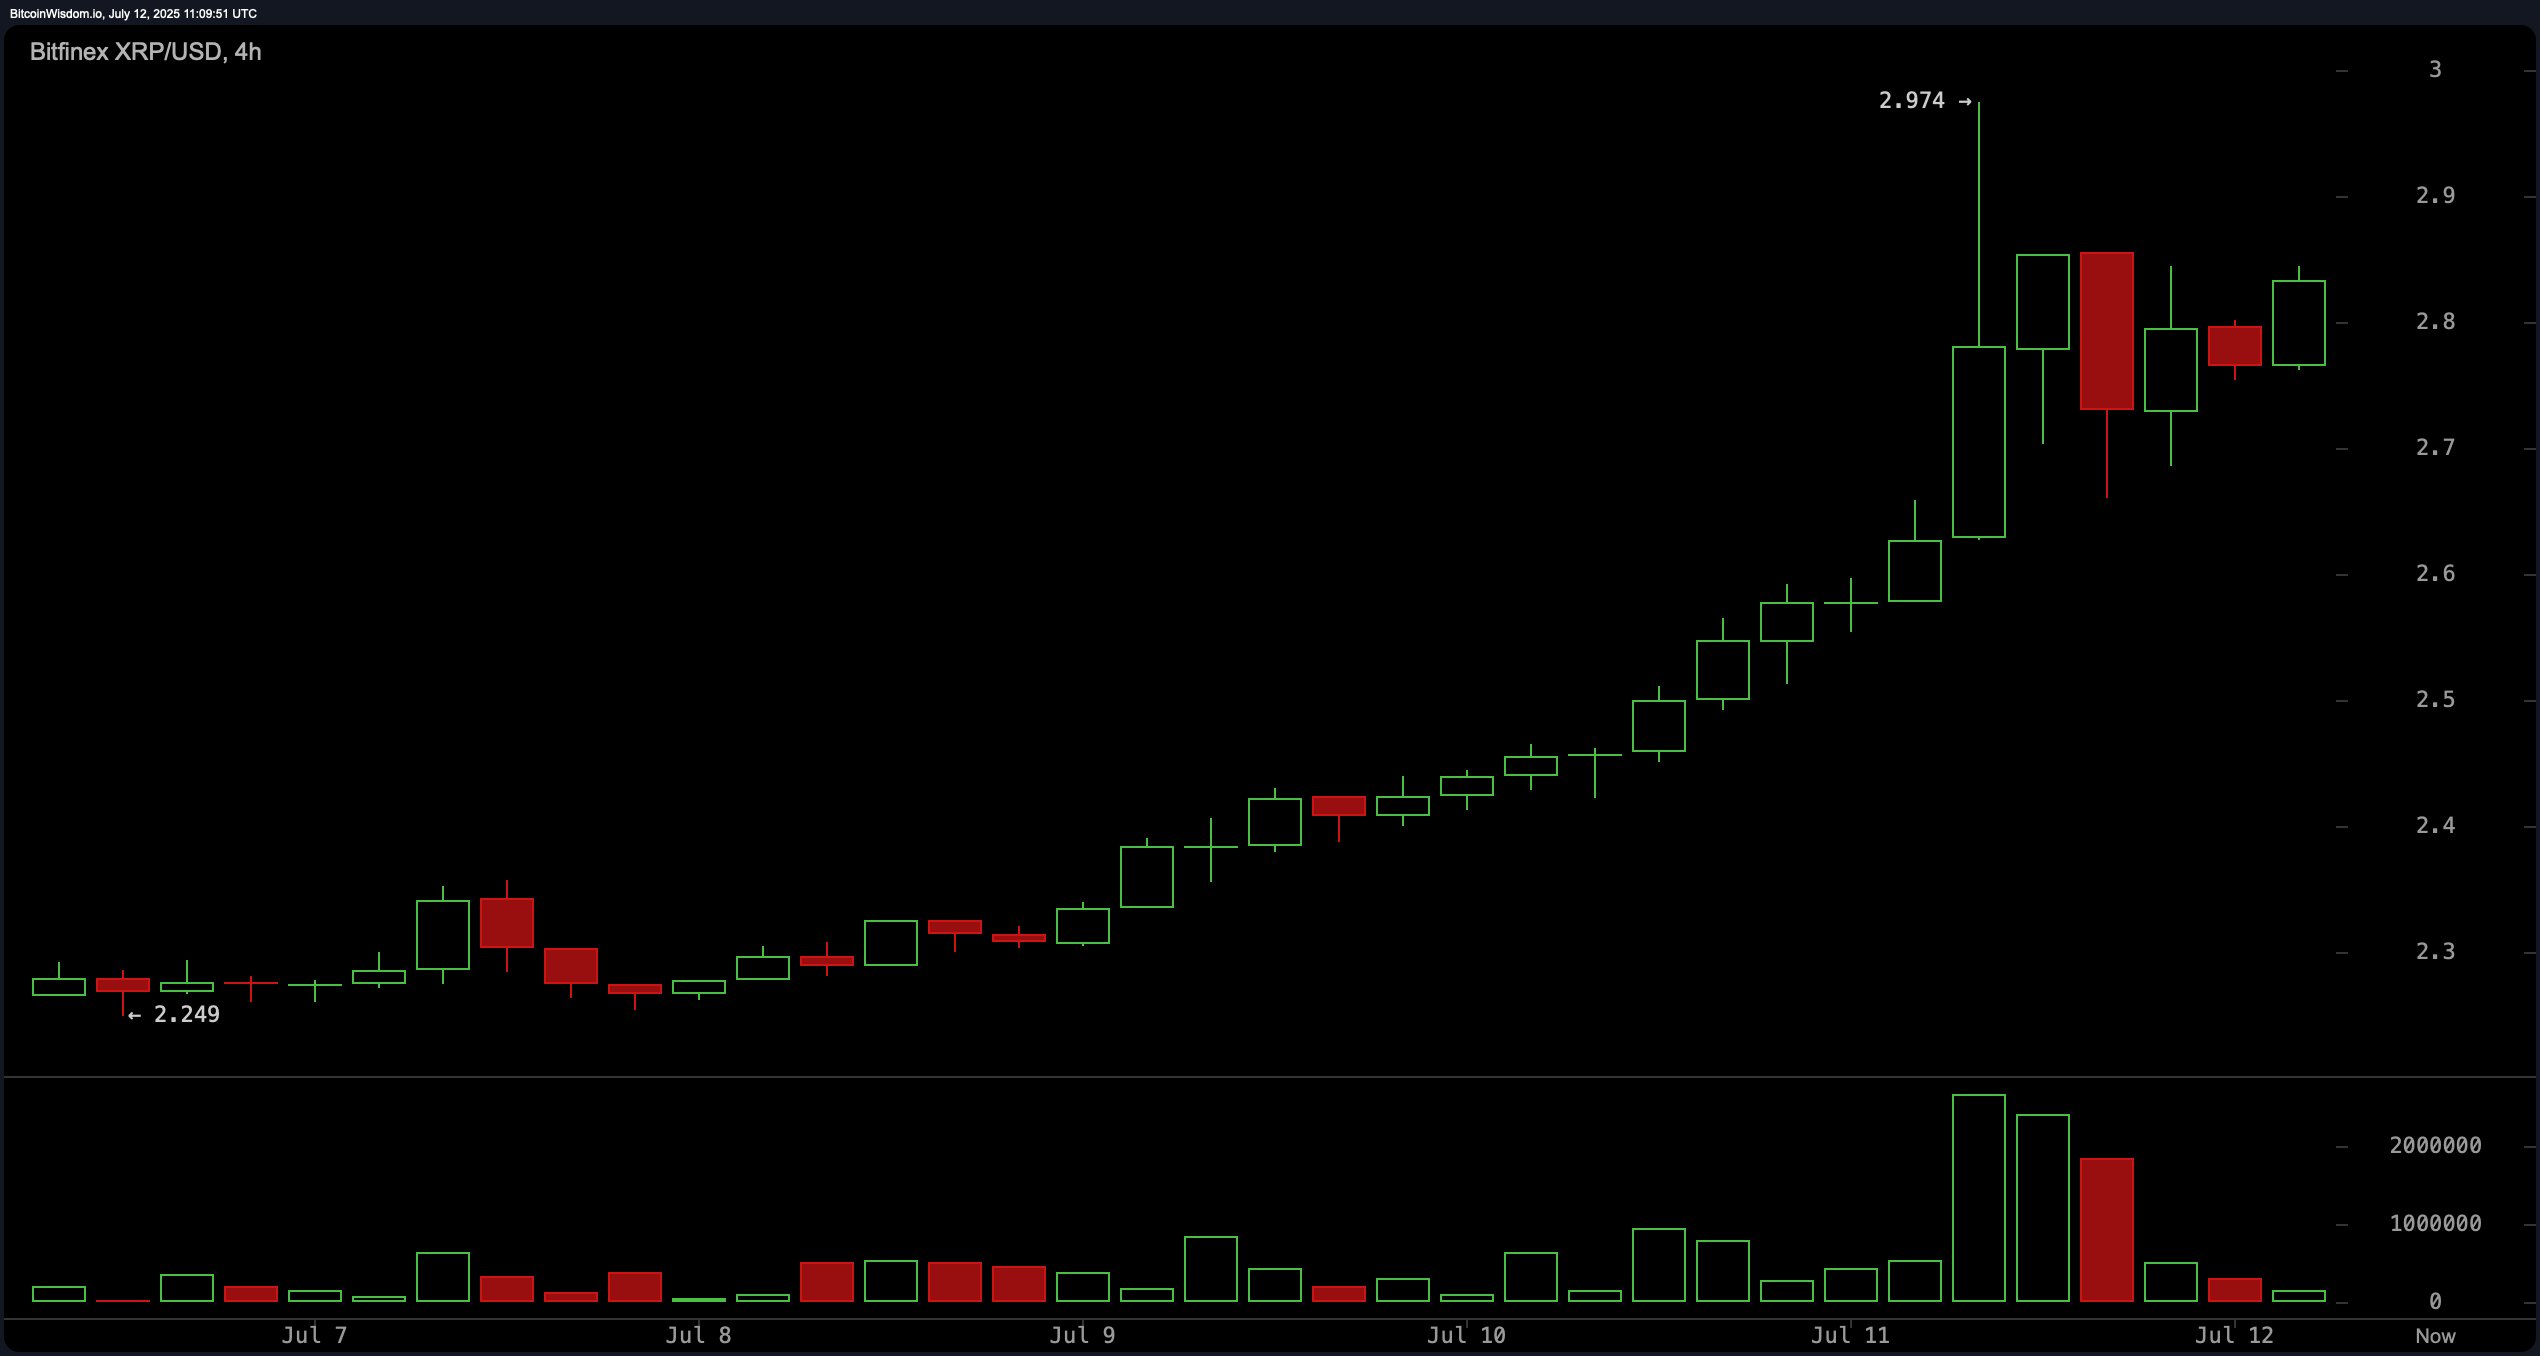
The 4-hour chart offers a view into a consolidation phase after an aggressive spike to $2.974, with XRP now oscillating above the $2.75 support. Lower volume and narrowing price ranges signal that the market is digesting the rally rather than reversing. Profit-taking has emerged, but the lack of broad sell-offs implies that bulls are merely pausing. An upside breakout above $2.90, especially with rising volume, could trigger a move toward the $3.20 to $3.40 range. Traders eyeing entries around $2.70 to $2.75 should be cautious of a stop-loss breach below $2.60.

XRP/USD via Bitfinex 4-hour chart on July 12, 2025.
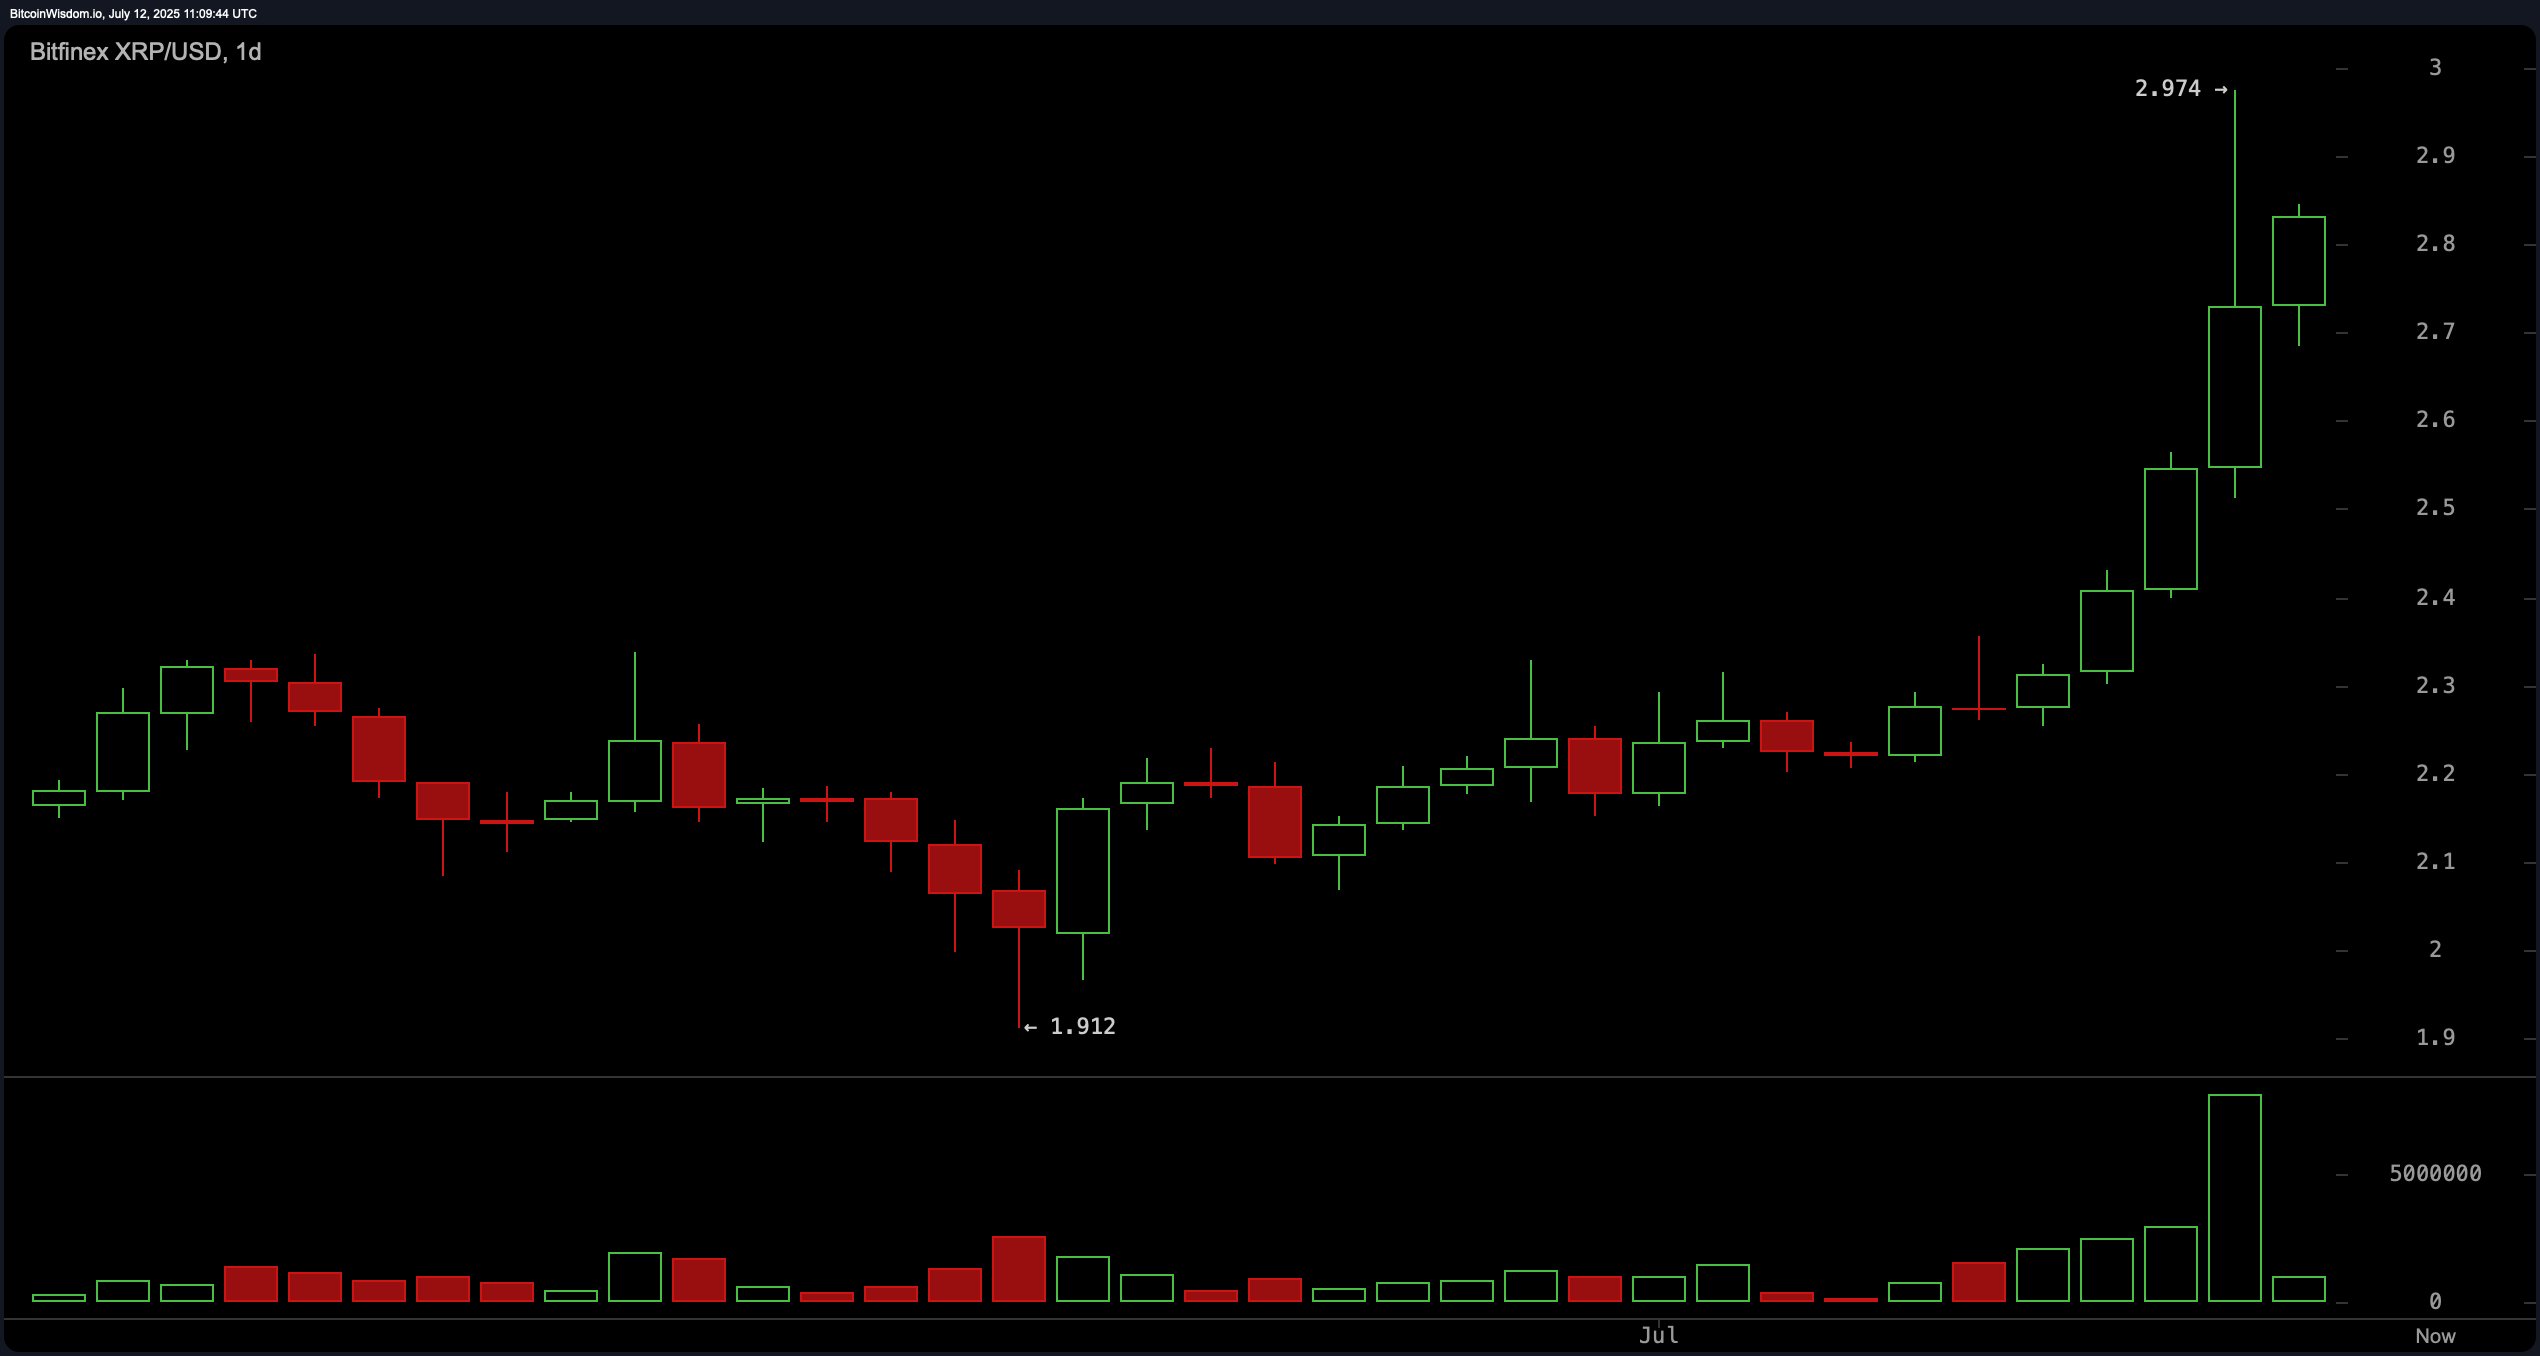
From the daily chart’s macro perspective, XRP has broken out strongly from a previous consolidation range near $2.20 to $2.30. The breakout was accompanied by large green candles and rising volume—hallmarks of institutional interest. With prices peaking near $2.974 and stabilizing in the $2.75 to $2.85 band, a retest of the breakout zone between $2.50 to $2.65 could offer a secondary entry point. However, exceeding $2.90 could attract significant selling pressure, potentially leading to a corrective move. Failure to hold above $2.50 may drag XRP back toward the $2.20 support level.

XRP/USD via Bitfinex daily chart on July 12, 2025.
The oscillator readings provide mixed signals. The relative strength index (RSI) (14) is at 80.83, placing it in overbought territory but yielding a neutral signal. The Stochastic and commodity channel index (CCI) both flag negative signals, suggesting near-term caution. Meanwhile, the average directional index (ADX) at 25.12 and the Awesome oscillator at 0.29 remain neutral. On the bullish side, the momentum indicator at 0.60 and the moving average convergence divergence (MACD) levels at 0.11351 both indicate bullish signals, reinforcing the underlying strength despite short-term fatigue.
Across moving averages, the technical landscape is unambiguously bullish. The exponential moving averages (EMAs) and simple moving averages (SMAs) across multiple timeframes—10, 20, 30, 50, 100, and 200 periods—are all issuing bullish signals. Notably, the 10-period EMA is at $2.47572 and the 10-period SMA at $2.40660, both well below current price levels, reinforcing the ongoing uptrend. Similarly, the 200-period EMA at $2.13315 and SMA at $2.36836 further validate long-term bullish momentum. These aligned moving average signals suggest that XRP remains technically supported for higher levels, provided volume confirms future upward moves.
Bull Verdict:
XRP remains in a structurally bullish formation across all major timeframes, supported by aligned buy signals from all key moving averages and momentum indicators like the Moving Average Convergence Divergence (MACD) and Momentum. If XRP can sustain its footing above $2.75 and break through the $2.90 resistance with volume, a rally toward $3.20 and beyond appears increasingly probable.
Bear Verdict:
Despite the strong rally, several oscillators—including the Stochastic %K and Commodity Channel Index (CCI)—are flashing sell signals, and the Relative Strength Index (RSI) is in overbought territory. If volume continues to decline and XRP fails to hold the $2.75 to $2.60 support range, the risk of a deeper pullback toward $2.50 or even $2.20 cannot be ruled out.
免责声明:本文章仅代表作者个人观点,不代表本平台的立场和观点。本文章仅供信息分享,不构成对任何人的任何投资建议。用户与作者之间的任何争议,与本平台无关。如网页中刊载的文章或图片涉及侵权,请提供相关的权利证明和身份证明发送邮件到support@aicoin.com,本平台相关工作人员将会进行核查。


