Master Discusses Hot Topics:
As usual, let's take a look at this week's macro market on Monday. The first topic is tariffs; the US and Europe have settled, and the US and Japan have also shaken hands. The next focus will be on how East Asia, Japan, Canada, and Mexico will negotiate.
Then there's the Federal Reserve's interest rate meeting on Thursday. Will old Powell back down? He has already been grilled by Congress twice; will he say something nice this time to soothe the market?
Meanwhile, the Bank of Japan is also joining the fray. With the US-Japan agreement in place, the interest rate path may need slight adjustments, as they can't always follow the dollar's lead.
Finally, there's Friday's non-farm payroll report. With private sector employment so weak, and the market not completely giving up on inflation, how can the Fed not lead the market by the nose?
Back to the market, last Friday's sudden surge in Bitcoin was what I referred to as a false breakdown. The market reported the transfer of 80,000 Bitcoins, which directly broke through the consolidation range. But I said this is a typical false breakdown washout, not a collapse but a trap for shorts.
The current structure is quite clear: the pullback did not break the level, and the rebound returned to the original range. The market will likely test the pullback once more. My view is quite aggressive: as long as the price returns below 116.6K but doesn't drop too deep, that will be one of the mid-term long entry points.
The previous two highs around 121K are likely the market's liquidity accumulation zone. No need to think too much; the first target of this Bitcoin rebound is heading there. Whether you believe it or not, market funds will sniff this out themselves.
As for the support around 112K, it hasn't been tested before, so it still seems reliable. However, if it does drop and retest, that would basically signal a failure for the bulls, not a trap for shorts but a trend reversal.
So, although the chart looks bullish, don't forget that technical analysis can be as useless as toilet paper when faced with unexpected events. It looks clean, but it can't wipe away the reality. Plans need to be flexible; the market makers love it when you stubbornly stick to your guns.
As for myself, I'm still holding a mid-term long position at 115.4K, considering adding to my position only on a pullback. If it doesn't pull back, then I'll wait for a better structure to emerge.
Now let's talk about Ethereum. Today it almost touched 4K, and after a slight pullback during the day, it seems ready to move again. Now 3800 has become the new support, and whether it can hold depends on whether this surge is strong.
To really make a move, it needs to break through the resistance zone of 4112-4150. If it can pull back and stabilize above 3888, then it’s basically preparing for the next attack on 4500 or even 4880.
But I have to be honest, Ethereum's strength doesn't mean it's invulnerable. If it can't hold above, it will be a false high, and there are short opportunities between 3930-4150.
Don't be fooled by the monthly golden cross brewing; if a big bullish candle is to appear, it will likely be after the Fed has made its moves. This week's rebound is basically locked in the range of 3880-4152. Those who don't want to get hammered need to play it safe…
Master Looks at Trends:
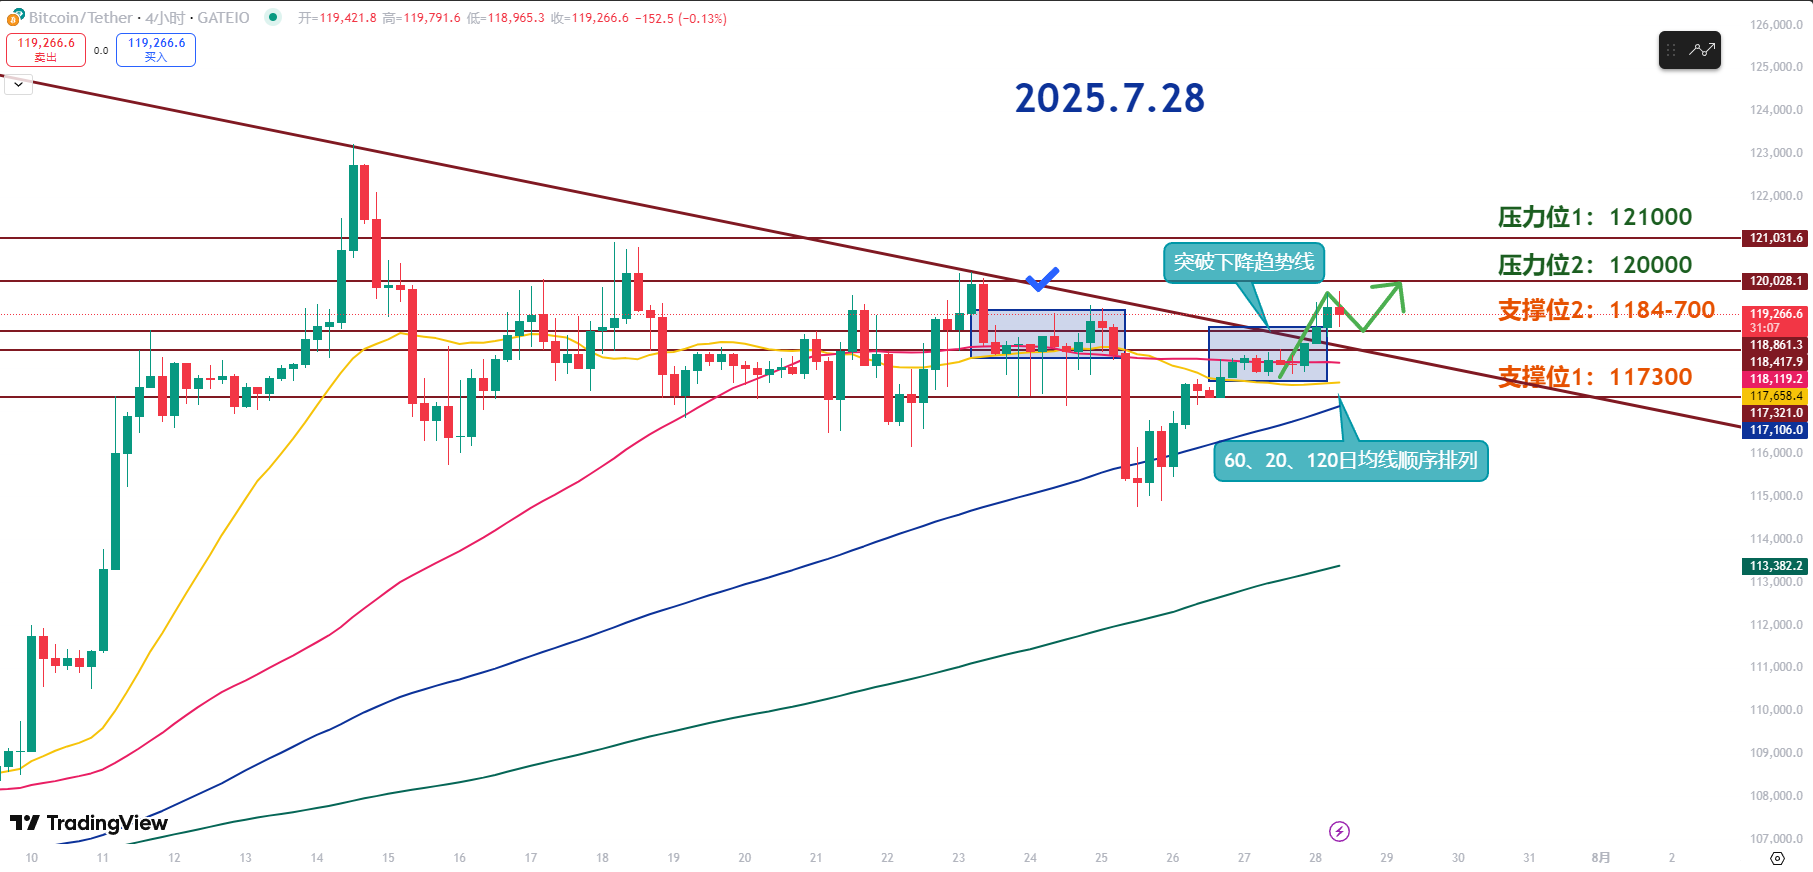
Resistance Levels Reference:
Second Resistance Level: 121000
First Resistance Level: 120000
Support Levels Reference:
Second Support Level: 118400-118700
First Support Level: 117300
The current position is the starting point for a short-term trend reversal. If the subsequent pullback can still hold the 118400-118700 range, then the short-term bullish outlook can be maintained.
If a retest of 120K occurs, it's important to note that this is a psychological barrier. A short-term pullback may happen, making it a suitable position for buying low rather than chasing highs.
Given the recent trend reversal, short-term opportunities can be found during pullbacks, rather than waiting for prices to surge before chasing. If the price can oscillate around the 118400-118700 range, it will be beneficial for a future breakout to higher price levels.
The first resistance at 120K is currently the primary resistance, with an increased probability of a retest. If this level can be broken, it may trigger a short-term acceleration in the upward trend.
If it stands above the second resistance at 120K, it will further open up upward space. The range of 121K-122K is the next short-term resistance zone and also a psychological integer level, where significant selling pressure is expected.
From the chart, the first support at 118.4K-118.7K has effectively stabilized in recent closes, with buying power concentrated there. Therefore, it is the key support area, and whether the price can hold this range today is crucial.
If an unexpected event causes a sharp price drop, the second support at 117.3K will become a short-term stop-loss area. This is also near the 120-day moving average, where the probability of a short-term rebound is high, making it a potential buying opportunity.
7.28 Master’s Wave Strategy:
Long Entry Reference: Buy in batches in the 118400-118700 range. Target: 120000-121000
Short Entry Reference: Not applicable at this time.
If you truly want to learn something from a blogger, you need to keep following them, rather than making hasty conclusions after just a few market observations. This market is filled with performers; today they screenshot their long positions, and tomorrow they summarize their shorts, making it seem like they "always catch the tops and bottoms," but in reality, it's all hindsight. A truly worthy blogger will have a trading logic that is consistent, coherent, and withstands scrutiny, rather than jumping in only when the market moves. Don't be blinded by flashy data and out-of-context screenshots; long-term observation and deep understanding are necessary to discern who is a thinker and who is a dreamer!
This article is exclusively planned and published by Master Chen (WeChat: Coin Master Chen). For more real-time investment strategies, solutions, spot trading, short, medium, and long-term contract trading techniques, and knowledge about candlesticks, you can join Master Chen for learning and communication. A free experience group for fans has been opened, along with community live broadcasts and other quality experience projects!

Friendly Reminder: This article is only written by Master Chen on the official account (as shown above). Any advertisements at the end of the article or in the comments section are unrelated to the author! Please be cautious in distinguishing between true and false, and thank you for reading.
免责声明:本文章仅代表作者个人观点,不代表本平台的立场和观点。本文章仅供信息分享,不构成对任何人的任何投资建议。用户与作者之间的任何争议,与本平台无关。如网页中刊载的文章或图片涉及侵权,请提供相关的权利证明和身份证明发送邮件到support@aicoin.com,本平台相关工作人员将会进行核查。


