Author: White55, Mars Finance
The Bitcoin market is witnessing a classic battle between bulls and bears. After reaching an all-time high of approximately $123,250, BTC has retraced 7.50% within three weeks, briefly falling below the $113,000 mark. However, analysts see a more fundamental trend beneath the surface—strong support from the 50-day Exponential Moving Average (EMA) coinciding with the neckline of an Inverted Head and Shoulders (IH&S) pattern, forming a "perfect bottom" technical structure. Meanwhile, on-chain data shows that the $9.6 billion sell-off by "old whales" is not bearish; rather, it mirrors the profit-taking seen after the approval of the ETF in March 2024 and the expected profit-taking following Trump's victory at the end of 2024. Historically, after such sell-offs, the market has experienced even stronger rallies.
1. Technical Resonance: Dual Support Levels Build a Launchpad for the Bull Market
BTC/USD Daily Price Chart. Source: TradingView
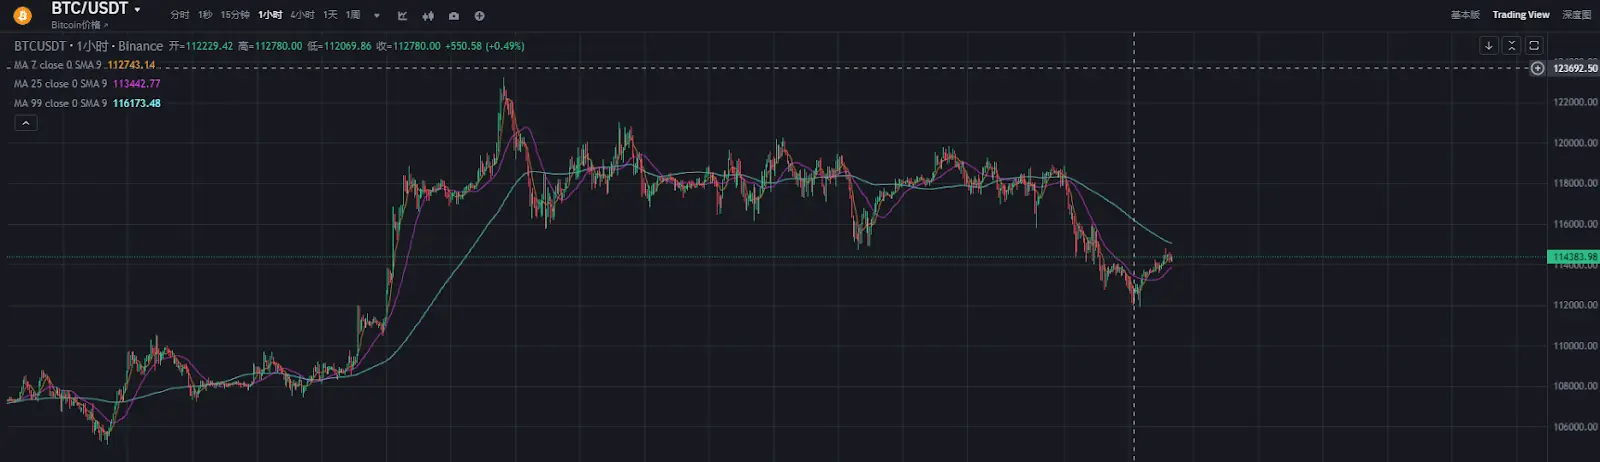
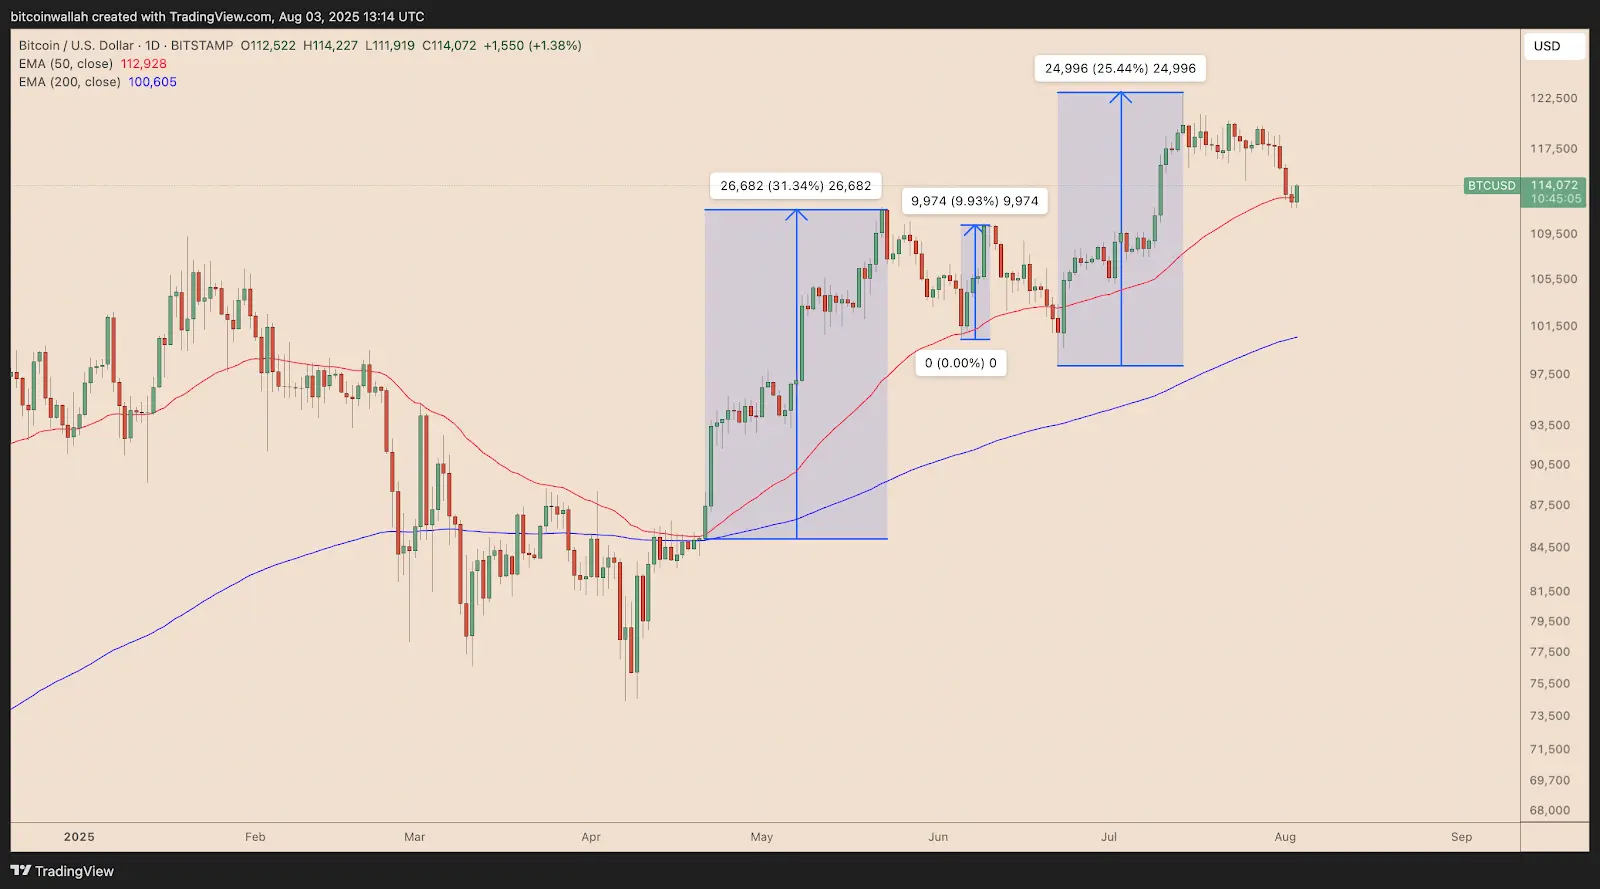
The daily chart of Bitcoin is outlining a typical bullish correction path. On Sunday (August 3), the price briefly fell below the 50-day EMA (red wavy line) but quickly recovered this critical level, reminiscent of the technical script from June—when a similar drop triggered a rapid 25% rebound. This moving average has become a stronghold for bulls since the 2025 bull market, with three retests converting into upward momentum.
 BTC/USD Daily Price Chart. Source: TradingView
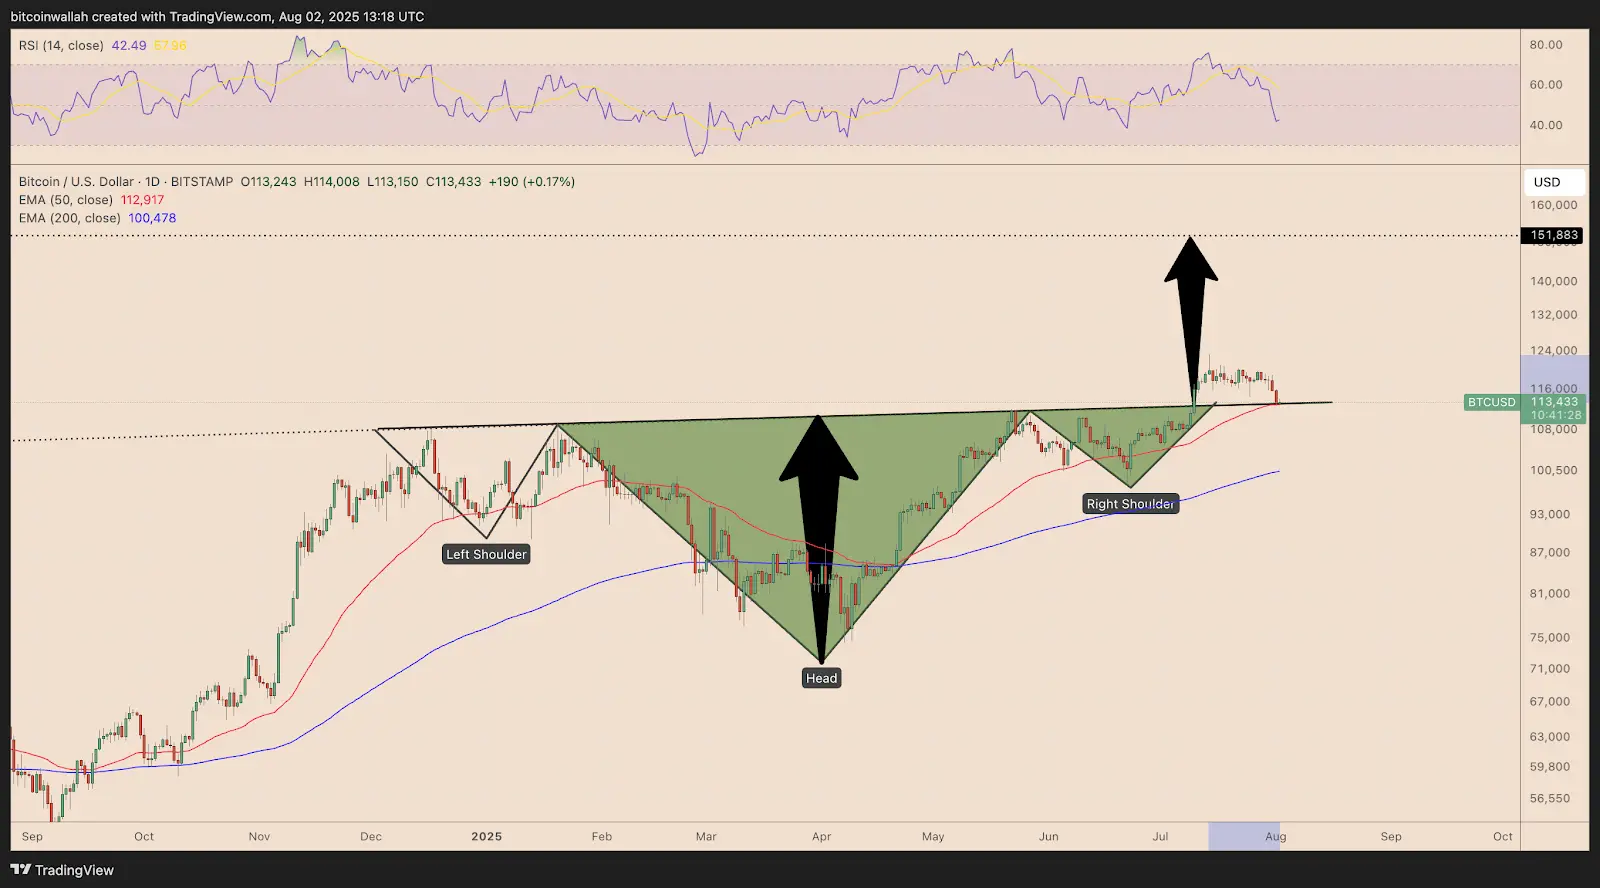
Notably, the 50-day EMA and the neckline of the Inverted Head and Shoulders pattern are forming a technical resonance. After breaking through the neckline at the end of July, the current retracement is seen as a retest of the breakout's validity. If successfully defended, it will open up upward potential with a measured target of $148,250. This target aligns with the rounded bottom pattern at the weekly level (targeting $140,000) and the bull flag breakout (targeting $150,000).
The market structure has quietly shifted: the CME $115,000 gap has been filled, high-leverage positions have been cleared, and financing rates have returned to a healthy range, clearing obstacles for a "net long rise."
2. Whale Game: The Bull Market Cooling Mechanism Behind the $9.6 Billion Sell-off
 Both "old whales" and "new whales" are profiting. Source: CryptoQuant
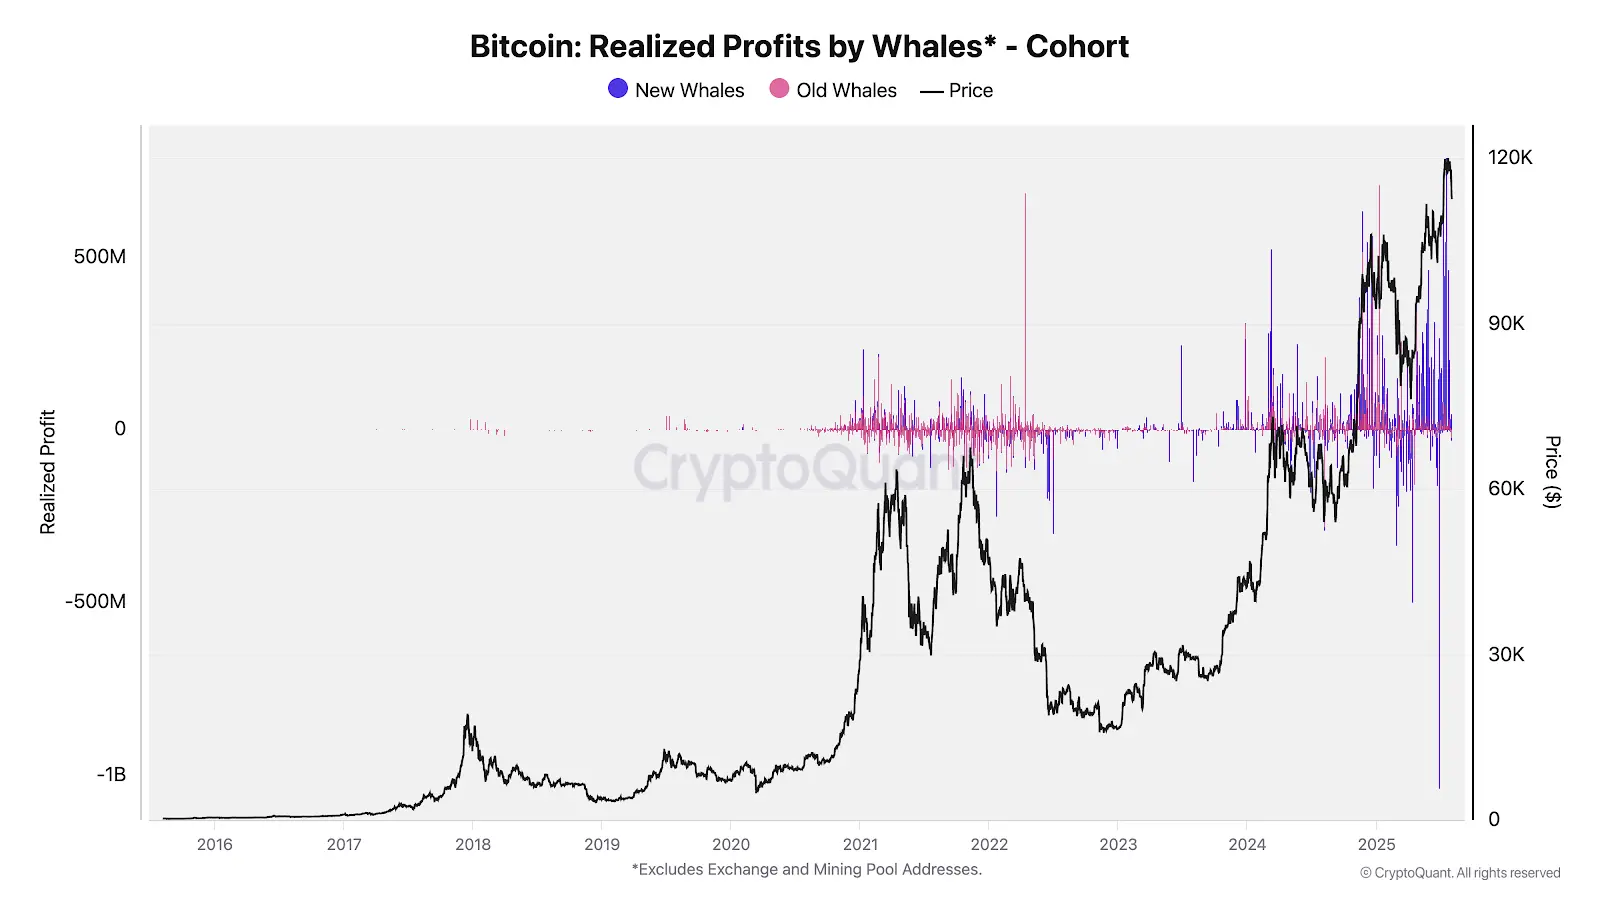
On-chain data reveals the strategic layout of institutional-level funds. CryptoQuant monitoring shows that this bull market has seen three concentrated profit-taking waves from whales:
- March 2024: After the approval of the U.S. spot Bitcoin ETF, $8.5 billion in net inflows stimulated the first round of sell-offs.
- November 2024: Trump's victory pushed BTC above $100,000, triggering the second round of reductions.
- July 2025: After the historic breakthrough of $120,000, "old whales" transferred 80,000 BTC (approximately $9.6 billion) in a single transaction.
These "whale sedimentation" events have all been accompanied by 2-4 months of consolidation periods, serving as a natural cooling valve for the market.
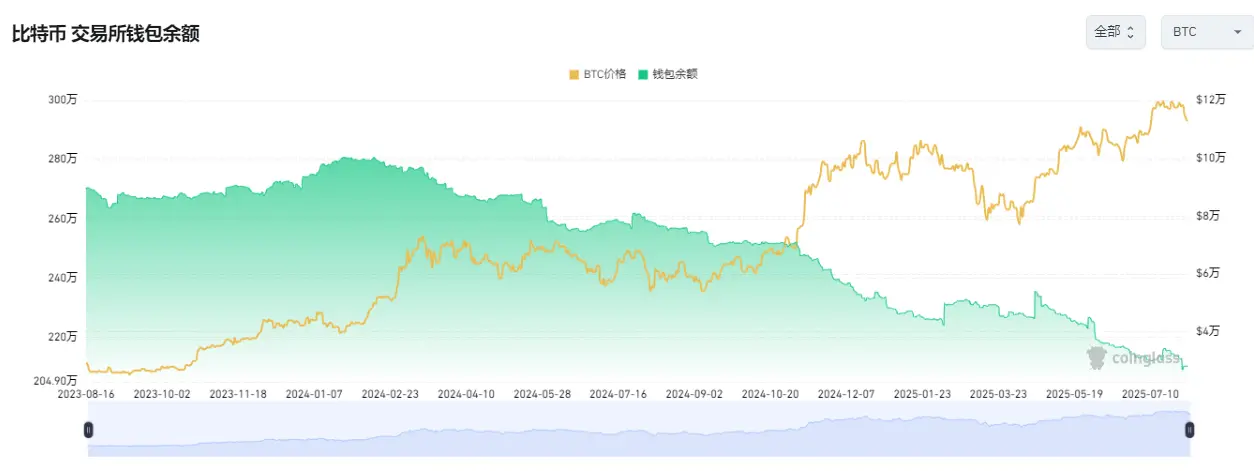
However, current data indicates that giant whales are still accumulating: addresses holding 10-10,000 BTC have increased their holdings by 83,105 BTC over the past 30 days, and exchange balances have dropped to 2.44 million coins (a six-year low), showing a strong reluctance to sell among long-term holders.
3. Macroeconomic and Financial Aspects: Liquidity Tailwind in a Rate Cut Cycle
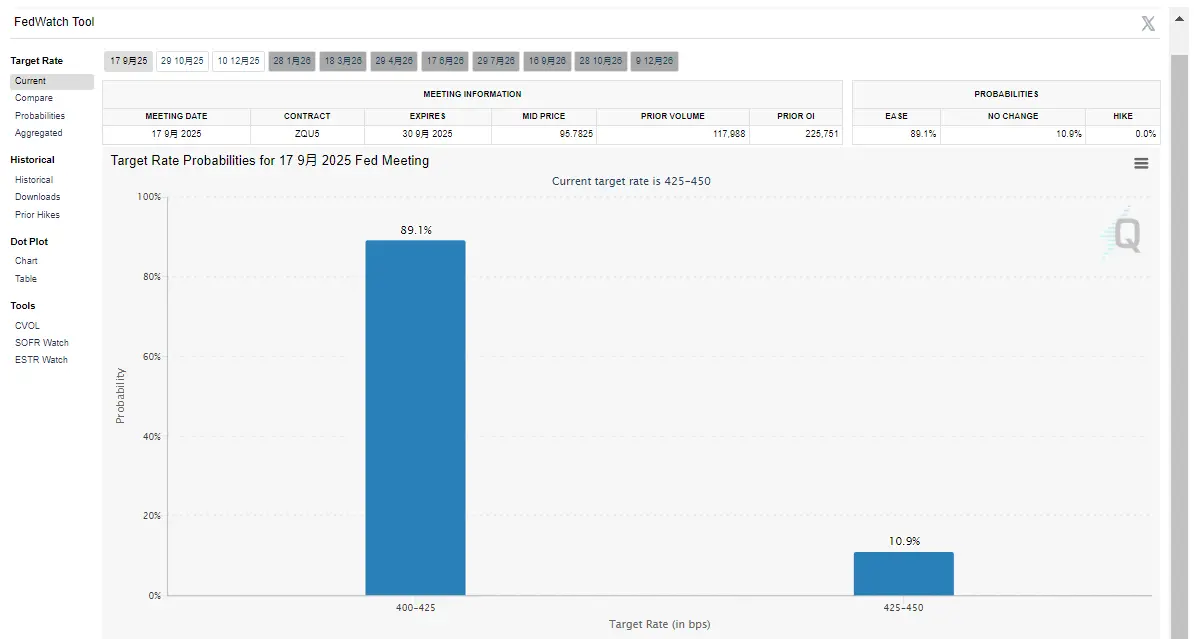
The logic behind Bitcoin's rise is deeply tied to global monetary policy. The U.S. July non-farm payroll data was a "shock" (with only 73,000 new jobs added and the unemployment rate rising to 4.2%), completely reversing market expectations, with the probability of a Fed rate cut in September soaring to 80%. This confirms previous predictions in the Xueqiu column: under the combined effects of $31 trillion in Treasury issuance and a rate cut cycle, Bitcoin will become a beneficiary of the "fiscal dominance" paradigm.
Capital inflows are showing a structural shift:
- ETFs continue to attract capital: The spot Bitcoin ETF saw a net inflow of $2.9 billion over two weeks, with BlackRock holding over 700,000 BTC, and management fee income surpassing that of the S&P 500 ETF.
- Corporate reserve monetization: A Mexican hotel giant invested $500 million to accumulate BTC, while Japan's Metaplanet surpassed 2,200 coins, with traditional industries like healthcare and semiconductors following suit.
- Ethereum ETF's comeback: No outflows for 10 consecutive weeks, with a record monthly inflow of $3.5 billion, and staking yields (annualized at 4%) making it a "digital bond."
4. $150,000 Target: Resonance of Historical Cycles and Technical Patterns
Multiple technical models point to a target range of $140,000 - $150,000:
- Rounded bottom theory: After breaking the neckline at $106,660 on the daily level, the measured target is $140,000 (37% higher than the current price).
- VIX correlation model: When the volatility index is below 18 in a "risk-on" environment, Bitcoin network economist Timothy Peterson predicts a target of $135,000 in the next 100 days (with 95% accuracy).
- Halving cycle pattern: After the fourth halving in May 2024, history shows that a bull market peak will occur within 12-18 months, with October 2025 being a critical time window.
The essential logic supporting these targets lies in Bitcoin's "asset repricing": it has transformed from a speculative fringe asset into a tool for corporate balance sheet allocation. When MicroStrategy holds 190,000 BTC and BlackRock incorporates it into its trillion-dollar asset management empire, Bitcoin's liquidity has surpassed that of gold, becoming the new "standard for corporate reserves."
As mainstream media remains lukewarm and retail investors panic over the non-farm data, savvy capital is seizing the opportunity to position itself. From the filling of the CME gap to the completion of whale handovers, from rising rate cut expectations to the spread of corporate accumulation, the technical and fundamental aspects have formed an upward resonance. If historical patterns repeat, the current volatility may be the final shakeout before Bitcoin hits $150,000.
Recommended Reading:
Weak Non-Farm Data Triggers Trump's Fury, Crypto Market Welcomes "Downward Devil Month"
免责声明:本文章仅代表作者个人观点,不代表本平台的立场和观点。本文章仅供信息分享,不构成对任何人的任何投资建议。用户与作者之间的任何争议,与本平台无关。如网页中刊载的文章或图片涉及侵权,请提供相关的权利证明和身份证明发送邮件到support@aicoin.com,本平台相关工作人员将会进行核查。


