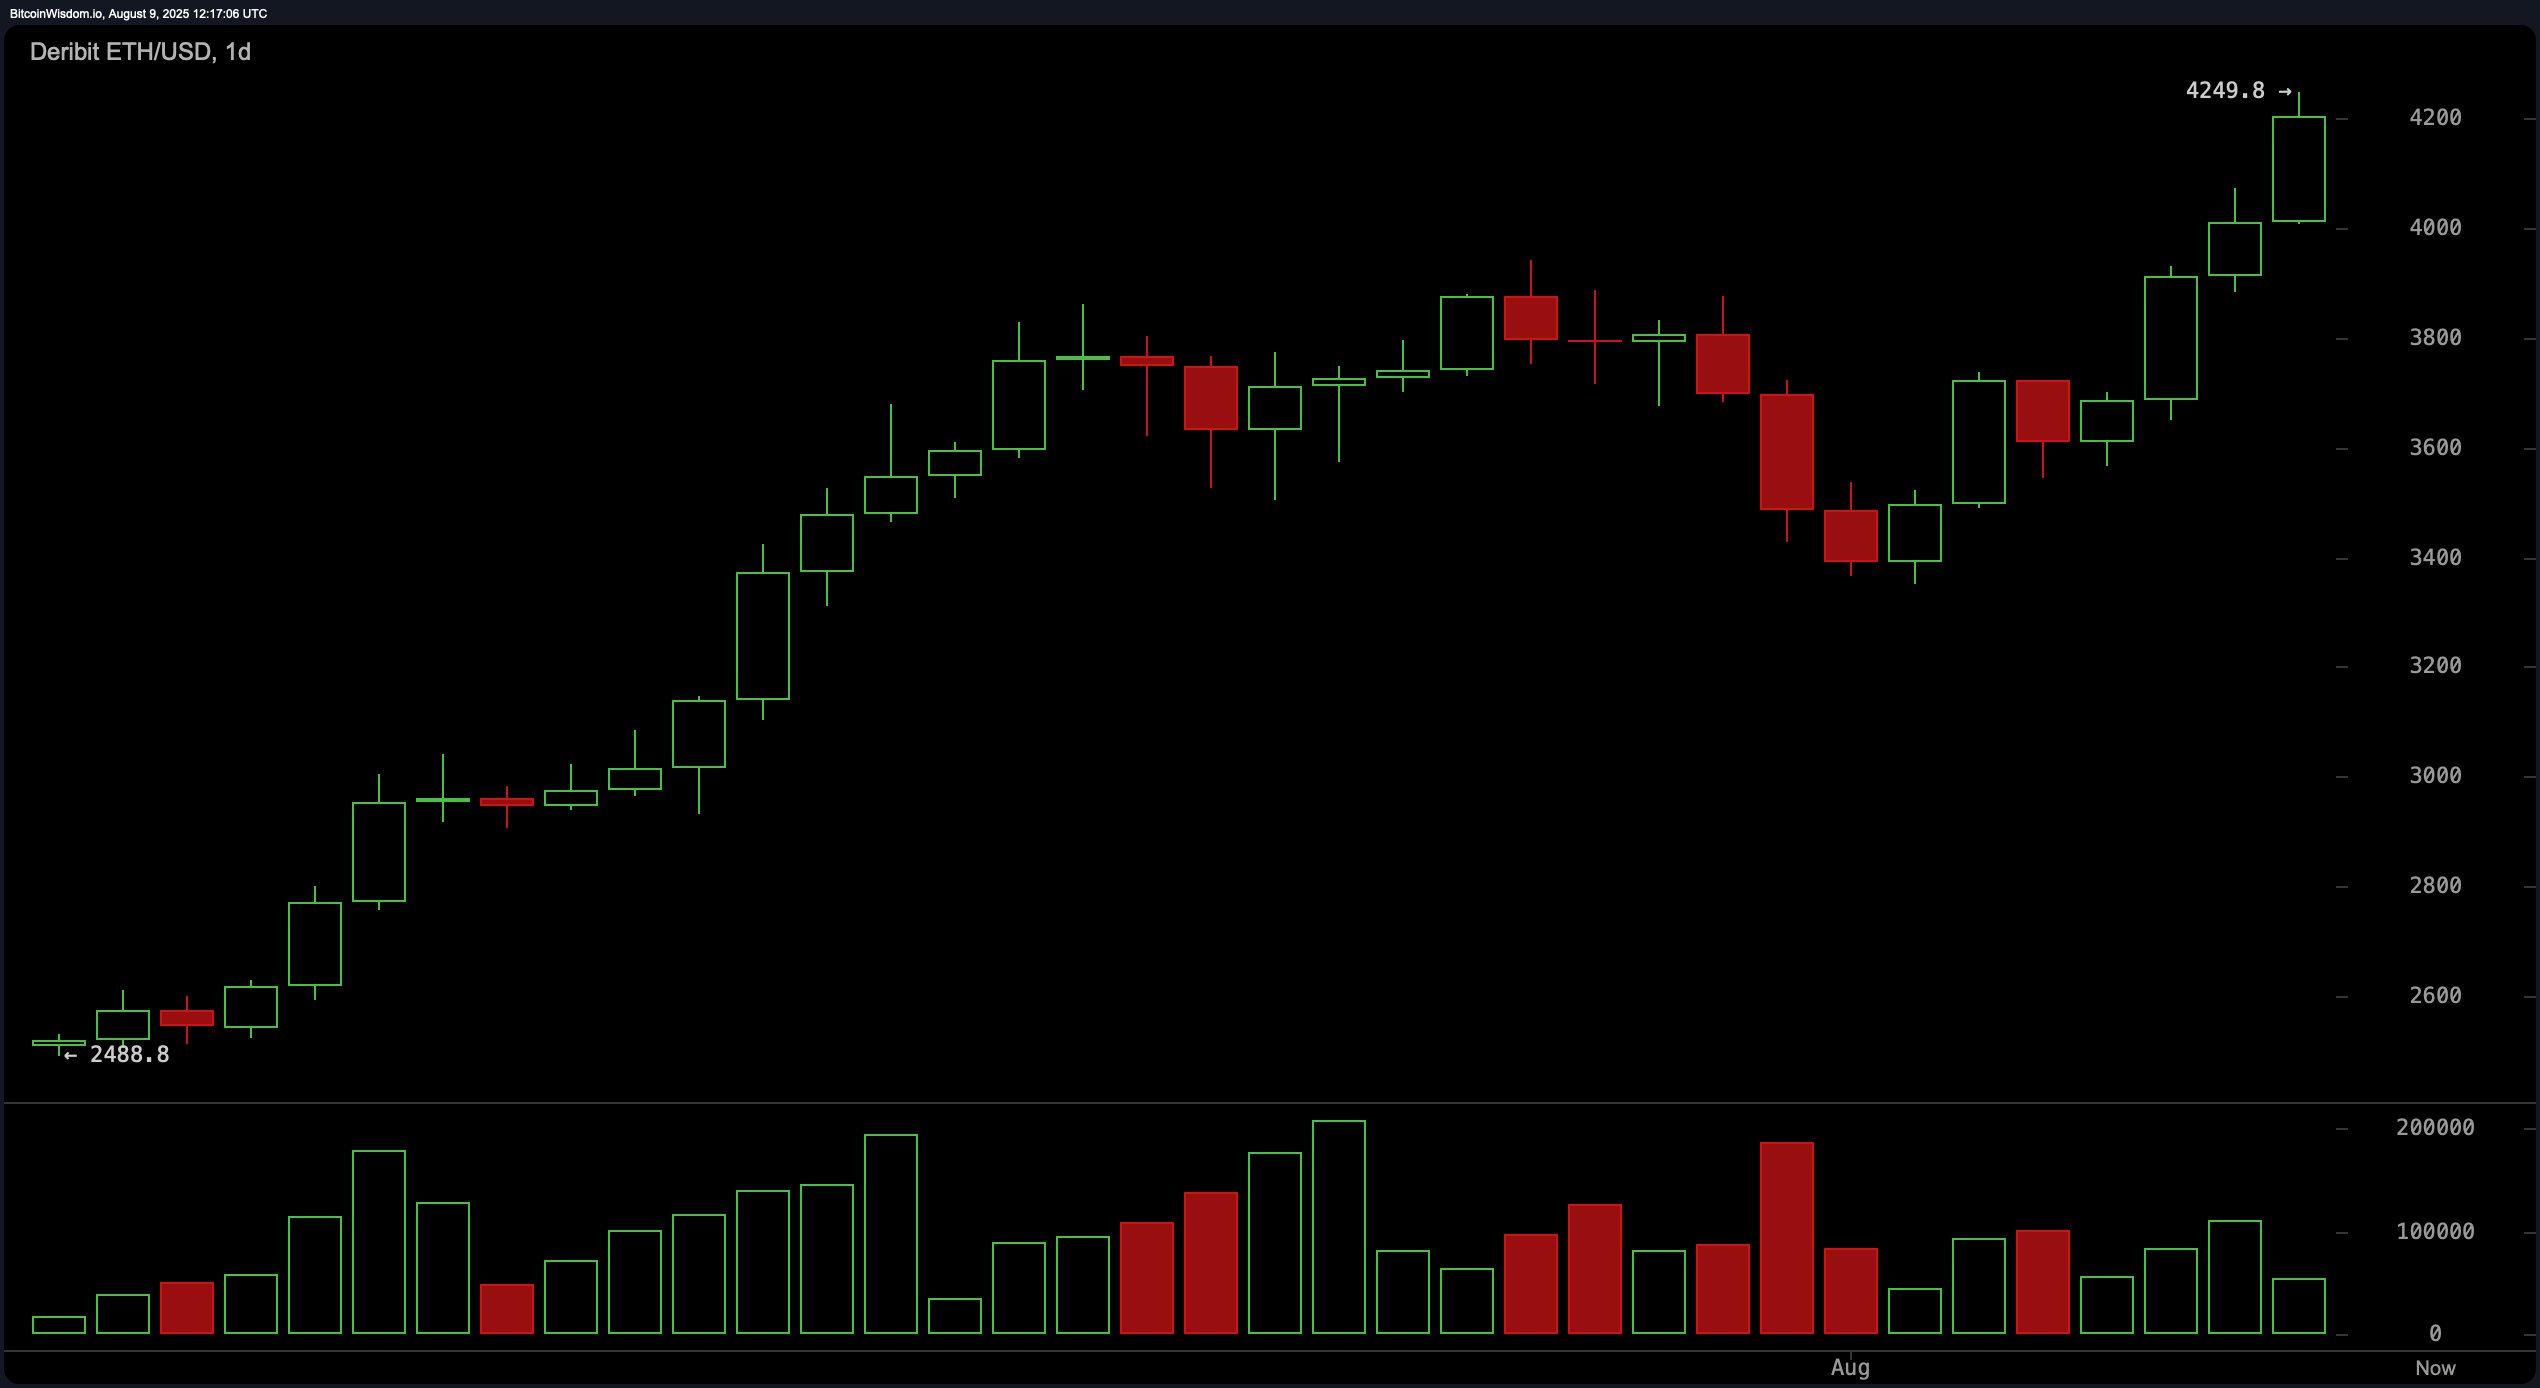
On the daily chart, ethereum has been in a pronounced uptrend from approximately $2,488 to $4,249, with only a moderate pullback during the run. The recent breakout above the prior $4,100 resistance came on a strong bullish candle, signaling aggressive buying interest. Volume spikes during previous pullbacks suggest accumulation by market participants, reinforcing the strength of the trend. The $4,300 to $4,350 range presents immediate psychological resistance, while a clean continuation could set the next significant target at $4,500.

ETH/USD 1-day chart via Deribit on Aug. 9, 2025.
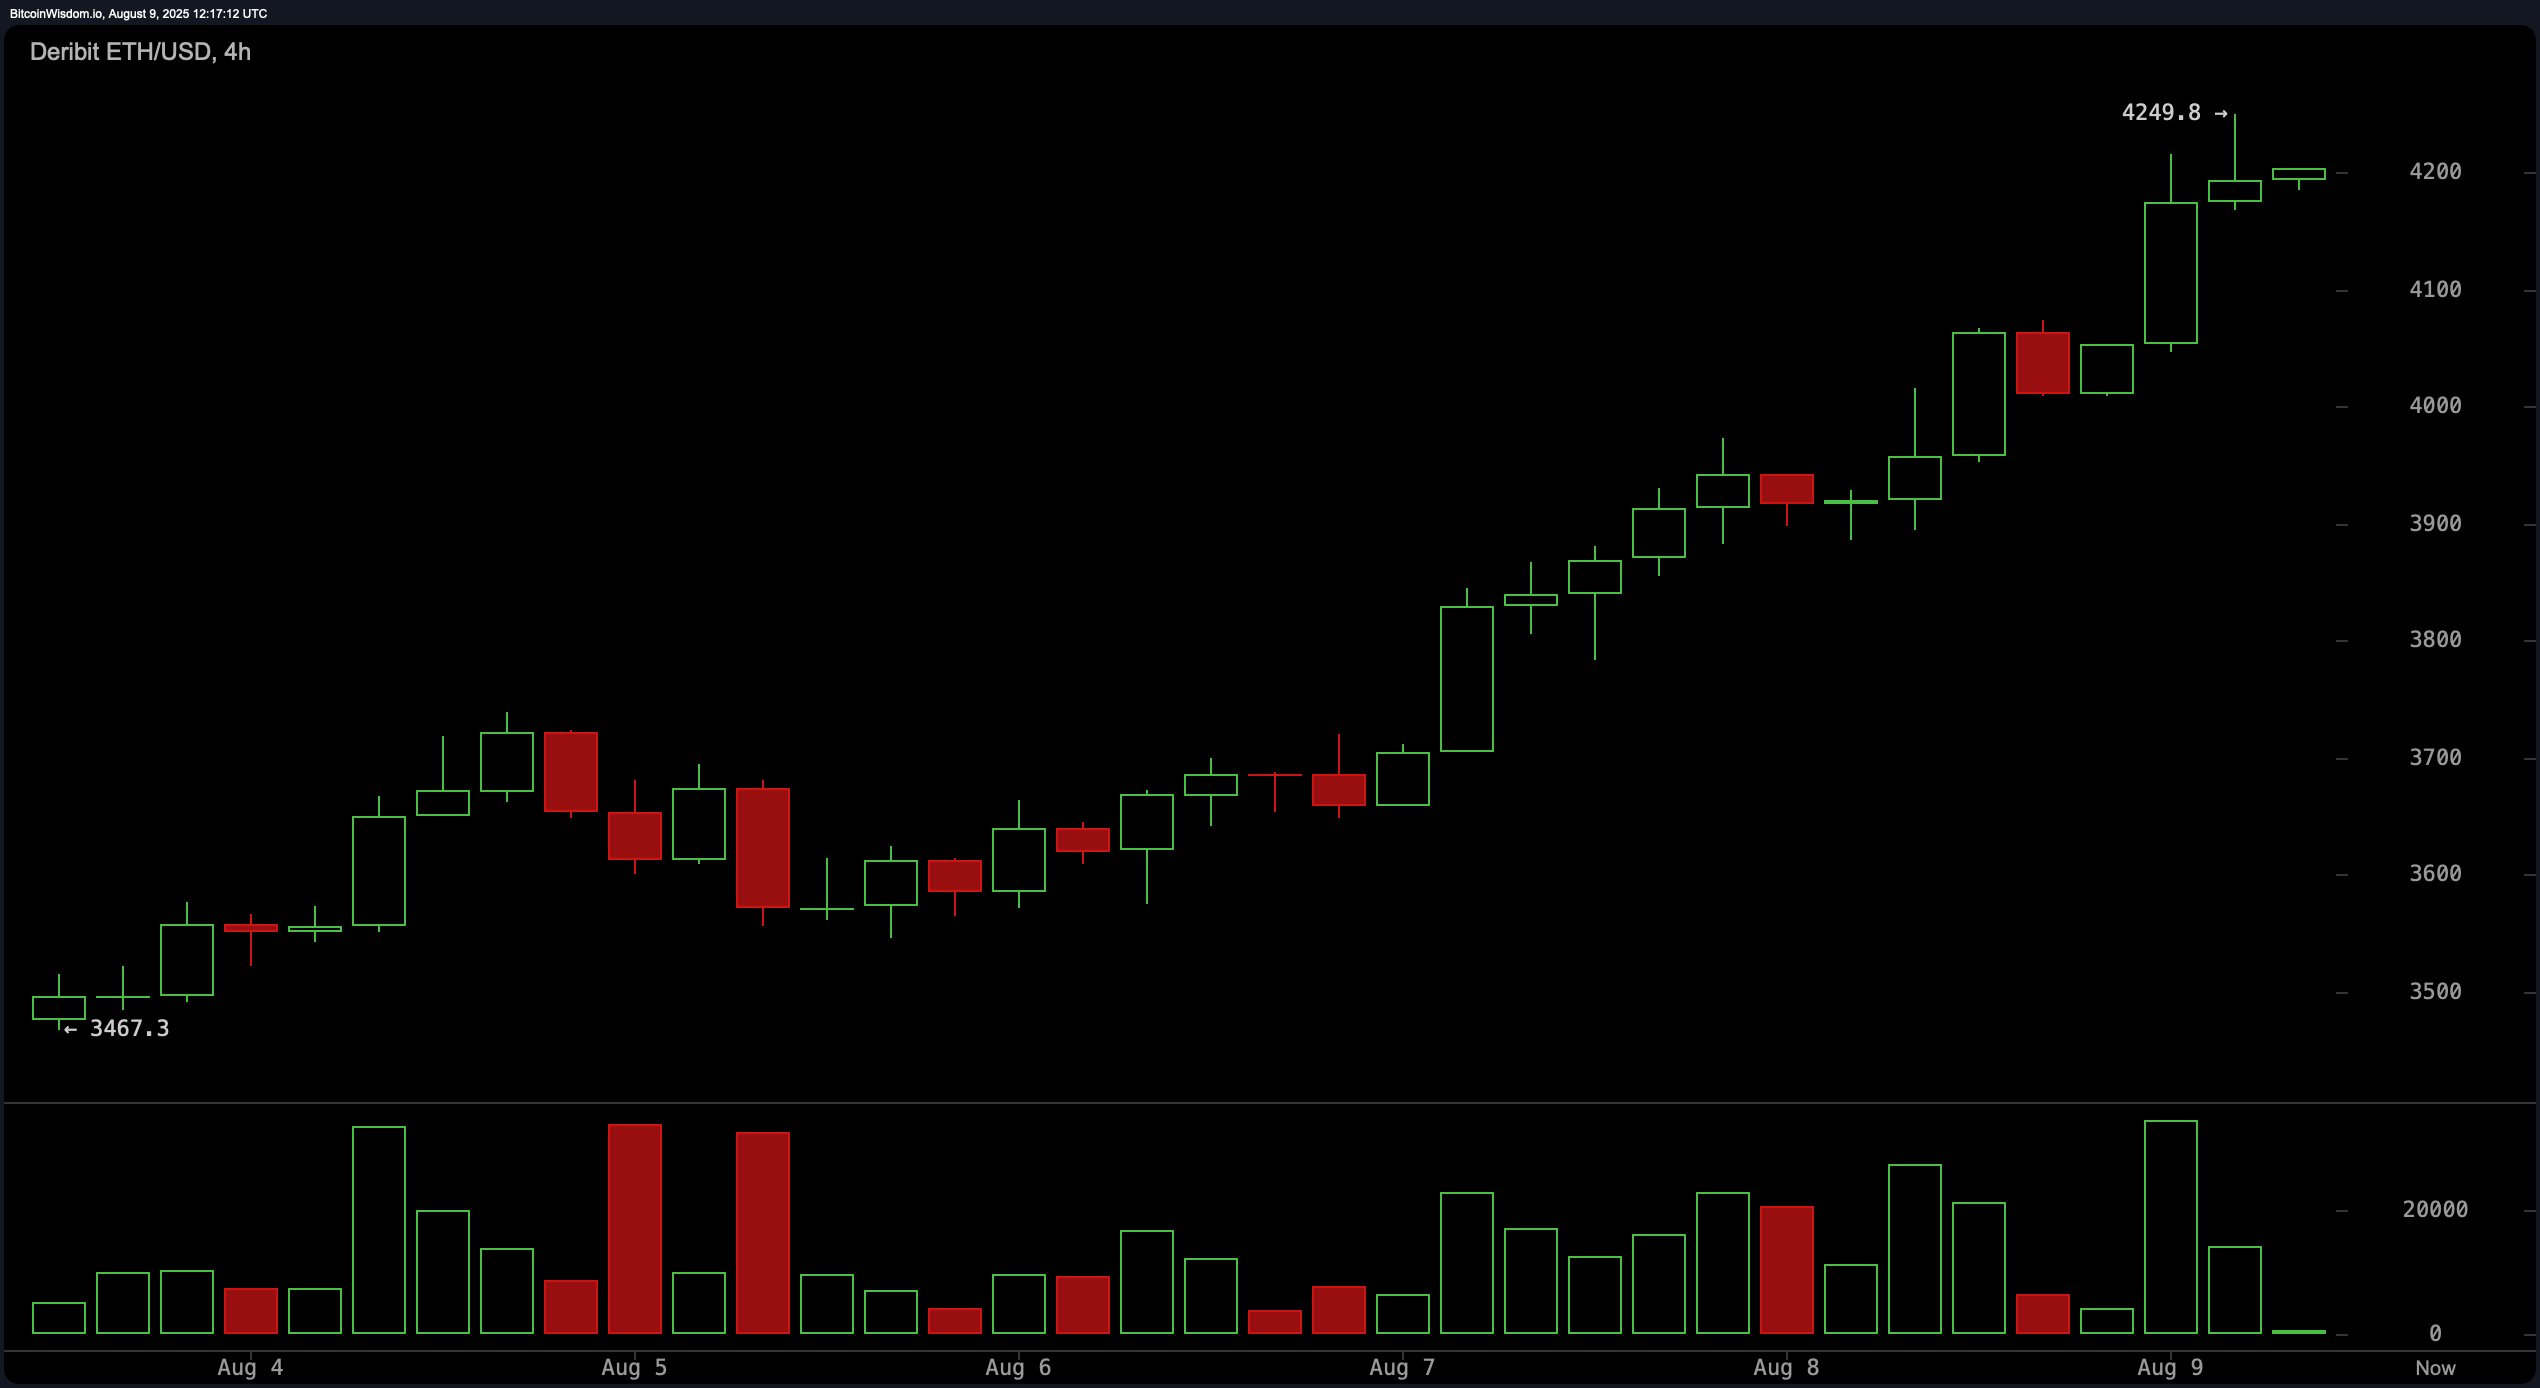
The 4-hour ether chart shows a consistent sequence of higher highs and higher lows since August 6, underscoring the persistence of buying pressure. Since the breakout on August 7, bullish volume has outweighed selling, although the latest candles reveal smaller bodies, pointing to a short-term pause or consolidation phase. A pullback toward the $4,150 to $4,200 zone may serve as a healthy re-entry point for traders, but a sustained break below $4,150 could indicate short-term weakness.

ETH/USD 4-hour chart via Deribit on Aug. 9, 2025.
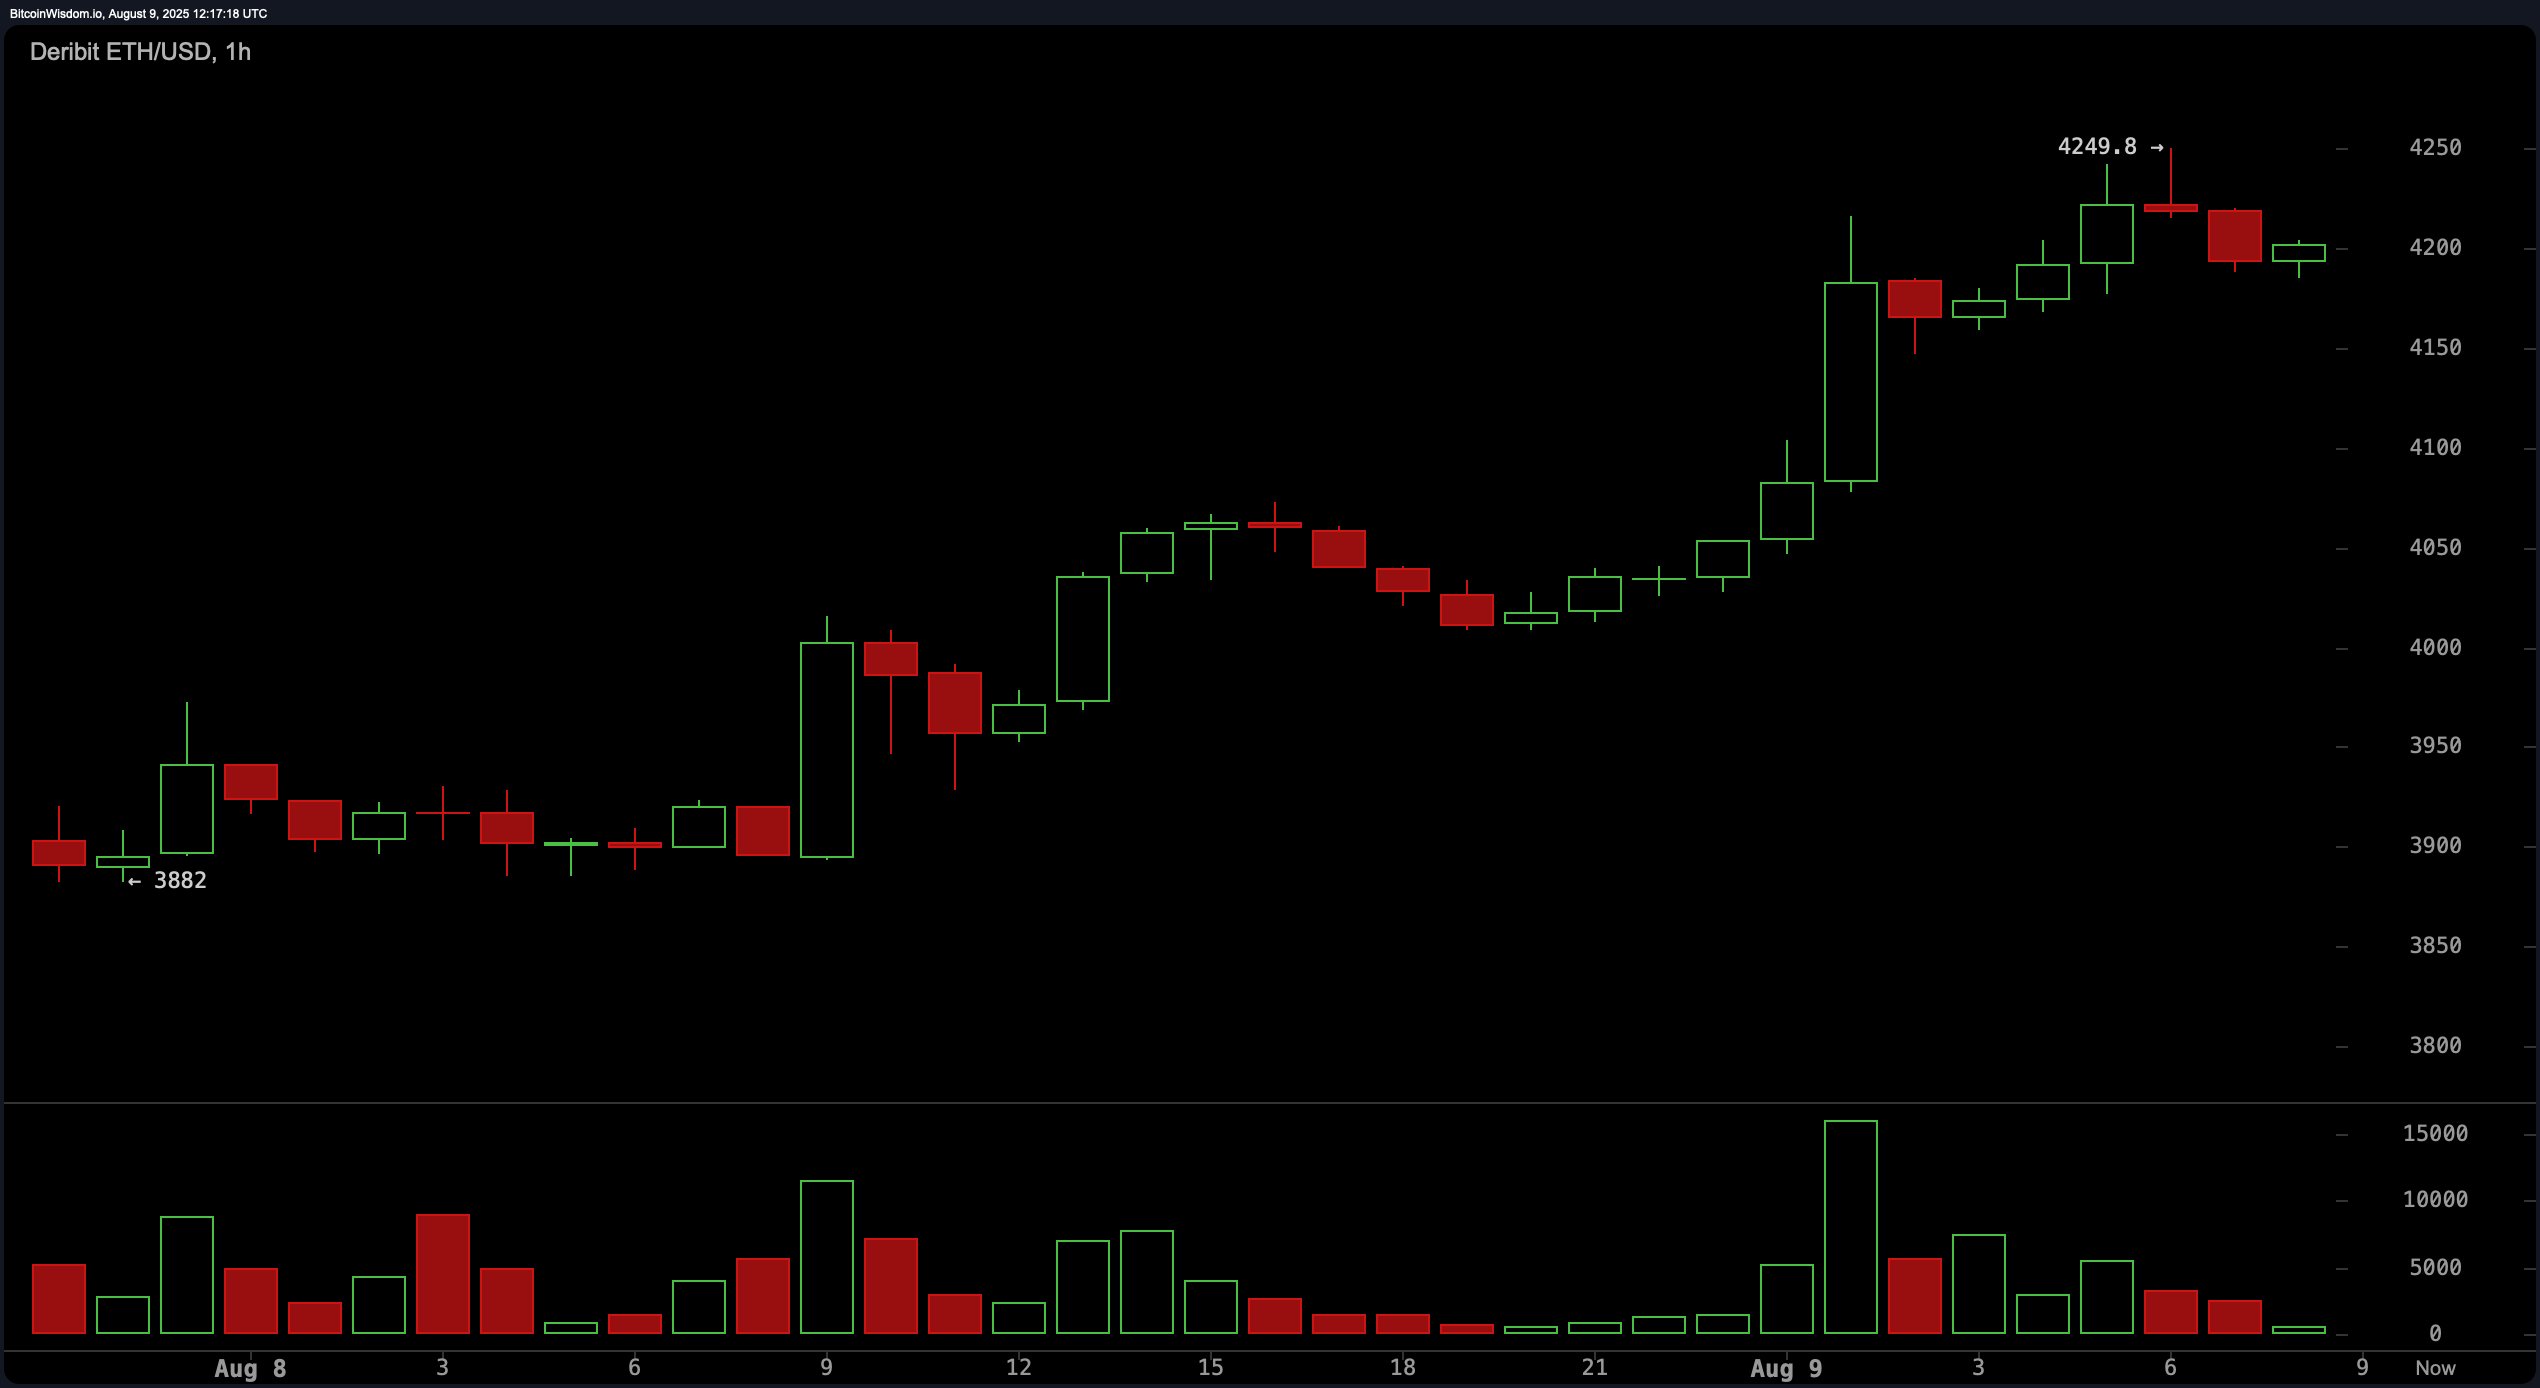
On the 1-hour chart, ethereum rallied sharply from around $4,050 to $4,249 before easing into a mild retracement. The breakout to $4,249 was marked by a large volume spike, followed by tapering activity, suggesting that selling pressure is not yet dominant. Should the price reclaim $4,230 with strong volume, a push toward $4,300 is possible; conversely, a drop under $4,180 with conviction could prompt a retest of the $4,100 level.

ETH/USD 1-hour chart via Deribit on Aug. 9, 2025.
From an indicator standpoint, most oscillators are in a neutral stance: relative strength index (RSI) at 72.2, stochastic at 93.7, commodity channel index (CCI) at 236.6, average directional index (ADX) at 40.0, and awesome oscillator at 372.4. Momentum reads at 390.4 with a bullish signal, and the moving average convergence divergence (MACD) level at 197.3 also signals buying strength. Across all moving averages — from the exponential moving average (EMA) 10 at $3,825.1 to the simple moving average (SMA) 200 at $2,515.0 — the action remains bullish, reinforcing the broader uptrend’s credibility.
Overall, ethereum remains in a favorable technical posture, with bullish momentum dominant across all major timeframes, albeit with some near-term resistance. Traders seeking fresh positions may benefit from patience, waiting for either a confirmed breakout above $4,250 with high volume or a constructive pullback into the $4,100–$4,150 support range. For those already long, partial profit-taking above $4,250, coupled with protective stops just below $4,150, appears to be the prudent approach in the current market environment.
Bull Verdict:
Ethereum maintains a strong bullish structure across all timeframes, supported by buy signals from momentum and the moving average convergence divergence (MACD), as well as sustained strength in all key moving averages. A breakout above $4,250 with volume could trigger a continuation toward $4,300 and potentially $4,500, keeping the uptrend intact.
Bear Verdict:
Despite the prevailing uptrend, ethereum is consolidating near a resistance zone, with oscillators in overbought territory. A failure to hold above $4,150, particularly if selling volume increases, could open the door to a deeper pullback toward $4,100 or lower, signaling a short-term loss of bullish momentum.
免责声明:本文章仅代表作者个人观点,不代表本平台的立场和观点。本文章仅供信息分享,不构成对任何人的任何投资建议。用户与作者之间的任何争议,与本平台无关。如网页中刊载的文章或图片涉及侵权,请提供相关的权利证明和身份证明发送邮件到support@aicoin.com,本平台相关工作人员将会进行核查。


