
Bitcoin's weekly line is about to close. Currently, it looks like there is a chance for a rebound next week after a bearish candle, potentially reaching the previous high or even breaking through it. The weekly MACD continues to turn upwards with no significant volume increase. On the daily chart, the price broke through the rising flag pattern, reaching 118,798 and staying above the MA20. Pay attention to the potential crossover of the fast and slow lines on the MACD next week as it crosses the zero axis. The next resistance points are at 121,000 and the previous high.
Ethereum broke through 4,100 yesterday and today closed with a doji star, reaching a high of 4,332. The daily Bollinger Bands are opening up. As long as it doesn't drop back below 3,950, it remains bullish. The MACD for Ethereum has crossed the zero axis with the fast and slow lines. Pay attention to the weekly close tomorrow morning. The large triangular pattern on the weekly chart is seen as the starting point for the third wave, with a proportional rise targeting 6,700, but the recent resistance point is at 4,868.
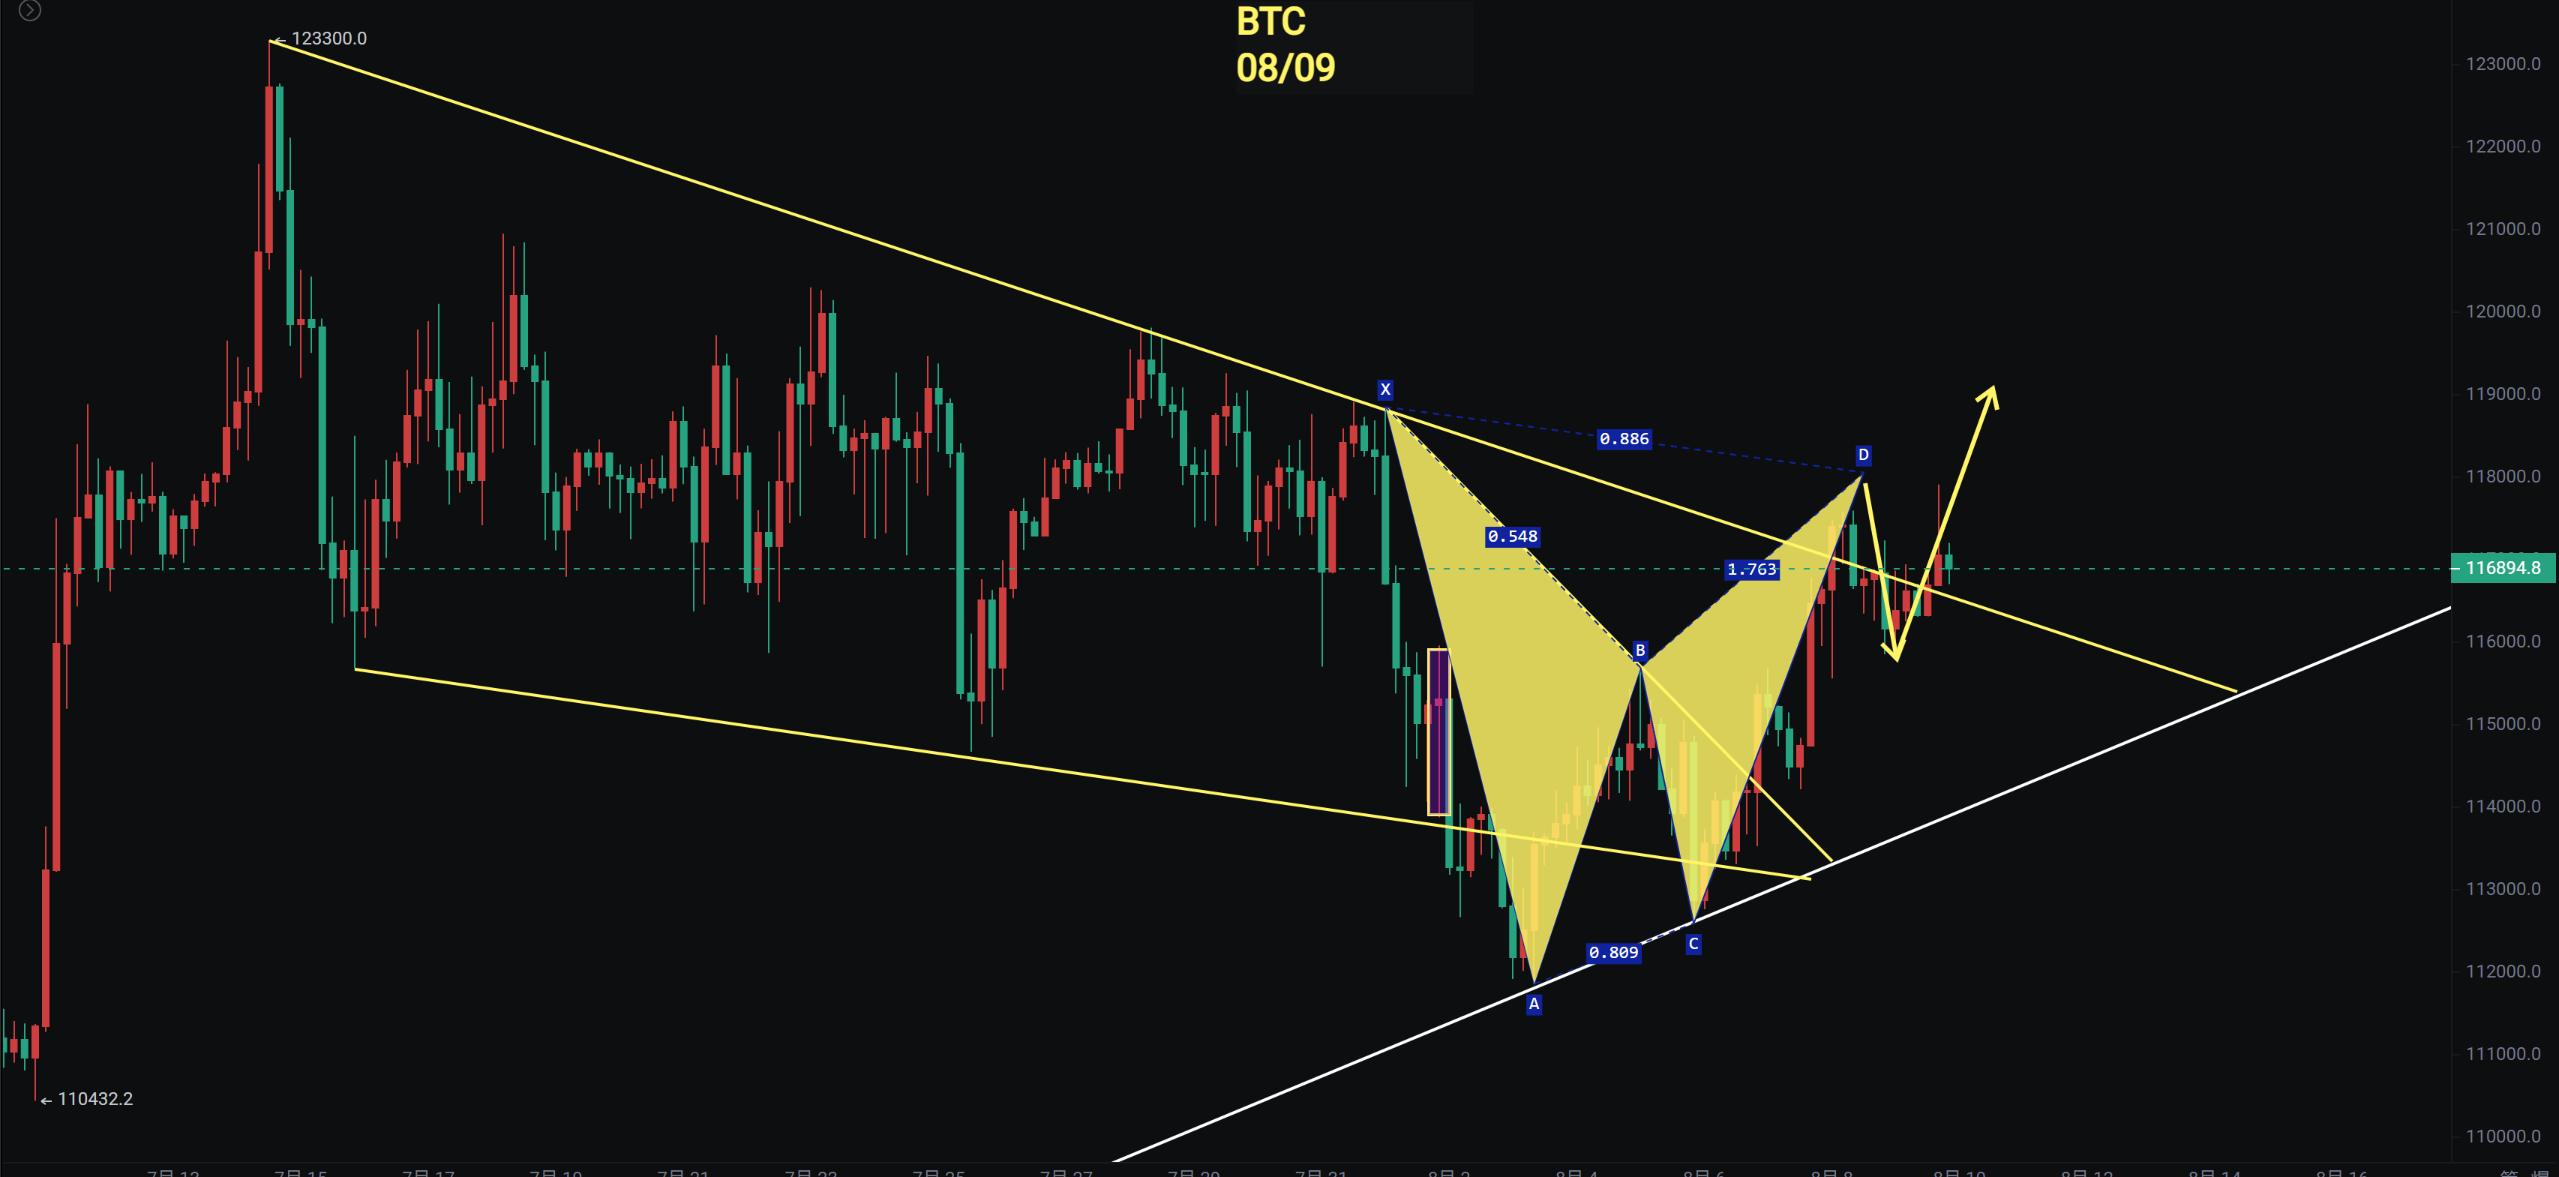
Bitcoin
The daily chart for Bitcoin is showing a descending wedge and a bullish flag breakout as expected, with the price staying above the MA20, continuing the rebound trend. The gentleman reminded a few days ago to first pay attention to the 4-hour level triangle breakout, which then broke through 116,000 and retraced to a harmonic pattern targeting 118,000, which has been completed.
The next resistance level is at 121,000, followed by the pressure from the previous high. If it breaks through strongly, there is a chance to reach 135,000, which is also the price level the gentleman has been looking at for the past month or two. Congratulations to those who believe in and follow the gentleman.
Support: 116,000 to 116,800
Resistance: 121,000 to 123,000
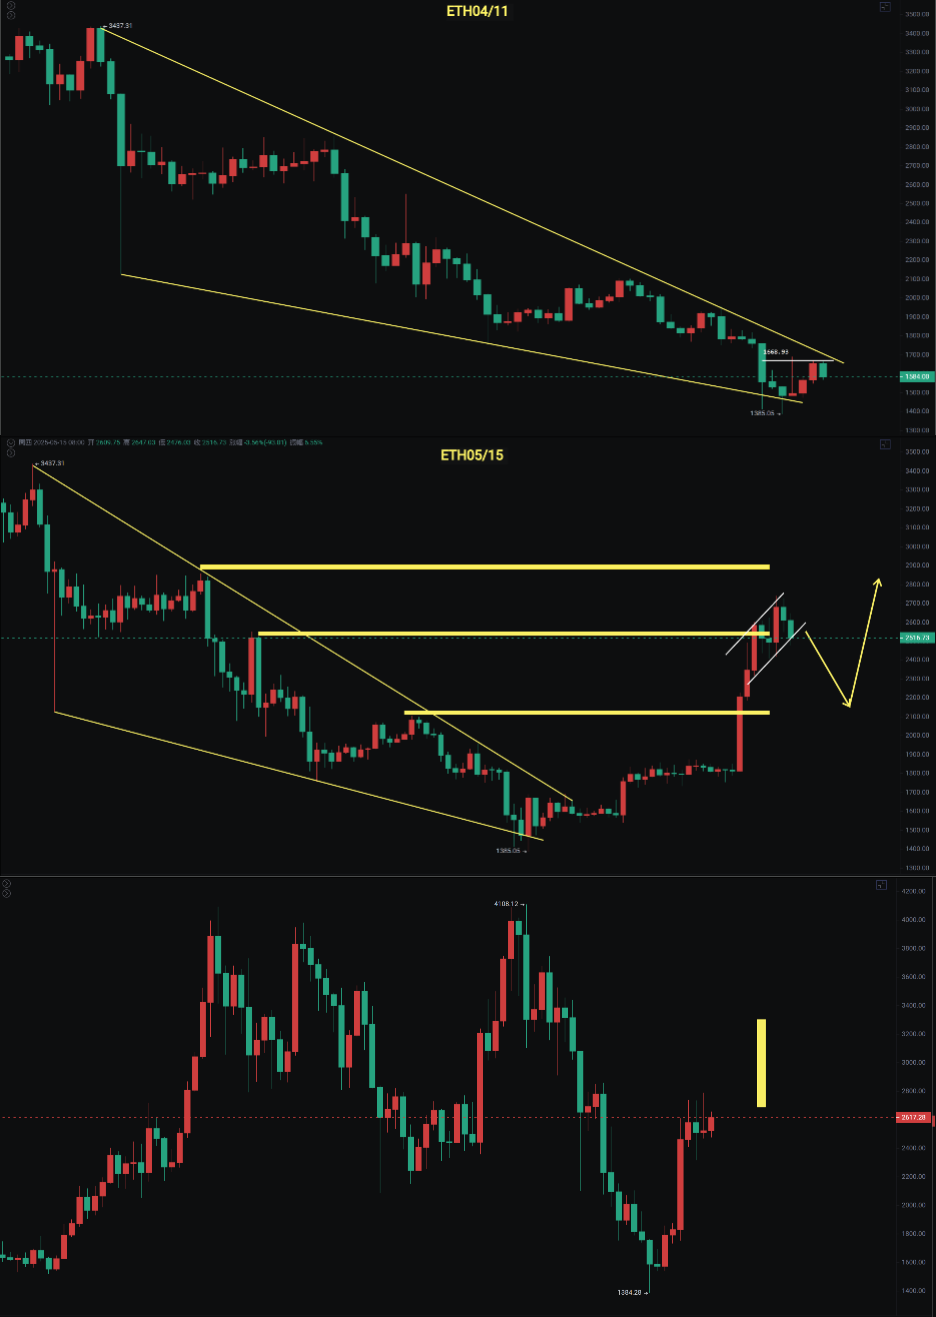
Ethereum
Ethereum broke through the stage high of 4,100, reaching a maximum of 4,332. Today, the probability of closing with a doji star is high, but so far there has been no significant volume increase. The daily MACD has crossed the zero axis with the fast and slow lines, and the weekly chart is gaining momentum. Additionally, the monthly chart shows a bottom divergence turning red. As long as the price does not drop back below 3,950, the trend remains unchanged. Just hold on patiently.
Support: 3,800 to 3,950
Resistance: 4,500 to 4,868
If you like my views, please like, comment, and share. Let's navigate through the bull and bear markets together!!!
The article is time-sensitive and for reference only, with real-time updates.
Focusing on candlestick technical research, sharing global investment opportunities. Official account: BTC Trading Gentleman Fusu

免责声明:本文章仅代表作者个人观点,不代表本平台的立场和观点。本文章仅供信息分享,不构成对任何人的任何投资建议。用户与作者之间的任何争议,与本平台无关。如网页中刊载的文章或图片涉及侵权,请提供相关的权利证明和身份证明发送邮件到support@aicoin.com,本平台相关工作人员将会进行核查。


