The fluctuations in the cryptocurrency market are like the waves in a turbulent sea, making people feel anxious. However, its charm lies in the fact that it never looks at your past report card. Stop saying "I'll enter the market when it stabilizes"; opportunities in the crypto world never lie in "stability." The real dividends always belong to those who dare to position themselves amid uncertainty. Market volatility is not a risk; failing to understand trends is the biggest risk.
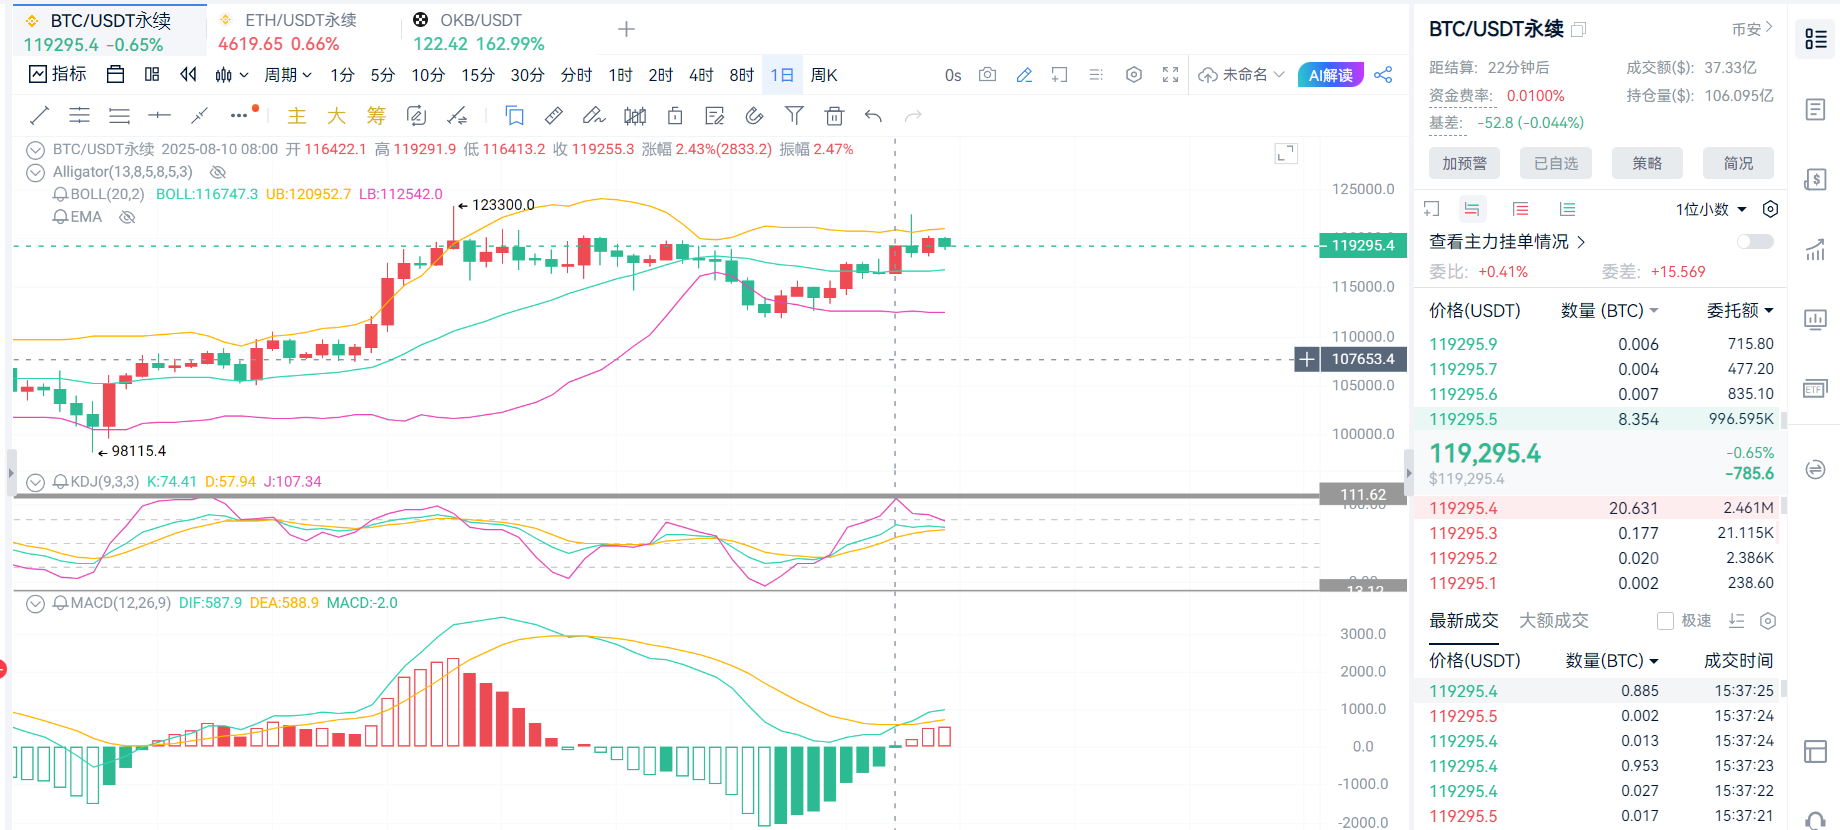
Bitcoin's intraday fluctuations are between $118,000 and $120,800, with the current price around $119,300, showing a high-level consolidation pattern. It has slightly retreated from the historical high of $122,000 that broke on August 11 but remains in an upward channel. Corporate treasury and ETF funds continue to flow in, such as the Trump Media Group establishing a Bitcoin treasury through private financing of $2.4 billion. Although the inflow of spot Bitcoin ETF funds has slowed, long-term support remains.
From a technical perspective, the daily chart has broken the descending triangle pattern, and the RSI indicator has retreated from the overbought area to the neutral zone, indicating that bullish momentum still exists but needs to digest short-term profit-taking. Recent support is around $118,000, with resistance in the $120,000 to $122,000 range. Currently, it is recommended to focus on low long positions, mainly around $118,000.
Long position operation range suggestion: If it stabilizes after a pullback to $118,500-$119,000, you can try a light long position with a stop loss at $118,000 and a target of $120,500-$121,000.
Short position operation range suggestion: If it rebounds to $120,800-$121,200 and faces resistance, combined with a signal of shrinking trading volume, you can try a short position with a stop loss at $121,500 and a target of $119,500-$119,000.
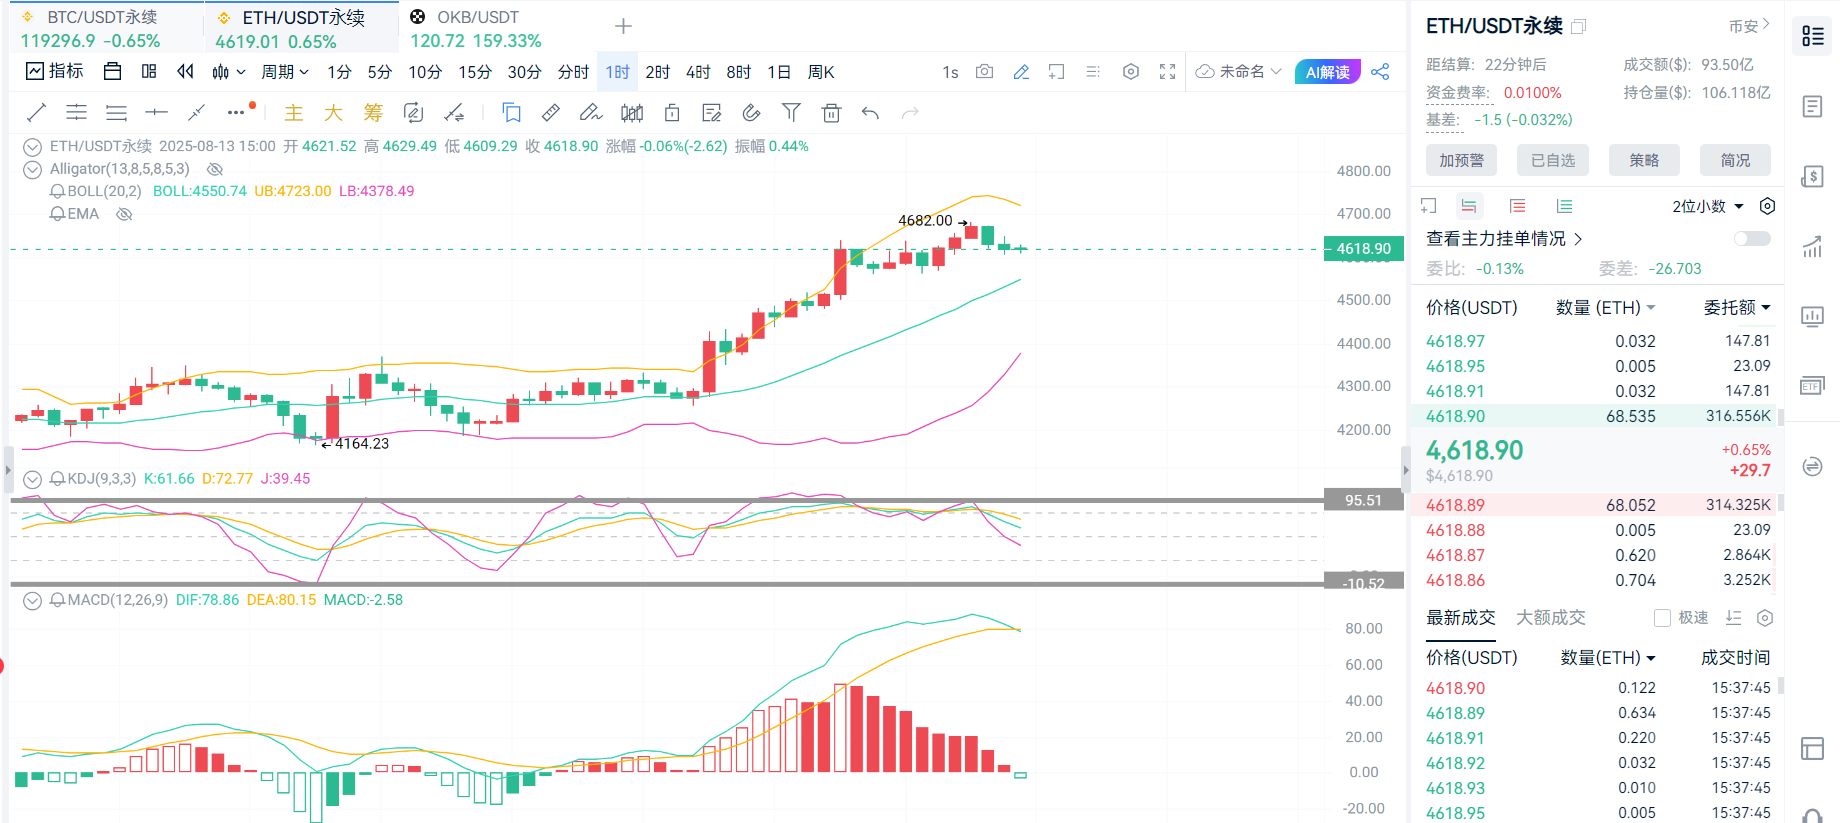
Ethereum's current price is around $4,620, reaching a new high since December 2021, with an increase of over 70% from the July low. The driving factor still comes from institutions hoarding coins, such as Bitmine Immersion and other companies announcing a $20 billion stock issuance to purchase Ethereum, with their holdings accounting for 1% of the total circulation. Meanwhile, the net inflow of spot Ethereum ETF has exceeded $1 billion for the first time in a single day. Currently, the market sentiment's fear and greed index has risen to 62 (in the greed zone), and the trend of funds rotating from Bitcoin to Ethereum is significant.
From a technical perspective, the Bollinger Bands on the 1-hour chart are starting to converge, the KDJ is in the overbought zone, and the MACD red histogram's momentum has been released, with green momentum beginning to show. There may be a risk of a pullback in the short term, but considering the recent increase, the pullback should not be too strong; it should be to accumulate strength for the next surge.
Long position operation range suggestion: If the price pulls back to around $4,550 and does not form a valid downward move, you can try a light long position with a target of $4,700 and a stop loss at $4,500.
Short position operation range suggestion: It is not recommended to short for now; if it unexpectedly drops below $4,500 and the RSI is less than 40, you can try a light short position with a stop loss at $4,550 and a target of $4,300.
Bitcoin and Ethereum maintain strength under the push of institutional funds and macro narratives, but in the short term, attention should be paid to the risk of technical corrections. Bitcoin can rely on the support at $118,000 for low-positioning, while Ethereum should focus on the support at $4,500 and the breakout signal at $4,600. Investors should maintain diversified positions, avoid excessive leverage, and closely monitor Federal Reserve policies, ETF fund flows, and on-chain data changes.
Due to the timeliness of price points, there may be delays in post reviews; specific operations should still be based on real-time market conditions. The above operation range analysis is for reference only; the cryptocurrency market is highly risky, so please manage your risk well and make cautious decisions when investing. If you are interested in specific indicator analysis or the impact of new market dynamics on prices, feel free to scan the QR code for the public account in the article below; you are welcome to visit.

Warm reminder: The content of the above article is original by the author, and the advertisements at the end of the article and in the comments section are unrelated to the author; please be cautious!
免责声明:本文章仅代表作者个人观点,不代表本平台的立场和观点。本文章仅供信息分享,不构成对任何人的任何投资建议。用户与作者之间的任何争议,与本平台无关。如网页中刊载的文章或图片涉及侵权,请提供相关的权利证明和身份证明发送邮件到support@aicoin.com,本平台相关工作人员将会进行核查。


