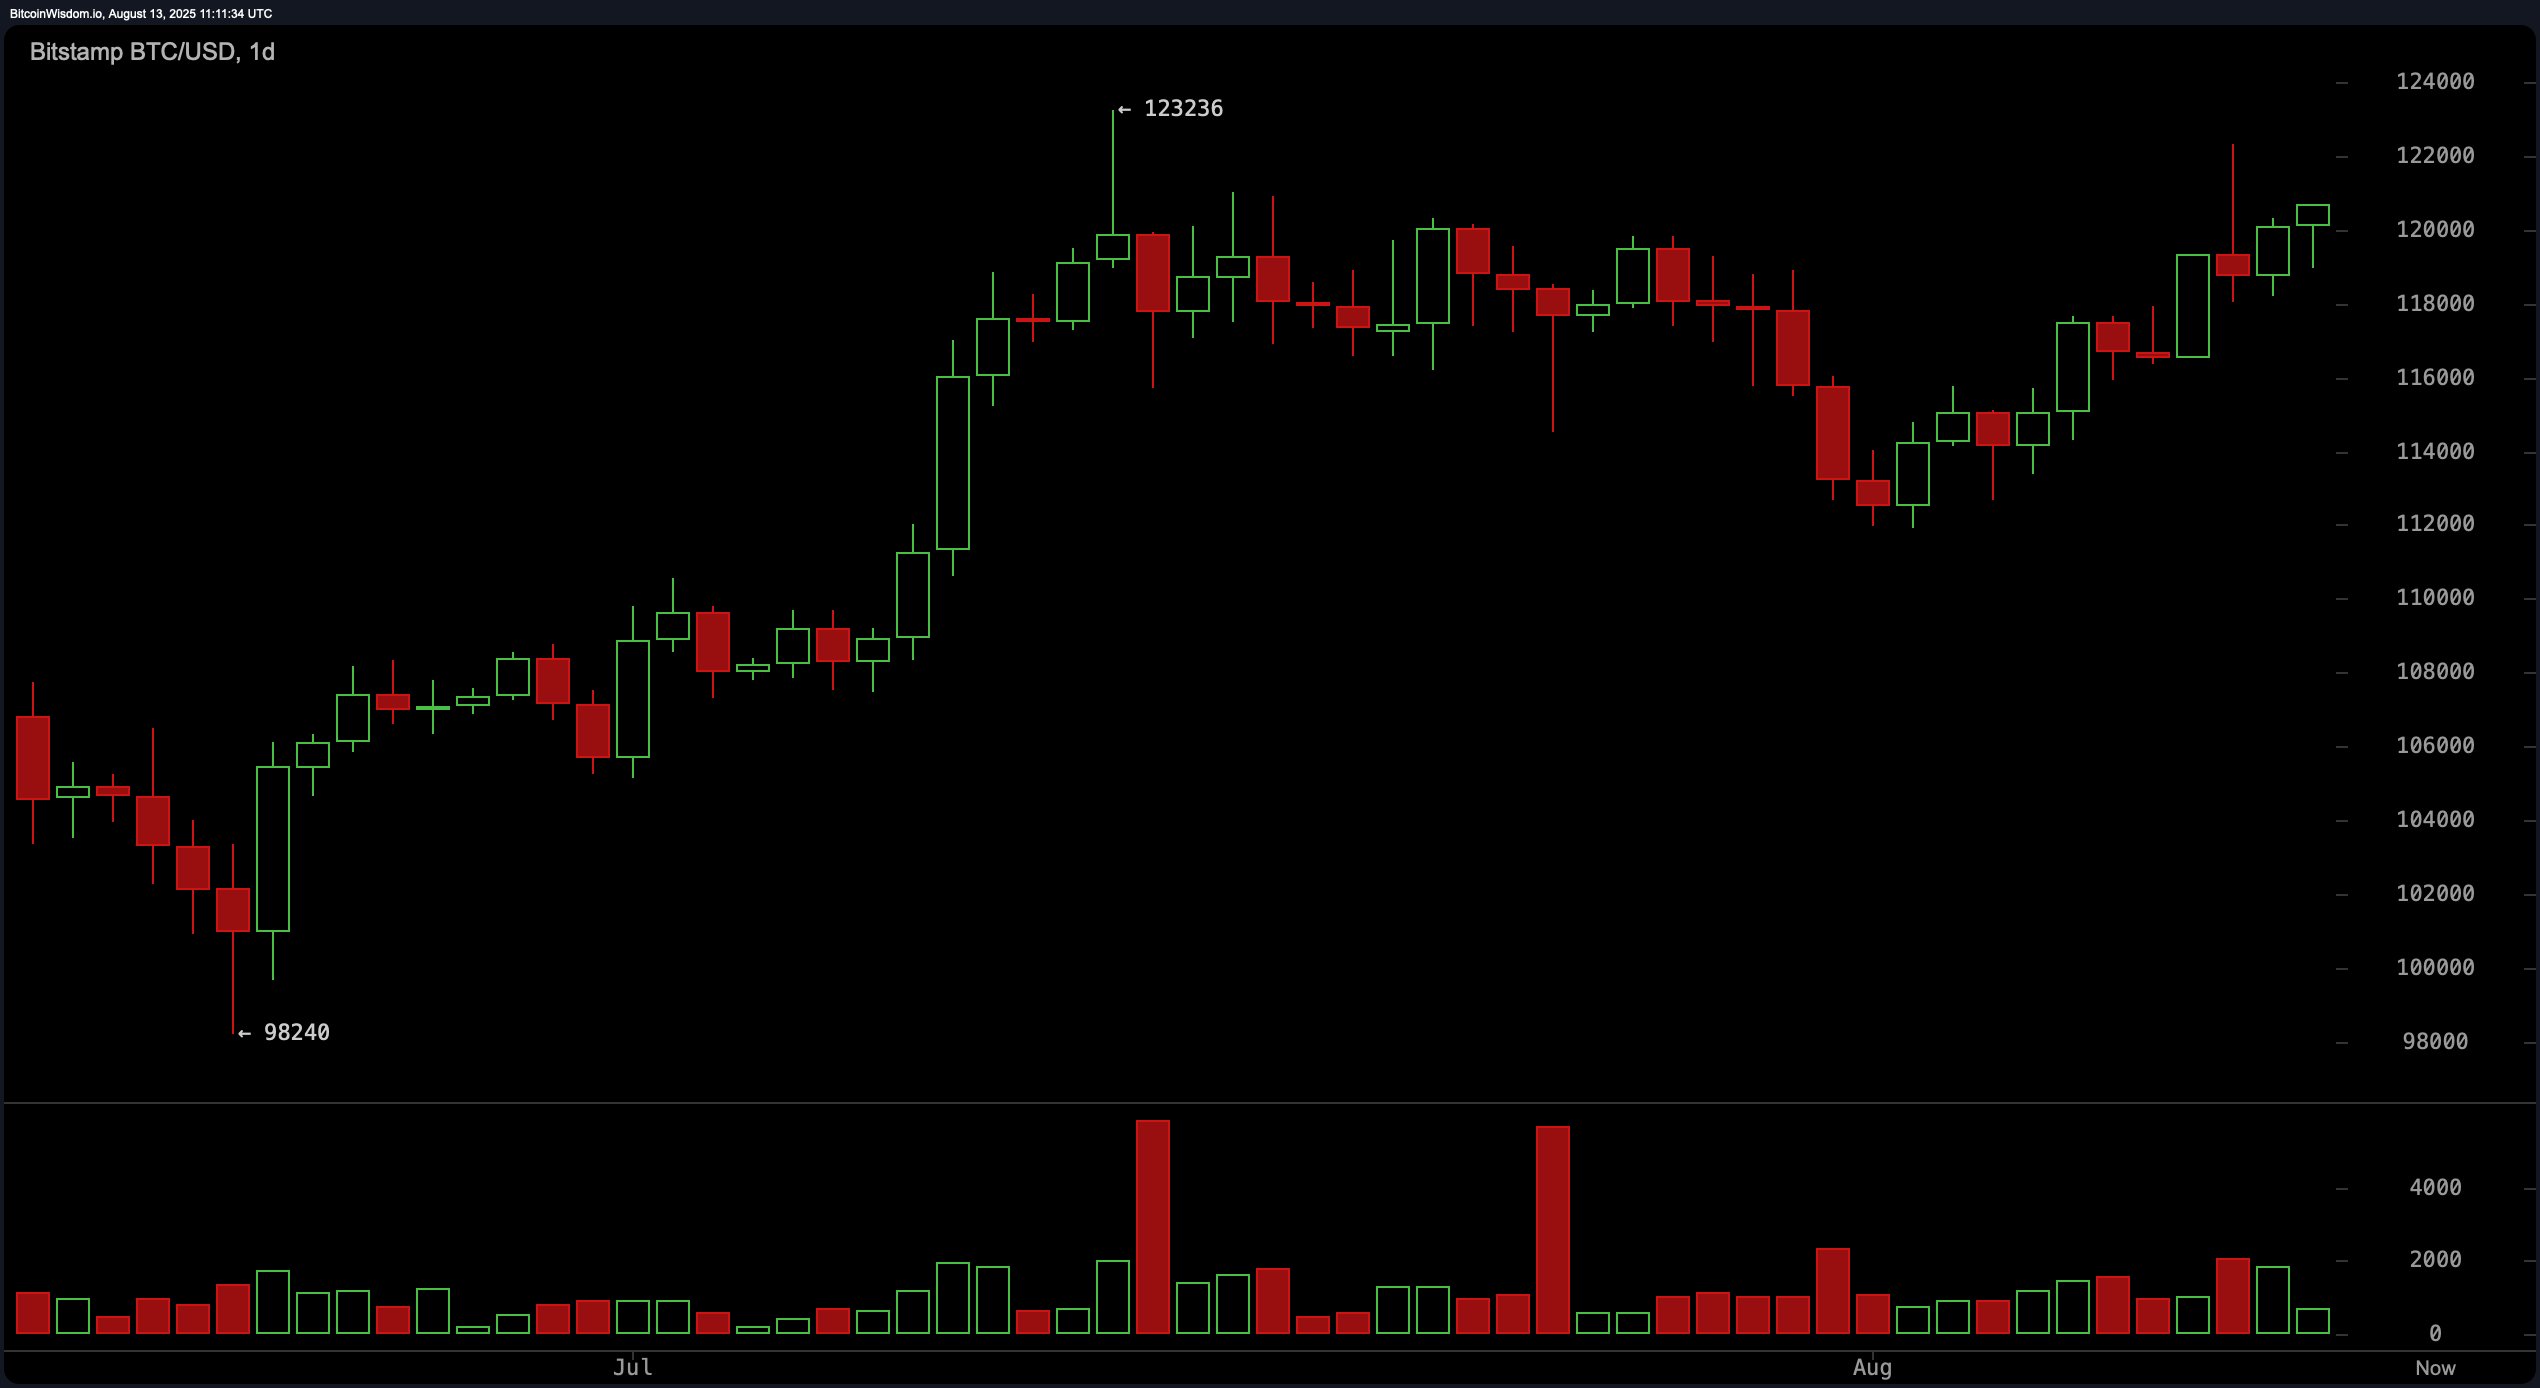
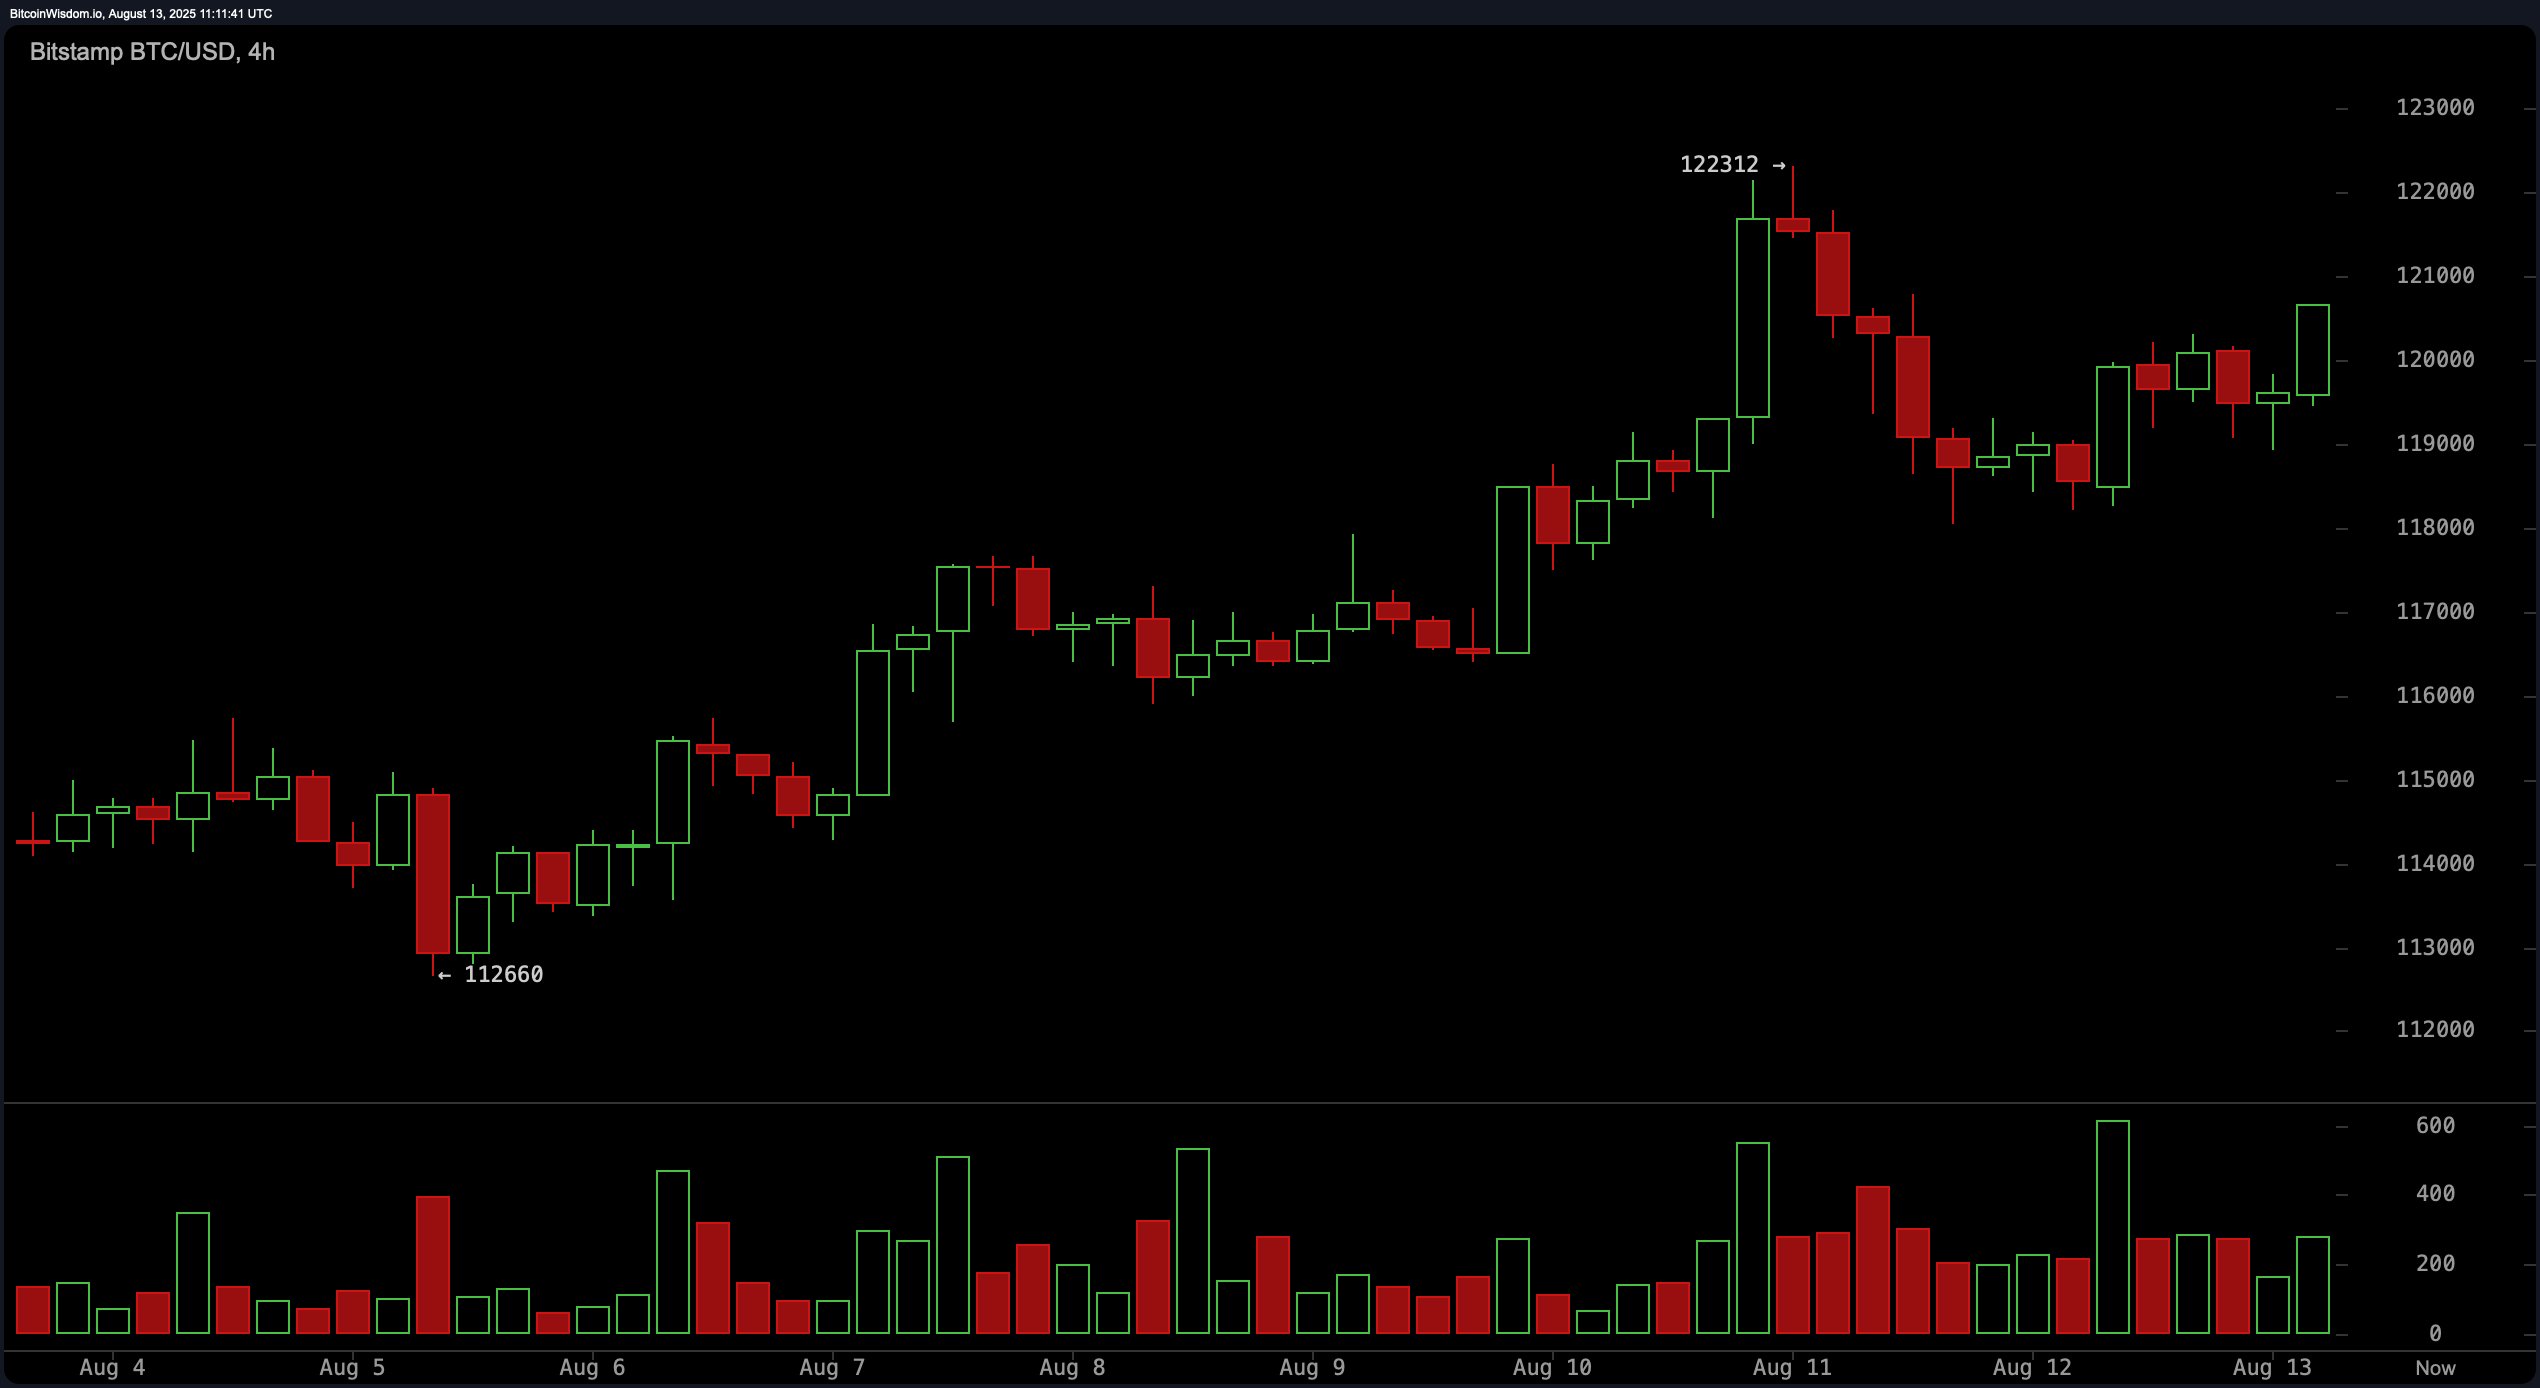
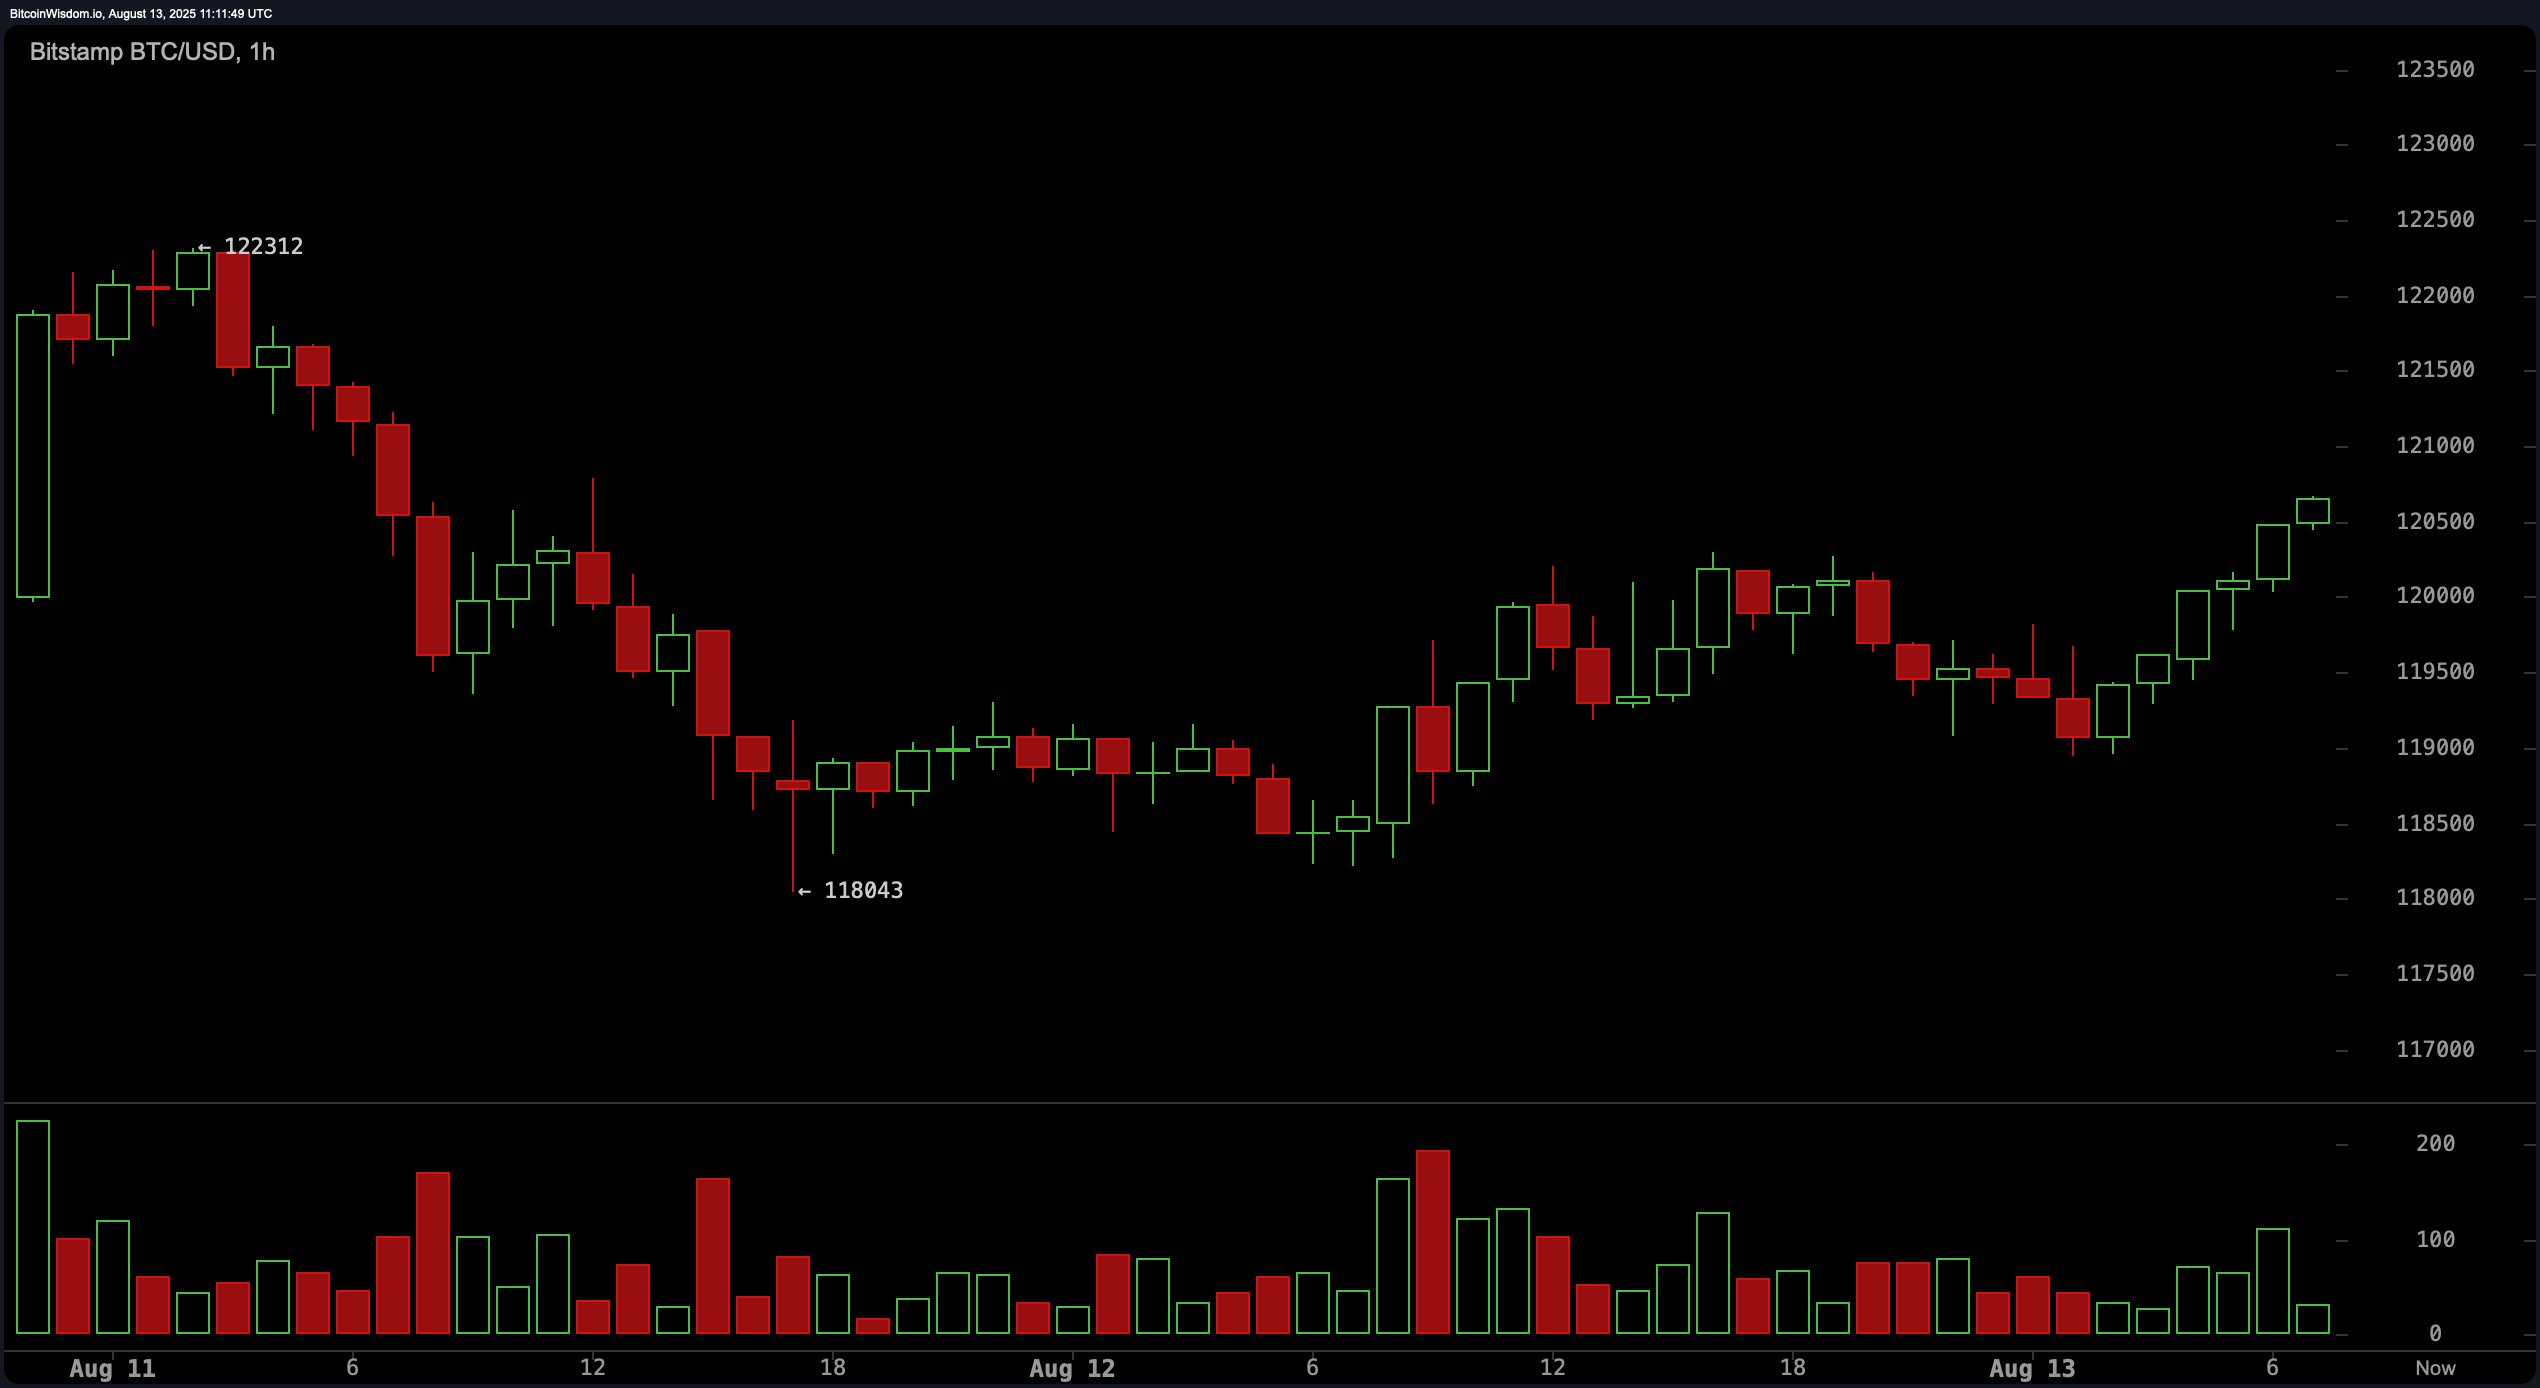
The daily chart for bitcoin illustrates a clear pattern of higher lows, beginning with the July bottom at $98,240 and extending to the current consolidation zone near $120,500. This upward trajectory is reinforced by strong recovery signals on both the 4-hour and 1-hour charts, where price rebounds from the $118,000 level were accompanied by bullish candles. On the 1-hour timeframe, a rounded bottom pattern broke past key resistance near $120,000, suggesting a solid base for upward continuation.

BTC/USD 1-day chart via Bitstamp on Aug. 13, 2025.
Volume data offers nuanced insight into the ongoing trend. Green volume bars were visible on bitcoin‘s 4-hour and 1-hour charts, indicating sustained buying interest rather than mere short covering. However, at the point of breakout above $120,000, trading volume did not markedly increase. This divergence raises a red flag that the breakout may lack sufficient conviction to challenge the resistance zone around $122,500.

BTC/USD 4-hour chart via Bitstamp on Aug. 13, 2025.
Oscillator readings present a largely neutral to slightly bullish outlook. The relative strength index (RSI) sits at 63, reflecting moderate strength without entering overbought territory. Both the stochastic oscillator and the commodity channel index (CCI) are neutral at 76 and 125, respectively, while the average directional index (ADX) at 19 also indicates a lack of strong directional strength. The awesome oscillator is neutral at 1,405, momentum is issuing a bearish signal at 6,387, and the moving average convergence divergence (MACD) shows a positive level at 1,116—creating a mixed technical landscape.

BTC/USD 1-hour chart via Bitstamp on Aug. 13, 2025.
Moving averages strongly support the bullish thesis, with all short- and long-term indicators signaling a buy. The exponential moving averages (EMAs) for 10, 20, 30, 50, 100, and 200 periods all lie beneath the current price, indicating a clear upward trend. Similarly, the simple moving averages (SMAs) across the same intervals echo a bullish alignment, offering robust foundational support between $99,973 and $118,105.
Despite this prevailing bullish momentum, caution is warranted. The 1-hour bitcoin chart has yet to surpass the $122,312 high recorded on Aug. 11, potentially setting up a lower high formation. Bearish wicks observed on the 4-hour chart near $122,000 hint at persistent overhead supply. Unless bitcoin breaks above $122,500 with significant volume, the path of least resistance may lead back toward the $118,000–$116,500 range. Traders should remain vigilant as momentum is tested at critical thresholds.
Bull Verdict:
If bitcoin maintains support above the $120,000 level and breaks through the $122,500 resistance with increased volume, bullish momentum is likely to accelerate. This could propel the price toward the $123,000–$125,000 range in the short term, supported by positive moving average trends and structural breakouts across all key timeframes.
Bear Verdict:
Failure to decisively break above the $122,500 level, combined with fading volume and persistent overhead resistance, may lead to a short-term reversal. In this case, bitcoin risks pulling back toward the $118,000–$116,500 support zone, as sellers reassert control near supply-heavy areas identified on the 4-hour and 1-hour charts.
免责声明:本文章仅代表作者个人观点,不代表本平台的立场和观点。本文章仅供信息分享,不构成对任何人的任何投资建议。用户与作者之间的任何争议,与本平台无关。如网页中刊载的文章或图片涉及侵权,请提供相关的权利证明和身份证明发送邮件到support@aicoin.com,本平台相关工作人员将会进行核查。


