Time flies, and only then do we realize how fleeting the years are. Over the years, through wind and rain, I have slowly come to understand that there is no straight path in life. At countless crossroads, driven by youthful passion and ignorance, we choose a path and must grit our teeth and walk it. The dreams of youth have not yet awakened, but looking back, half a lifetime has passed. What cannot be returned is not just time, but also the person I once was.
It has been quite a few days since we last met, and I have missed you all. I returned to my hometown for a week due to the passing of a family member. There were many things to take care of, so I didn't have time to update the articles. I just returned from my hometown at the end of last week, and now that a new week has begun, I am here to update the article. Although I was in my hometown, I have been keeping an eye on the market. If you have any questions regarding the market, feel free to contact me. Last week, the market further refreshed its historical high, with the increase not being too significant, ultimately hovering around 124,500. Currently, it has once again entered a downward trend, returning to a position similar to before. From my personal perspective, under such a trend, a pullback is definitely expected to continue for a while, and it is highly likely that a relatively low point will appear. It is evident that last week's surge had a somewhat intentional upward pull, and immediately after reaching the high point, a pullback occurred, indicating a strong intention to offload at high positions. Now that the pullback has occurred, these profit-taking positions will definitely need to see a lower price to attract them back into the market. Therefore, at this moment, I may still lean towards a bearish outlook.
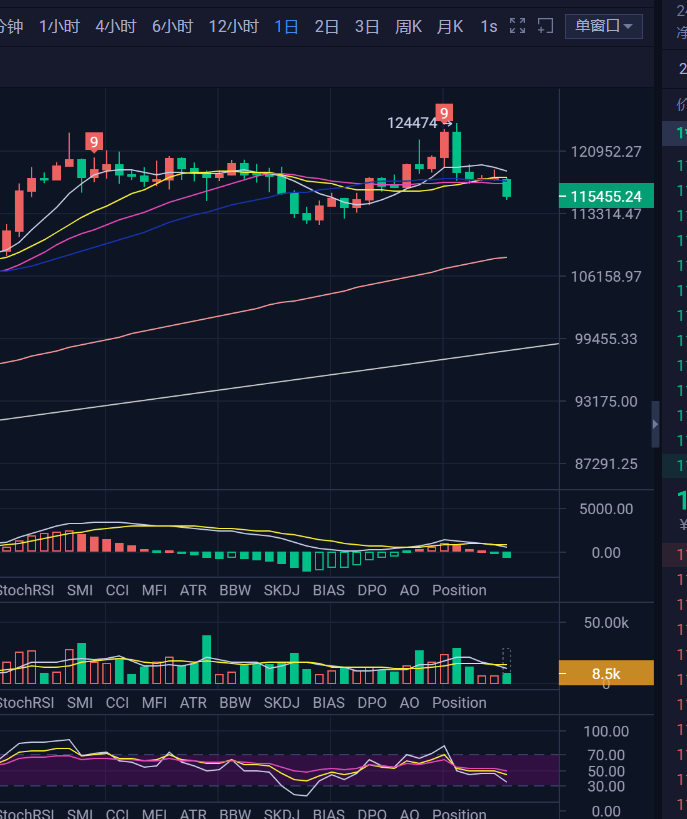
Returning to today's market, let's first look at the liquidity clearing distribution. With the recent pullback, the market is currently hovering around 115,500. In the short term, both long and short liquidity have begun to gather again. The short-term high leverage short clearing intensity is mainly around 117,000, representing short-term chasing short liquidity, while the long liquidity accumulation position is mainly around 114,000, along with the previously left low leverage long liquidity. In terms of liquidity distribution, the short-term long and short liquidity clearing intensity is not at a critical level. If a fluctuating performance can be maintained in the short term, waiting for liquidity accumulation will provide greater reference for the upcoming direction.
On the technical side, with the new week, last week's surge did not have enough strength to change the larger weekly structural trend. Currently, the signs of divergence on the weekly chart are becoming increasingly evident. Last week's candlestick formed a bearish candle with an upper shadow. Generally speaking, receiving such a candlestick at a high position does not bode well for the upcoming closing. Moreover, we mentioned earlier that there was an expectation of a top divergence on the weekly chart. It is very difficult to resolve this through an upward movement, and now, with the weekly chart closing in the red at a high position, the technical indicators show that MACD is about to form a death cross, entering a bearish cycle, while RSI has turned down from the high region. It seems that an adjustment and repair on the weekly chart has become imperative.
The daily chart is similar, forming a high-level adjustment structure. The market has pulled back from the high point, and there is also a top divergence structure. Currently, the price has returned to below all moving averages, with bears clearly dominating the market. In terms of technical indicators, MACD has just formed a death cross, entering a bearish phase. From the daily chart, there is still room for adjustment below, and combined with the larger timeframe, once the daily adjustment ends, a rebound will still be followed by a continued pullback. On the four-hour level, it goes without saying that it is also undergoing an adjustment. However, it is important to note that according to the four-hour market structure, RSI is about to enter the oversold zone. Considering the liquidity situation, I personally believe that after a wave of clearing of the lower liquidity, there will likely be a stop-loss rebound, followed by a period of fluctuation. This way, after reaching a low point, the four-hour structure will form a small-level bottom divergence, providing a rebound demand, and subsequently, there will be a fluctuation process to repair the bottom divergence, which aligns well with the liquidity and technical operation.
In terms of operations, if the price goes below 114,000, a rebound can be attempted, and then we can observe the fluctuations to find a good position for shorting. Currently, the plan is to short above 116,500, but it is not very certain, so we will proceed in real-time. If there are no opportunities, we will wait to rearrange tomorrow.
【The above analysis and strategies are for reference only. Please bear the risks yourself. The article is subject to review and publication, and market changes in real-time may lead to delayed information. Specific operations should be based on real-time strategies. Feel free to contact me for market discussions.】

免责声明:本文章仅代表作者个人观点,不代表本平台的立场和观点。本文章仅供信息分享,不构成对任何人的任何投资建议。用户与作者之间的任何争议,与本平台无关。如网页中刊载的文章或图片涉及侵权,请提供相关的权利证明和身份证明发送邮件到support@aicoin.com,本平台相关工作人员将会进行核查。


