The fluctuations in the cryptocurrency market are like the waves in a turbulent sea, making people feel anxious. However, its charm lies in the fact that it never looks at your past report card. Stop saying "I'll enter the market when it stabilizes"; opportunities in the crypto world never lie in "stability." The real dividends always belong to those who dare to position themselves amid uncertainty. Market volatility is not a risk; not understanding the trend is the biggest risk.
After Bitcoin broke through a new high, it has recently started to show signs of a pullback. After reaching the significant level of $124,500, it began to rapidly retrace and is now around $115,000, with a drop of nearly $10,000.
From a technical perspective, the daily Bollinger Bands' middle line has been breached, and the downward space may have opened up. The 4-hour MACD death cross continues, and the RSI has dropped to around 45, indicating that bearish momentum is dominant. The short-term support level has shifted down to around $112,500; if it breaks below this, it may accelerate selling to $110,000. The upper resistance levels are now at $117,000 and $119,000.
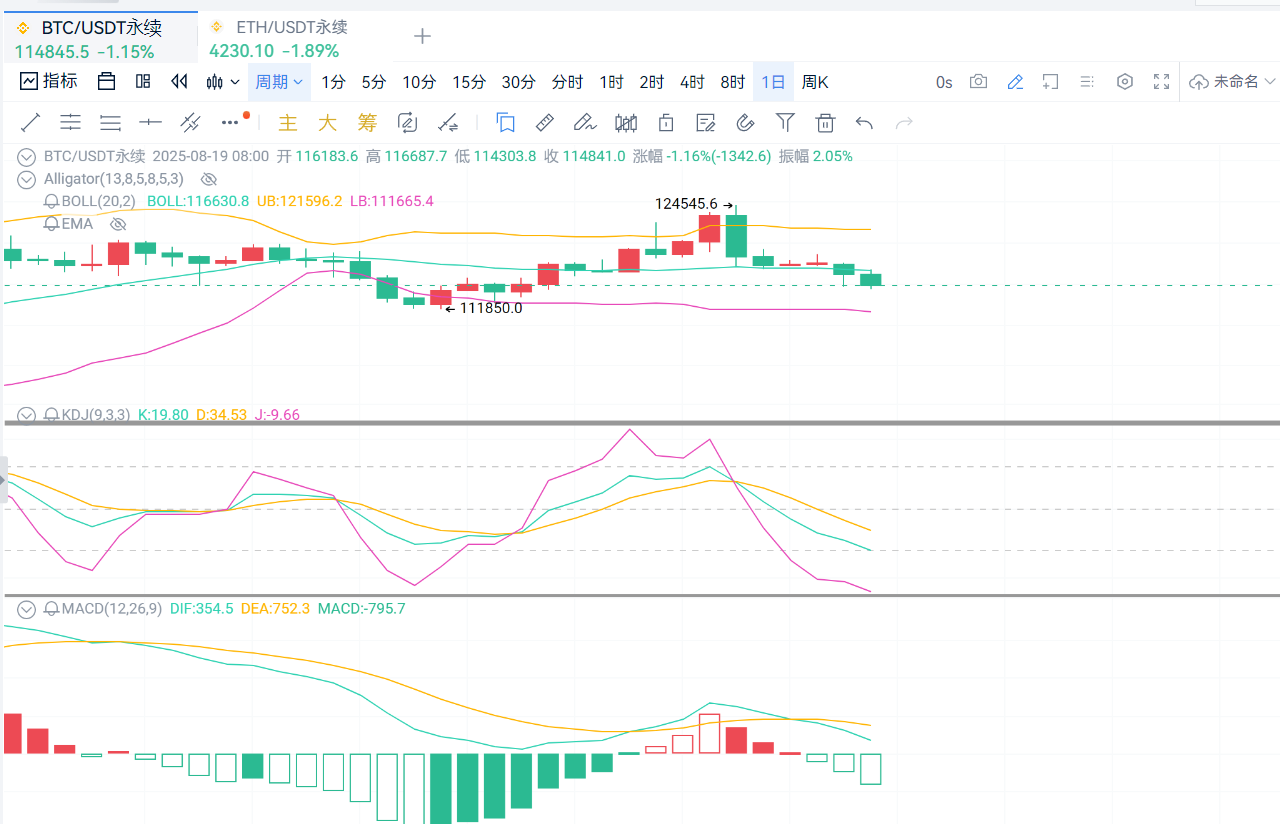
Single trading operation suggestion: If it drops to around $113,000-$112,500, consider entering a small long position, targeting $114,500-$115,000, with a stop-loss at $112,000.
Kong trading operation suggestion: If it pulls back to $117,000-$116,500, consider entering a Kong position, targeting $114,000-$113,500, with a stop-loss at $117,500.
After hitting a high of $4,794 on August 14, Ethereum has seen a decline of over 600 points in the past week, with a low around $4,192. Today, after reaching the lowest point, it has shown a short-term pullback, currently priced around $4,230.
From a technical perspective, the daily candlestick is slowly approaching the middle line of the Bollinger Bands, maintaining a continuous bearish pattern. On the 4-hour chart, the candlestick has reached the lower Bollinger Bands, and although the KDJ is in the oversold zone, it lacks strength above. The MACD has remained below the zero line, indicating short-term upward pressure.
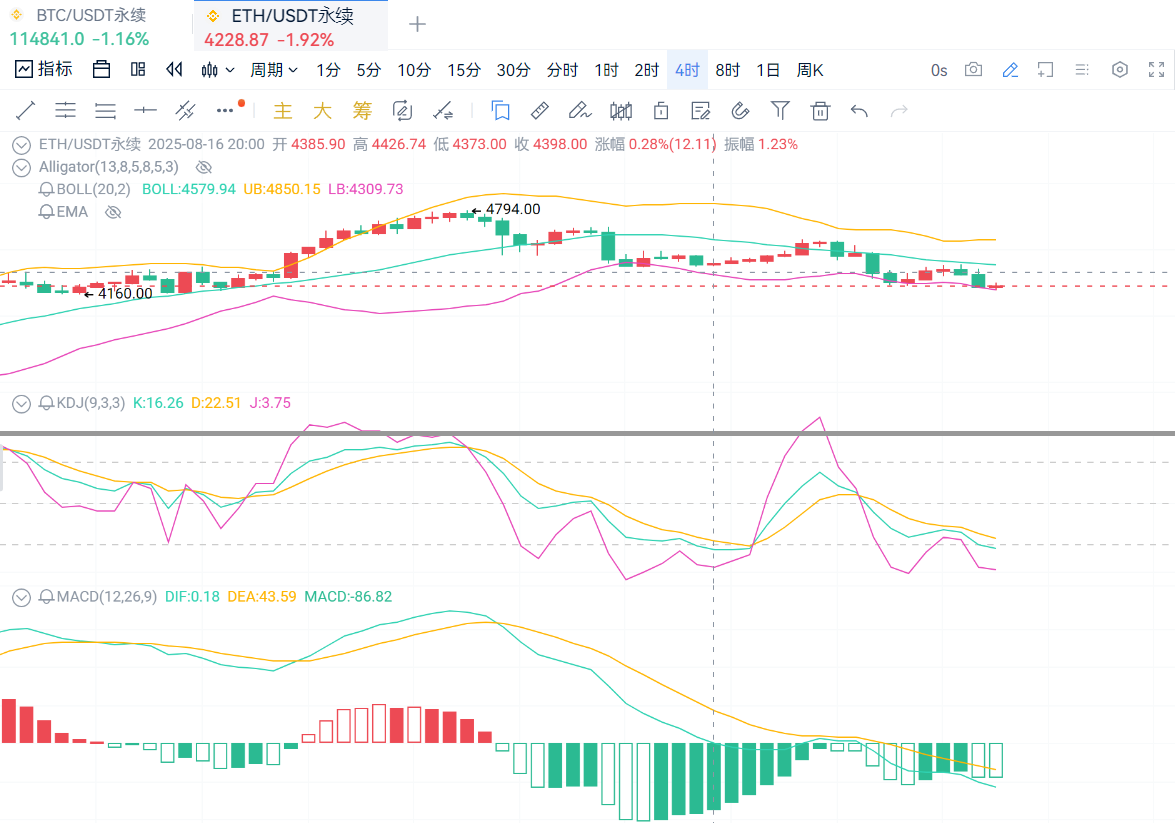
Kong trading operation suggestion: In the $4,280-$4,320 range, consider entering a Kong position in batches, with a short-term target of $4,150. The medium to long-term target is $4,070, with a stop-loss at $4,380-$4,360.
Single trading operation suggestion: If the price does not break below $4,150, consider entering a small long position, targeting the $4,240-$4,280 range, with a stop-loss at $4,100.
Due to the time-sensitive nature of price points, there may be delays in post reviews. Specific operations should be based on real-time market conditions. The above operational range analysis is for reference only; the cryptocurrency market is highly risky, so please make cautious decisions when investing. If you are interested in specific indicator analysis or the impact of new market dynamics on prices, feel free to scan the QR code for the public account in the article below. You are welcome to visit.

Warm reminder: The content of the above article is original by the author. The advertisements at the end of the article and in the comments section are unrelated to the author, so please be cautious!
免责声明:本文章仅代表作者个人观点,不代表本平台的立场和观点。本文章仅供信息分享,不构成对任何人的任何投资建议。用户与作者之间的任何争议,与本平台无关。如网页中刊载的文章或图片涉及侵权,请提供相关的权利证明和身份证明发送邮件到support@aicoin.com,本平台相关工作人员将会进行核查。


