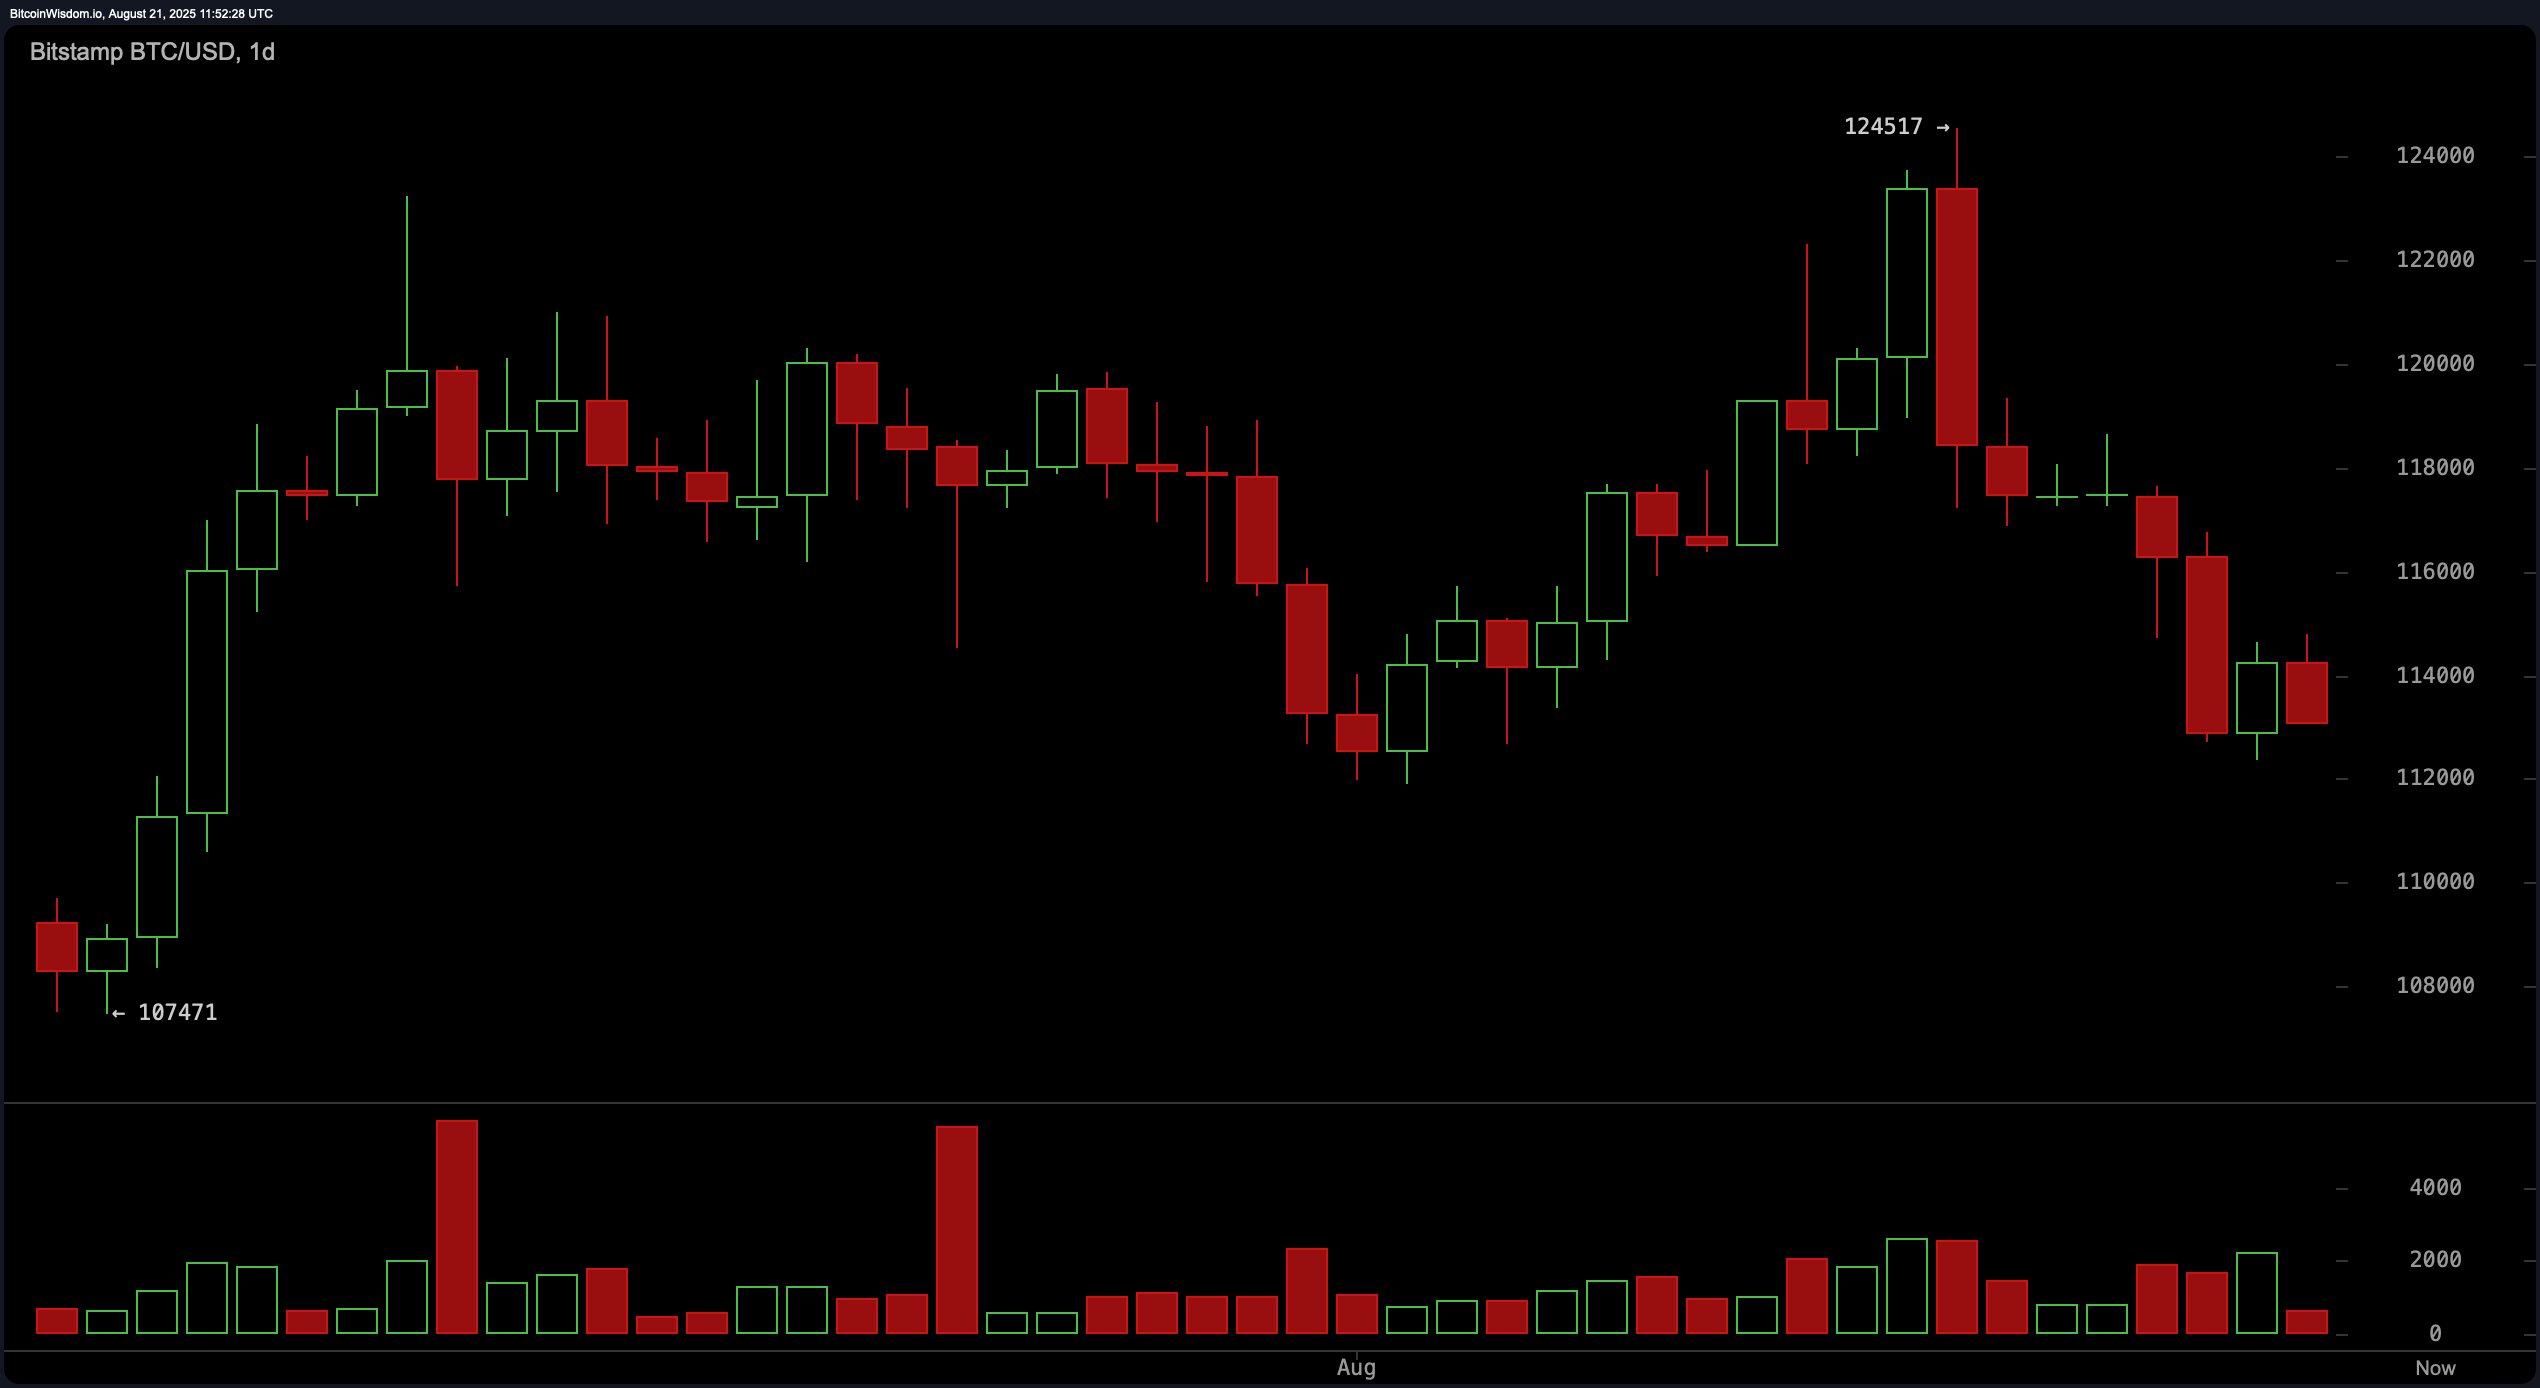
The daily chart indicates bitcoin has entered a bearish phase following a double-top formation near $124,517, which marks a strong resistance level. The current zone around $113,500 is notably lower, with trading volume declining steadily since the last peak. The pattern of lower highs and lower lows confirms the emergence of a downward trend, reinforced by a heavier volume of sell orders. Key support lies between $112,000 and $111,500, while resistance sits between $117,000 and $118,000. Traders considering long entries may look for a price bounce off the $112,000 level with rising volume and bullish candle confirmation.

BTC/USD 1-day chart via Bitstamp on Aug. 21, 2025.
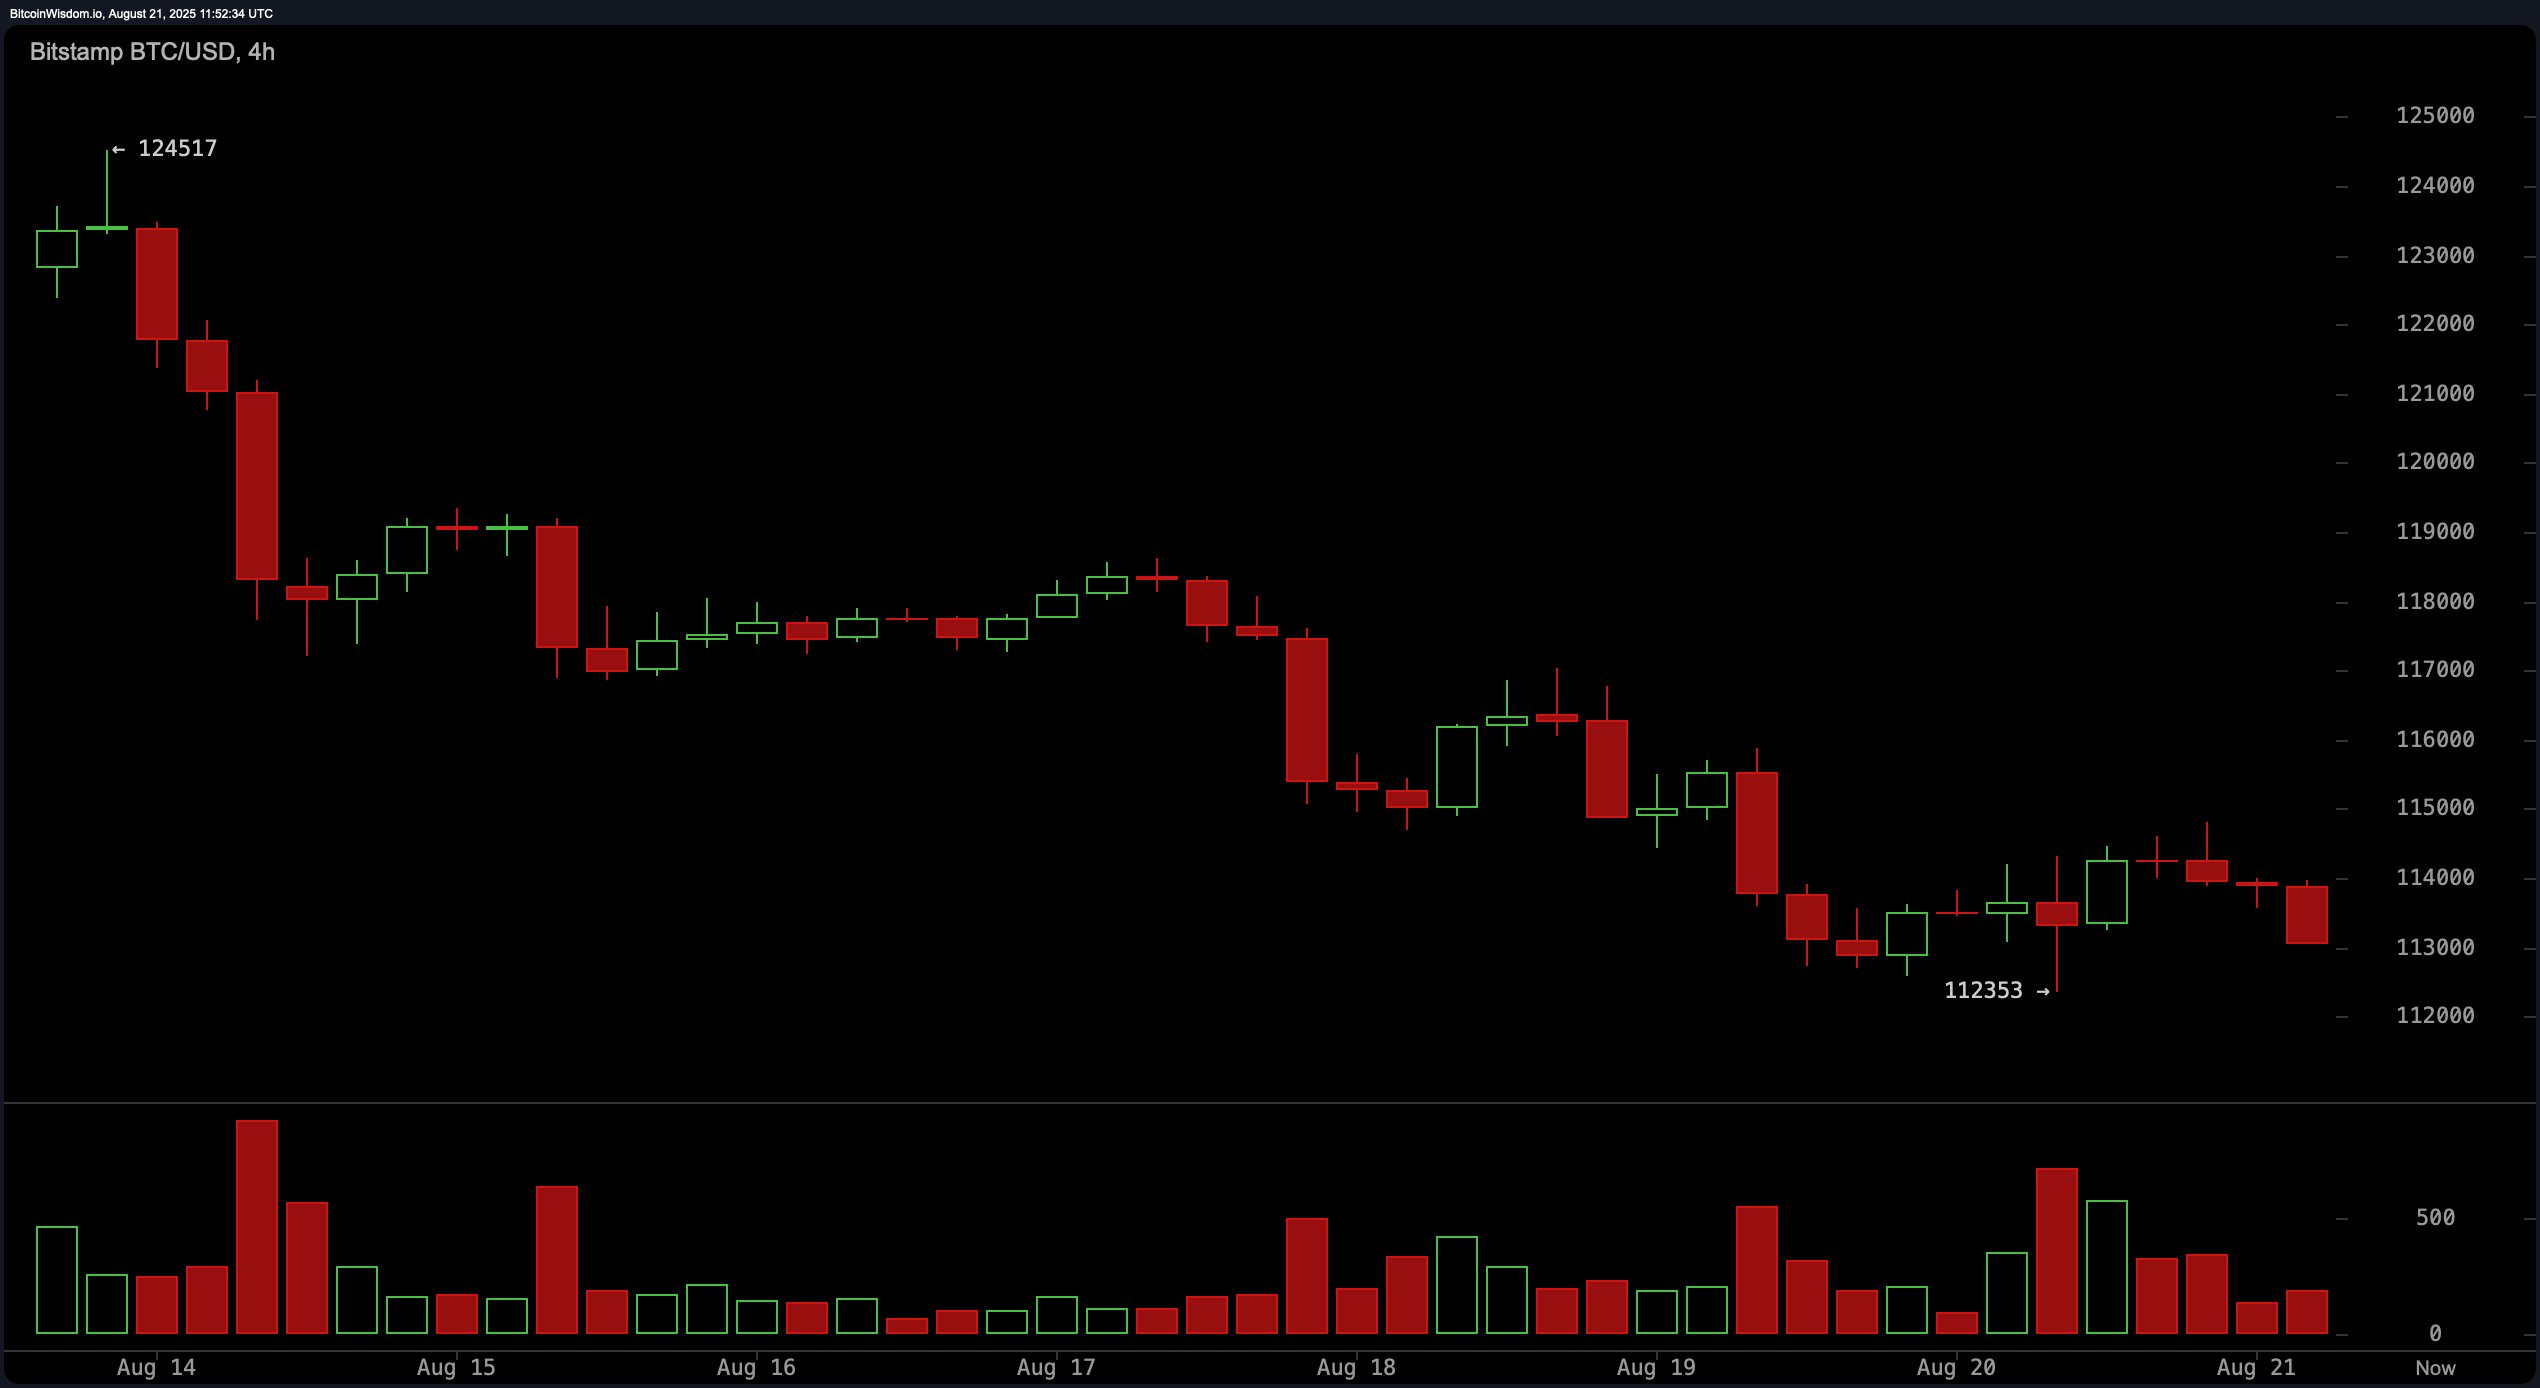
In the 4-hour timeframe, bitcoin experienced a strong sell-off after hitting the $124,517 mark, followed by a phase of mini-consolidation between $113,000 and $115,000. Despite attempts to rally, weak bullish candles with low momentum suggest a potential dead cat bounce. The local low of $112,353 remains a critical level, especially if retested on higher volume. A short position could be favored if price rejects the $115,000 zone, or on a confirmed breakdown below $112,000. A long entry remains plausible if the price stabilizes above $113,500 and establishes a higher low.

BTC/USD 4-hour chart via Bitstamp on Aug. 21, 2025.
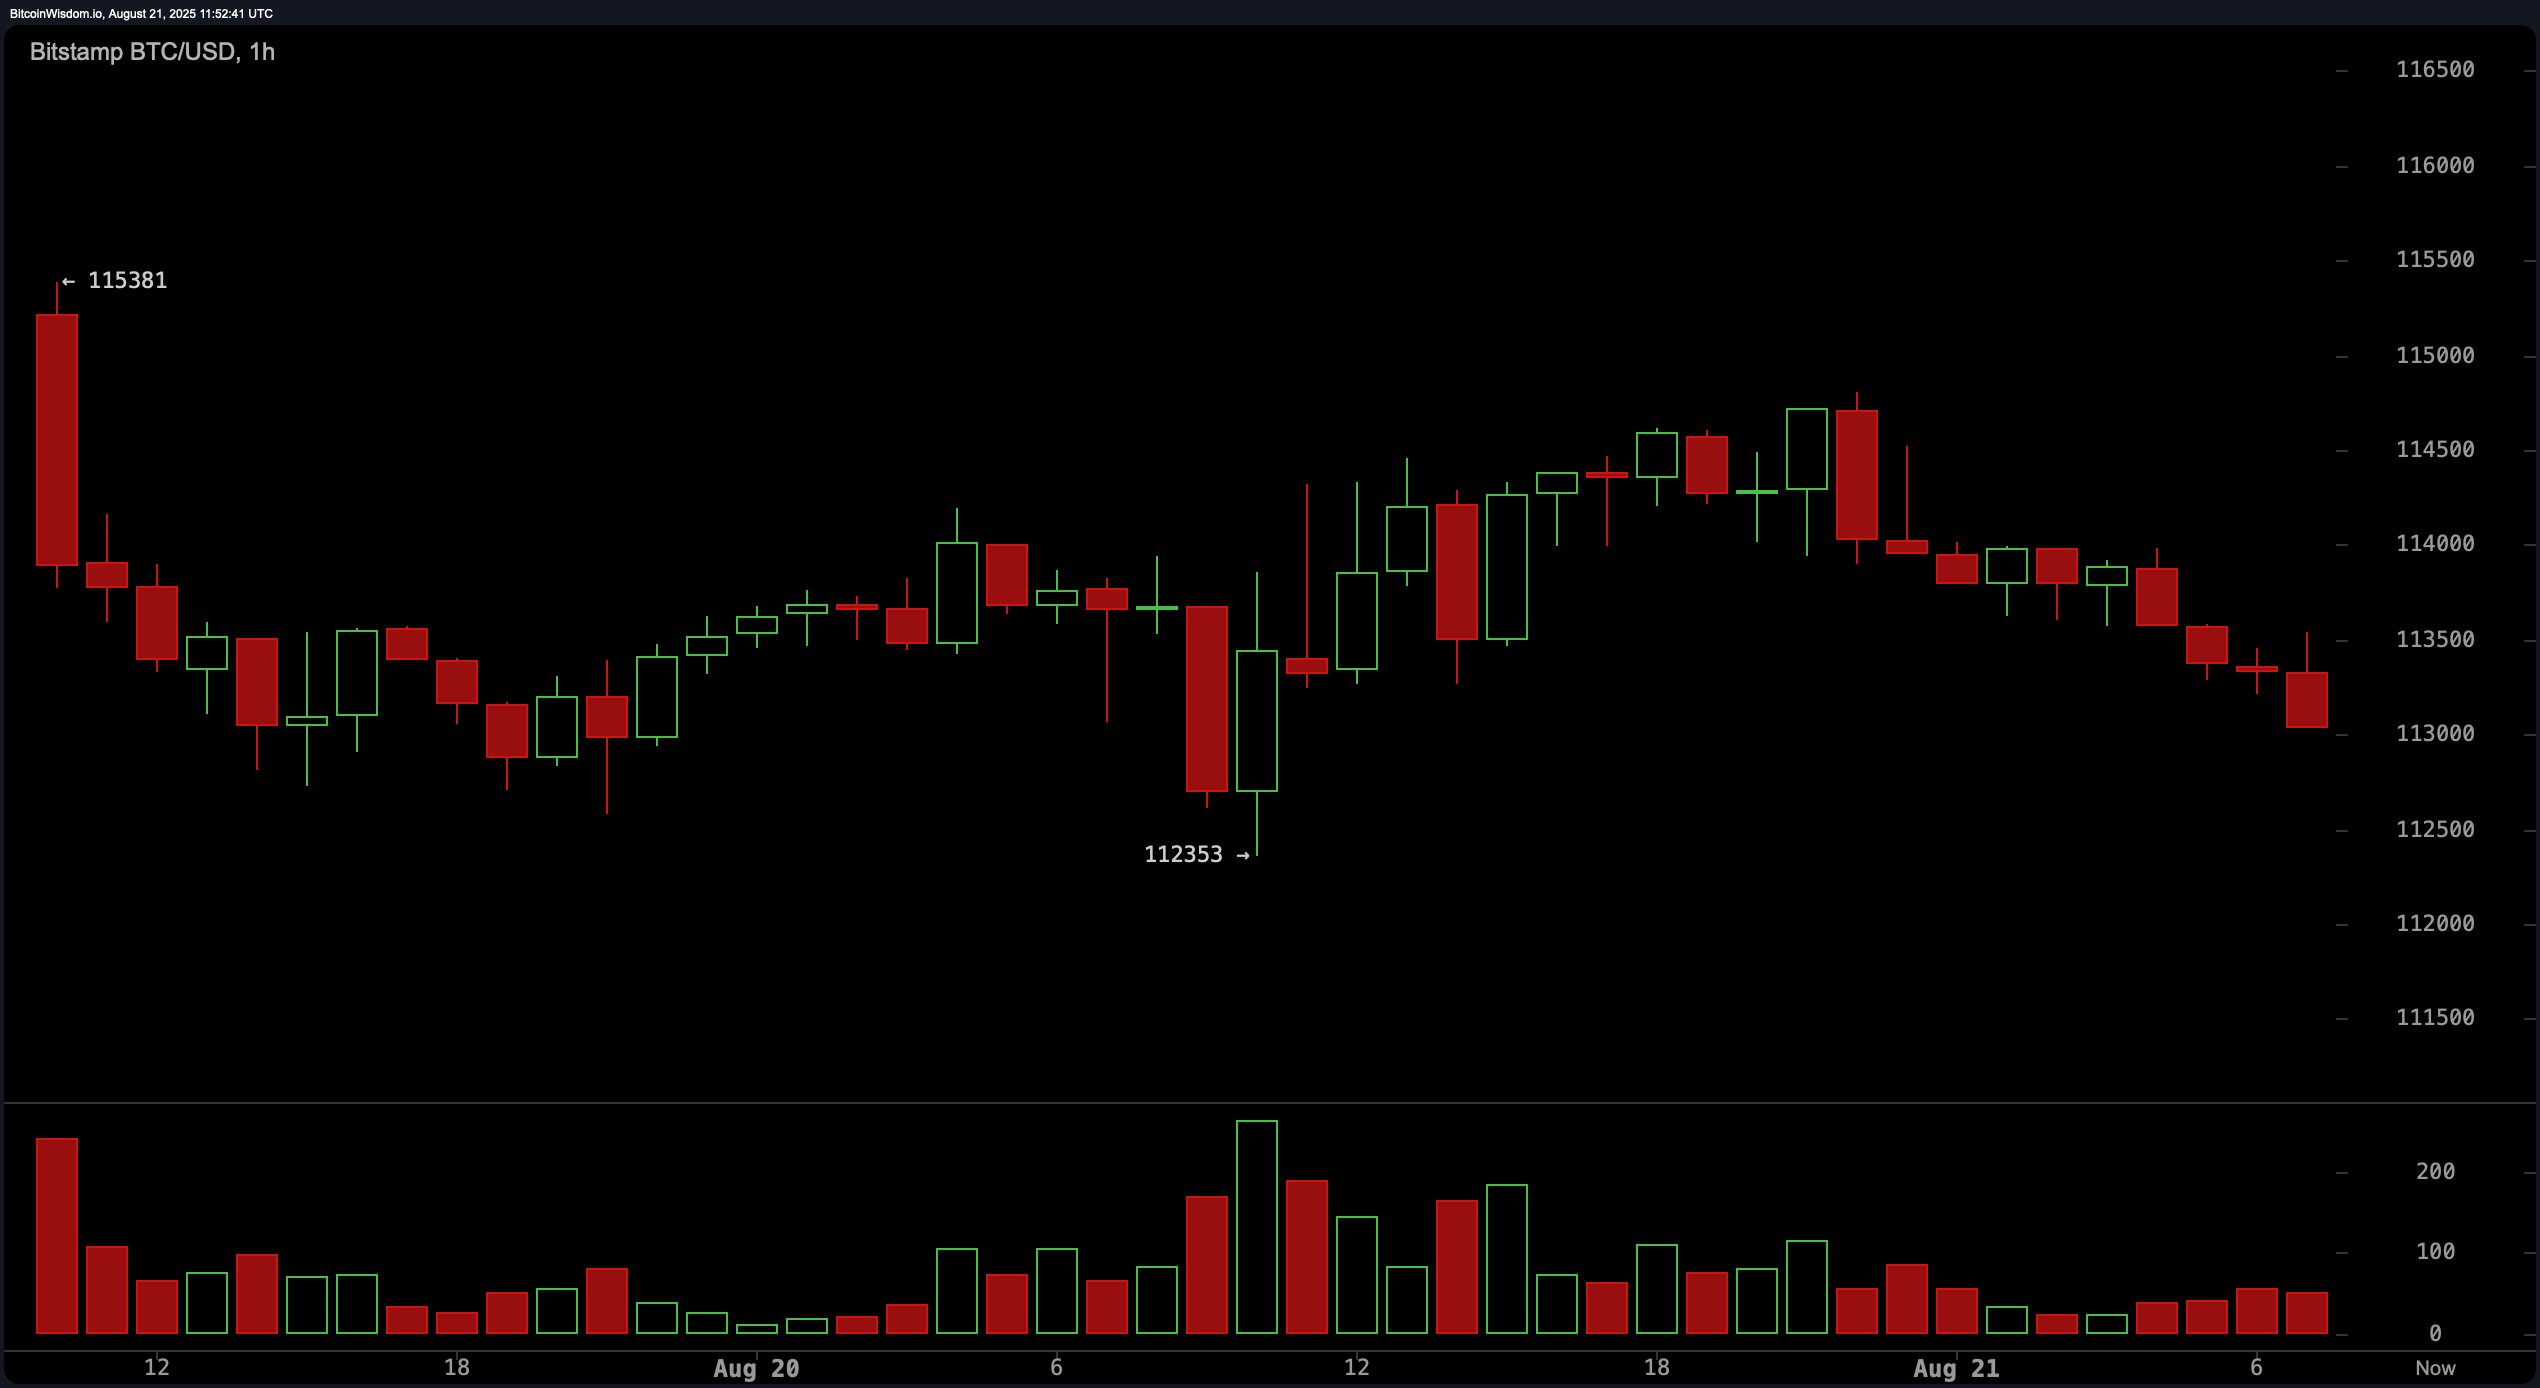
The 1-hour bitcoin chart reveals a weak upward rebound from $112,353, with lower highs indicating sustained selling pressure. The short-term structure supports a bearish outlook unless bitcoin decisively reclaims the $114,500 level. Support between $112,800 and $113,000 presents potential for quick bounce trades, while resistance near $114,000–$114,500 may offer shorting opportunities. Scalpers may benefit from tight stop-loss entries near resistance and exits within a 0.5% to 1.5% profit range.

BTC/USD 1-hour chart via Bitstamp on Aug. 21, 2025.
Oscillator readings support a neutral-to-bearish sentiment. The relative strength index (RSI) is at 41, reflecting a neutral state. The Stochastic oscillator and the commodity channel index (CCI) read 8 and -92, respectively, both indicating neutrality. The average directional index (ADX) is at 18, confirming a weak trend. Meanwhile, the awesome oscillator is negative at -1,779, and the momentum oscillator signals selling pressure at -5,651. The moving average convergence divergence (MACD) level stands at -304, aligning with a bearish signal.
Moving averages (MAs) reinforce the bearish technical landscape too. The 10-period and 20-period exponential and simple moving averages (EMAs and SMAs) are all issuing negative signals, with prices trailing below all short- and mid-term levels. The 30-period and 50-period EMAs and SMAs also support a continued downside move. However, longer-term indicators offer a glimmer of support, as the 100-period and 200-period EMAs and SMAs suggest a buying trend, potentially cushioning a deeper correction.
Overall, bitcoin remains under technical pressure, with the mid-term trend clearly biased to the downside. While opportunities exist for both scalping and swing trades, traders are advised to await volume confirmation and monitor macroeconomic triggers or ETF-related developments that could drive abrupt volatility.
Bull Verdict:
If bitcoin successfully holds above the $112,000 support and confirms a higher low with increasing volume and bullish candlestick formations, a short-term rebound toward the $117,000–$120,000 resistance zone is plausible. While the broader trend remains under pressure, a bullish reversal could take shape if key resistance levels are reclaimed with strength, particularly above $114,500.
Bear Verdict:
With bearish signals dominating the daily and intraday charts, and bitcoin trading below critical short- and mid-term moving averages, the path of least resistance remains to the downside. Failure to hold the $112,000 support may trigger further selling pressure, exposing the $111,500 and lower zones, especially if reinforced by rising volume and bearish momentum indicators.
免责声明:本文章仅代表作者个人观点,不代表本平台的立场和观点。本文章仅供信息分享,不构成对任何人的任何投资建议。用户与作者之间的任何争议,与本平台无关。如网页中刊载的文章或图片涉及侵权,请提供相关的权利证明和身份证明发送邮件到support@aicoin.com,本平台相关工作人员将会进行核查。


