Author: David Duong, Global Research Director at Coinbase
Compiled by: Tim, PANews
Overview
We believe that under a resilient liquidity environment, favorable macro conditions, and friendly regulatory policies, the crypto bull market still has room for development in early Q4 2025. We particularly think that Bitcoin will continue to exceed market expectations as it can directly benefit from the existing macro tailwinds. In other words, unless there are severe fluctuations in energy prices (or other factors that may negatively impact inflation trends), the direct risk of disrupting the current U.S. monetary policy path is actually quite low. Meanwhile, the technical demand for crypto treasuries will continue to provide strong support for the crypto market.
However, seasonal factors always loom over the crypto market. Historical data shows that from 2017 to 2022, Bitcoin's price against the U.S. dollar fell in September for six consecutive years. While this trend has led many investors to believe that seasonal factors significantly impact cryptocurrency performance, this assumption did not hold true in 2023 and 2024. In fact, our research indicates that the statistical validity of such seasonal indicators is very limited due to a small sample size and a potentially large range of outcomes.
A more significant issue in the crypto market is whether we are currently in the early or late stages of the crypto treasury cycle. As of September 10, publicly disclosed crypto treasuries hold over 1 million Bitcoins (worth $110 billion), 4.9 million Ethereum (worth $21.3 billion), and 8.9 million Solana (worth $1.8 billion), while later entrants have begun to target tokens with lower risk gradients. We believe we are currently in the PvP phase of the cycle, which will continue to drive funds toward large cryptocurrencies. However, this may also signal that smaller crypto treasury participants are facing signs of consolidation.
Maintaining a Constructive Outlook
Earlier this year, we believed that the crypto market would bottom out in the first half of 2025 and reach an all-time high in the second half of 2025. This view was contrary to the market consensus at the time, as market participants were concerned about a potential economic recession, questioning price increases, and were confused about the recovery cycle. However, we believe these views are misjudgments and stand by our macroeconomic outlook.
As we enter Q4, we maintain a constructive outlook for the crypto market, expecting it to continue to be supported by strong liquidity, a favorable macroeconomic environment, and encouraging regulatory progress. In terms of monetary policy, we expect the Federal Reserve to implement interest rate cuts on September 17 and October 29, as signs of weakness in the U.S. labor market have become apparent. We believe this will not create a local peak but will instead activate idle funds in the over-the-counter market. In fact, we pointed out in August that interest rate cuts could prompt a significant portion of the $7.4 trillion in money market funds to end their wait-and-see stance and enter the market.
Nevertheless, if the current inflation trajectory undergoes a significant change, such as a rebound in energy prices, it would pose a risk to this outlook. (Note: We believe the actual risk of tariffs is far lower than some estimates suggest.) However, the OPEC+ oil-producing countries alliance has recently agreed to increase oil production again, while global oil demand is showing signs of slowing. Nonetheless, the possibility of strengthening sanctions against Russia could also push oil prices higher. Currently, we do not expect oil prices to exceed the critical point that would plunge the economy into stagflation.
The Crypto Treasury Story is Not Over, Competition Heats Up
We believe that the technical demand for crypto treasuries is expected to provide ongoing support for the crypto market. In fact, the phenomenon of crypto asset reserves has reached a critical watershed. We are no longer in the early adoption phase presented over the past 6-9 months, nor do we believe this trend is about to end. Instead, we have entered what is known as the "PvP phase," a competitive stage where success increasingly depends on execution capability, differentiation, and timing rather than simply mimicking MicroStrategy's strategy.
Indeed, early entrants like MicroStrategy enjoyed a significant premium over net asset value (NAV), but increased competition, execution risks, and regulatory constraints have led to a discount phenomenon in NAV. We believe the scarcity premium enjoyed by early participants has dissipated. Nevertheless, Bitcoin-focused crypto treasuries currently hold over 1 million BTC, accounting for about 5% of the circulating supply of that token. Similarly, top Ethereum crypto treasuries hold approximately 4.9 million ETH (worth $21.3 billion), accounting for over 4% of the total circulating supply of ETH.
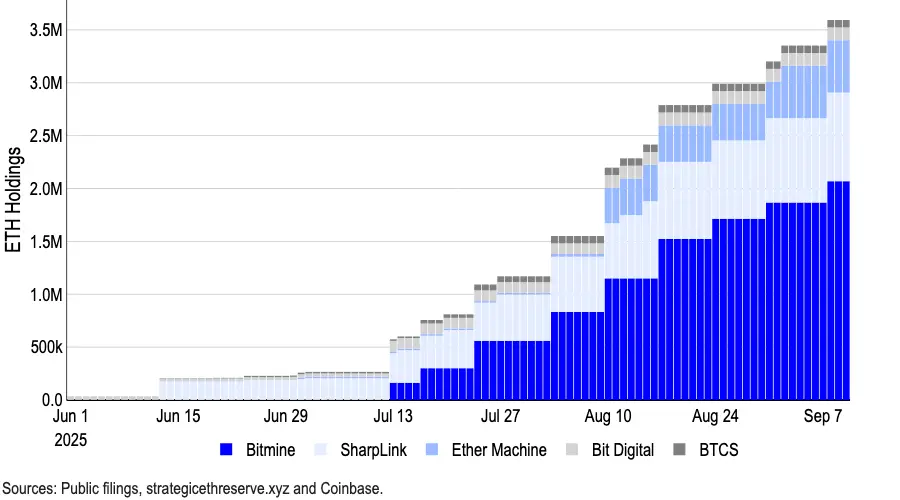
In August, it was reported that 154 publicly listed companies in the U.S. had raised approximately $98.4 billion for the purchase of cryptocurrencies in 2025, a significant increase from the $33.6 billion raised by the top 10 companies at the beginning of the year (based on Architect Partners data). Capital investment in other tokens is also increasing, especially in SOL and other altcoins. (Forward Industries recently raised $1.65 billion to fund a SOL crypto treasury supported by Galaxy Digital, Jump Crypto, and Multicoin Capital.)
The explosive growth of crypto treasuries has attracted increasingly stringent scrutiny. In fact, recent reports indicate that Nasdaq is tightening regulations on crypto treasury concept stocks, requiring specific transactions to obtain shareholder approval and advocating for enhanced disclosure. However, Nasdaq has made it clear that no formal new regulatory announcements have been issued on this matter.
Currently, we believe the crypto treasury cycle is maturing, but it is neither in the early nor late stages. In our view, the era of easy profits and guaranteed net asset value premiums is undoubtedly over; in this PvP phase, only those participants with the strictest discipline and the most precise strategic positioning will stand out. We expect the crypto market to continue benefiting from unprecedented capital flows, as these funds shift from traditional investment tools to the crypto space, thereby enhancing investment returns.
Risking Seasonal Weakness?
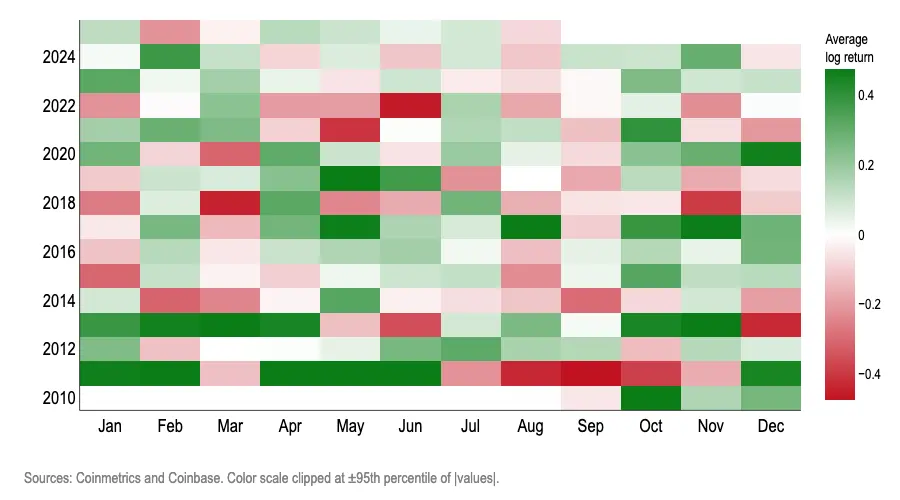
Meanwhile, the issue of seasonal weakness continues to occupy the minds of crypto market participants. From 2017 to 2022, Bitcoin's price depreciated against the U.S. dollar in September for six consecutive years, with an average return of -3% in that month over the past decade. This has left many investors with the impression that "seasonal factors significantly impact cryptocurrency performance, and September is often an unfavorable time to hold risk assets." However, trading based on this perception would have been disproven in both 2023 and 2024.
Indeed, we believe that monthly seasonality is not a particularly useful trading signal for Bitcoin. Whether through spectral analysis, odds ratios, out-of-sample predictions, pseudo-experimental rearrangement tests, or control variable tests, all results convey the same message: on a statistical level, the month is not a reliable indicator for predicting the positive or negative direction of Bitcoin's monthly logarithmic returns. (Note: We use logarithmic returns to measure geometric or compound growth, as they better reflect long-term trends while accommodating Bitcoin's high volatility.)
The following tests found that "calendar months" are unreliable for predicting Bitcoin's logarithmic returns:
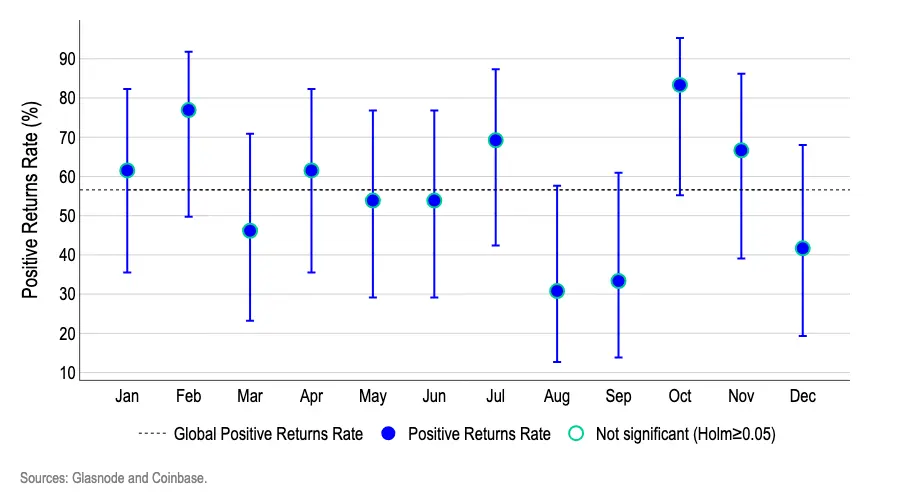
- Wilson Confidence Interval: Chart 3 shows that after considering small sample uncertainty, no month crosses the significant seasonal prediction threshold. Those months that appear "high" (February/October) or "low" (August/September) have error bars that not only overlap with the overall average but also intersect with each other, indicating that data fluctuations are random variance phenomena rather than persistent calendar effects.
- Each point represents the ratio of BTC finishing the month with a price increase; the vertical line and bars represent the 95% Wilson confidence interval, which is a statistical method suitable for small sample data, as each month contains only about 12-13 data points, and this interval provides a more accurate uncertainty threshold for such small samples.
- The dashed line represents the overall average increase rate. Since we observe data for 12 months simultaneously, we use the Holm multiple testing correction method to avoid misinterpreting random data from a single month as a regular change.
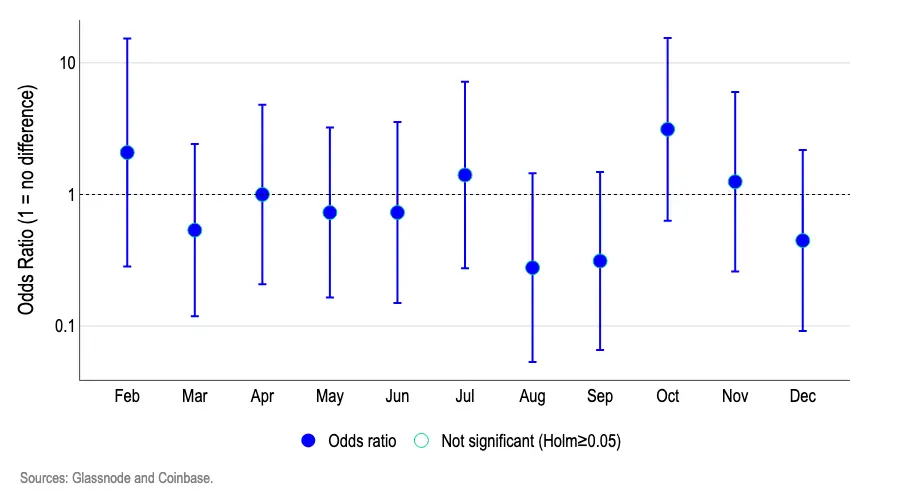
- Logistic Regression Analysis: We employed a logistic regression model to test whether certain months are more favorable for Bitcoin's price increase or decrease compared to the benchmark month (January). Chart 4 shows that the odds ratios for each month are mostly concentrated around 1.0; more importantly, their 95% confidence intervals all cross the critical value of 1.0.
- A value of 1.0 indicates "the probability of obtaining a positive logarithmic return is the same as in January," while a value above 1.0 indicates "higher probability," and below 1.0 indicates "lower probability."
- For example, an odds ratio of 1.5 roughly means "the chance of an up month is about 50% higher than in January," while 0.7 means "about 30% lower."
Since most confidence intervals cross the reference line of 1.0, and after Holm multiple testing adjustments, no month shows statistical significance, we cannot conclude that "calendar months" are an effective indicator for predicting the direction of Bitcoin's logarithmic returns.
- Out-of-Sample Prediction: In each step, we re-estimate two models using only data up to that month (initially training with half the dataset):
- The baseline model is a logistic model containing only an intercept, predicting a constant probability equal to the historical proportion of positive return months (i.e., the baseline rate).
- The calendar month model is a logistic regression model that includes month dummy variables, predicting the probability of an up month based on the historical performance characteristics of the months.
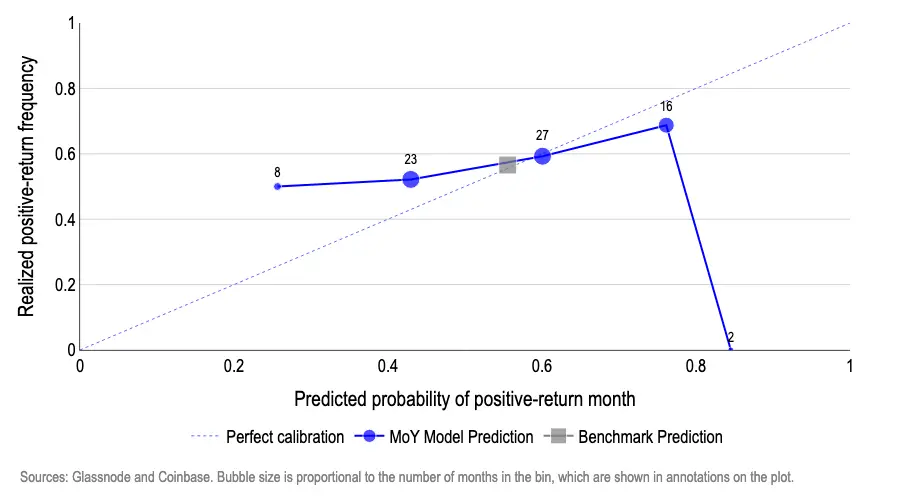
Our research results are presented in Chart 5, where: (1) the horizontal axis represents the predicted probability of positive logarithmic return months; (2) the vertical axis represents the actual proportion of months achieving positive returns. When plotting predicted values, a perfectly calibrated model should have its data points distributed along the 45-degree line, meaning that when the model predicts a 50% probability of an "up month," 50% of the months should actually achieve an increase.
The month-on-month model shows significant deviation. For example:
- When the predicted probability of an increase is about 27%, the actual frequency reaches around 50% (too pessimistic); about 45-60% of the predictions are only roughly accurate.
- There is overconfidence in high-value ranges; for instance, when the predicted value is about 75%, the actual occurrence is about 70%, while in extreme ranges, the predicted value can be as high as about 85%, but the actual occurrence rate is 0%.
In contrast, the model that consistently uses the historical baseline probability (about 55-57% chance of monthly increases) as a prediction benchmark has its results falling near the 45-degree line with almost no deviation, as the probability of Bitcoin's monthly increases remains relatively stable over time. In short, this result indicates that calendar months have almost no predictive power in out-of-sample predictions.
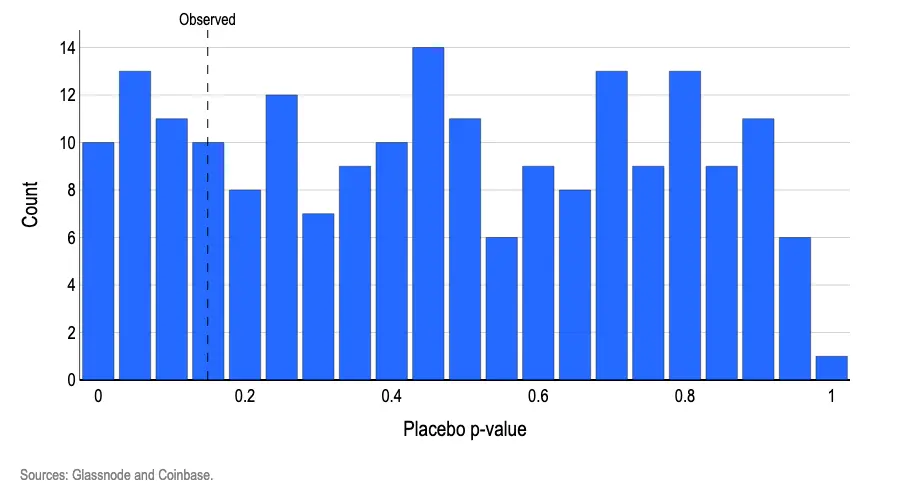
- Pseudo-experimental Rearrangement Test: To verify whether "month labels" help in determining the differences in positive and negative logarithmic returns, we fitted a simple logistic model with month dummy variables and assessed whether these dummy variables provided a better fit than a baseline model without month variables through an intra-group joint test (standard likelihood ratio joint test). The observed p-value obtained was 0.15, which means that even if the month factor is actually irrelevant, there is about a 15% probability of randomly observing at least such a significant pattern. We then performed thousands of random rearrangements of the month labels, conducting the same joint test after each rearrangement.
As a result, we found that about 19% of the p-values generated from random arrangements were equal to or smaller than the observed p-value (Chart 6).
In simple terms, this result is quite common under pure randomness conditions, further confirming the conclusion that "there is no month signal." For month labels to have statistical validity, two conditions must be met: the p-value from the joint test of the real data should be less than 0.05, and the proportion of cases in the data generated by random permutations with p-values below this threshold should not exceed 5%.
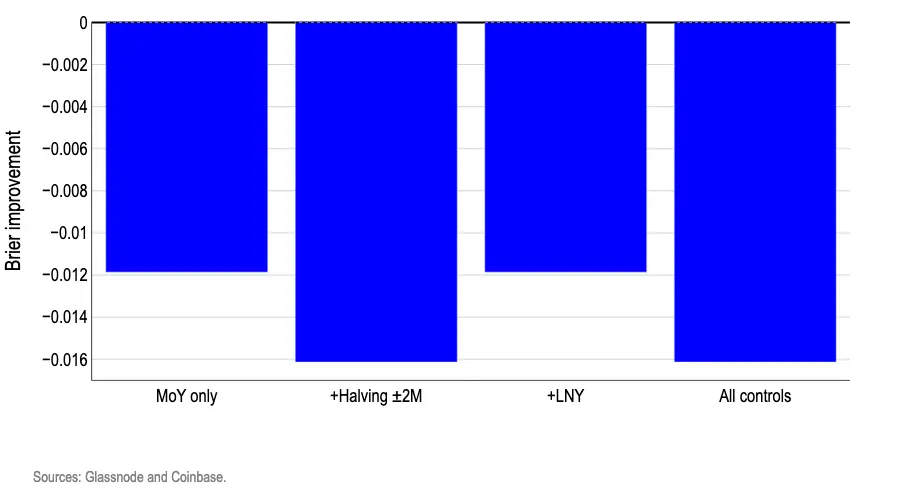
- Control Variables: Adding real calendar markers does not unlock tradable marginal advantages; instead, it usually worsens the predictive effectiveness of up and down signals. We reassessed the "monthly increase probability" using the same month dummy variables and then added two significant event control variables: these events 1) may affect Bitcoin's logarithmic returns, and 2) do not occur at fixed times in specific months each year, namely the Lunar New Year and the Bitcoin halving time window (two months before and after). We only used control variables that occur in different calendar months each year to avoid redundant dummy variables that could destabilize model estimates.
This test aims to verify two common questions: (i) whether the so-called "month effect" is actually a disguise for periodic events, such as liquidity changes during the Lunar New Year or the Bitcoin halving effect; (ii) even if the original monthly pattern shows weak performance, it may still generate predictive value when considering these driving factors. We used half of the dataset as the training set and half as the test set, scoring each monthly probability prediction using the Brier score, which assesses predictive accuracy by calculating the average variance between predicted probabilities and actual up and down results (i.e., the degree of deviation between predicted values and reality).
The bar chart in Chart 7 shows the comparison results of the Brier improvement rate against a simple baseline, which only uses the historical increase month ratio within the training window as a single value. All bar charts fall below the zero line, indicating that the performance of each control variant is inferior to the constant probability baseline. In short, introducing additional calendar markers based on month labels only adds noise interference.
Conclusion
The impact of seasonal factors on the market is deeply ingrained in investors' minds, and this obsession may even create a self-fulfilling prophecy. However, our model indicates that if we assume the probability of increases and decreases each month is roughly consistent with the long-term historical average, its performance will surpass all calendar cycle-based trading strategies. This fully demonstrates that calendar patterns do not contain genuinely effective predictive information and cannot be used to determine the direction of Bitcoin's monthly trends. Since calendar months cannot reliably predict the positive or negative direction of logarithmic returns, the likelihood of them predicting the magnitude of returns is even more negligible. The historical declines in September and the so-called "up October" legend for Bitcoin may have statistical reference value, but they do not meet the standards of statistical validity.
免责声明:本文章仅代表作者个人观点,不代表本平台的立场和观点。本文章仅供信息分享,不构成对任何人的任何投资建议。用户与作者之间的任何争议,与本平台无关。如网页中刊载的文章或图片涉及侵权,请提供相关的权利证明和身份证明发送邮件到support@aicoin.com,本平台相关工作人员将会进行核查。


