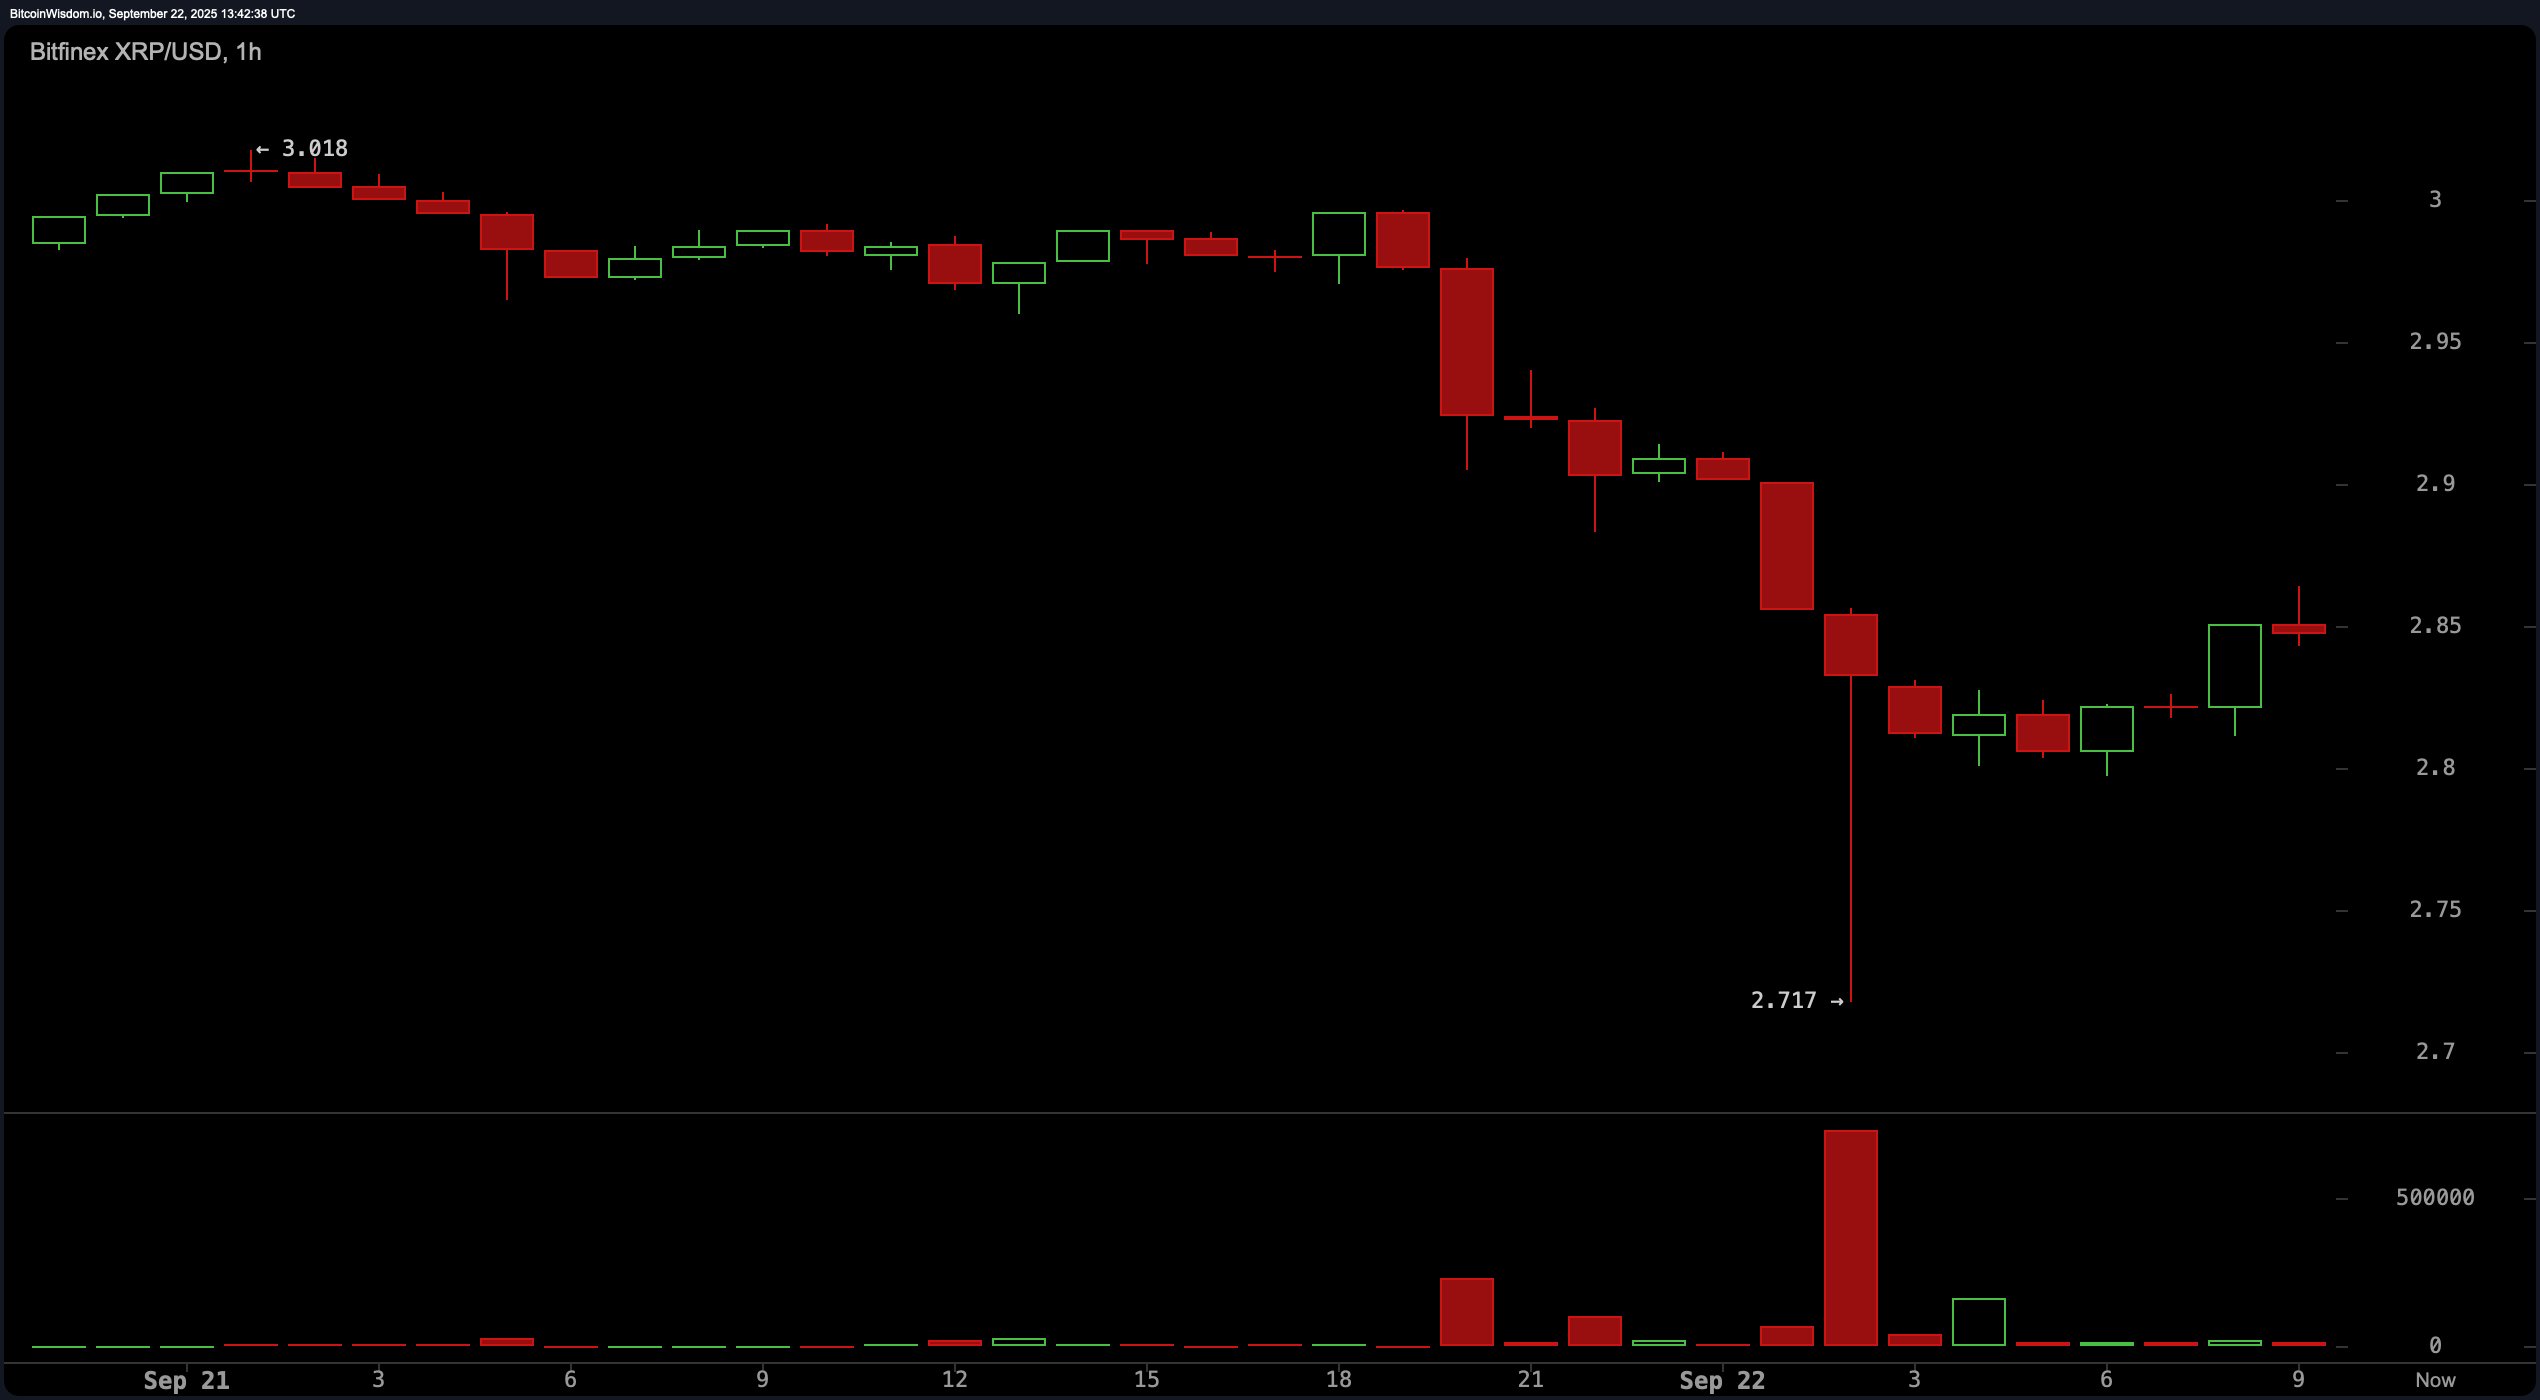
On the 1-hour chart, XRP shows signs of a sharp correction from a high of $3.018, dropping to a wick low of $2.717 before staging a modest rebound. The short-term structure reveals a failed bullish recovery attempt, with buyers stepping in near $2.75–$2.85, yet struggling to sustain momentum.
Volume spiked sharply during the decline, hinting at potential capitulation, but the lack of follow-through buying suggests caution is still warranted for intraday traders. After the early morning dump across the entire crypto market, things are still quite shifty.

XRP/USD via Bitfinex on Sept. 22, 2025. 1-hour timeframe.
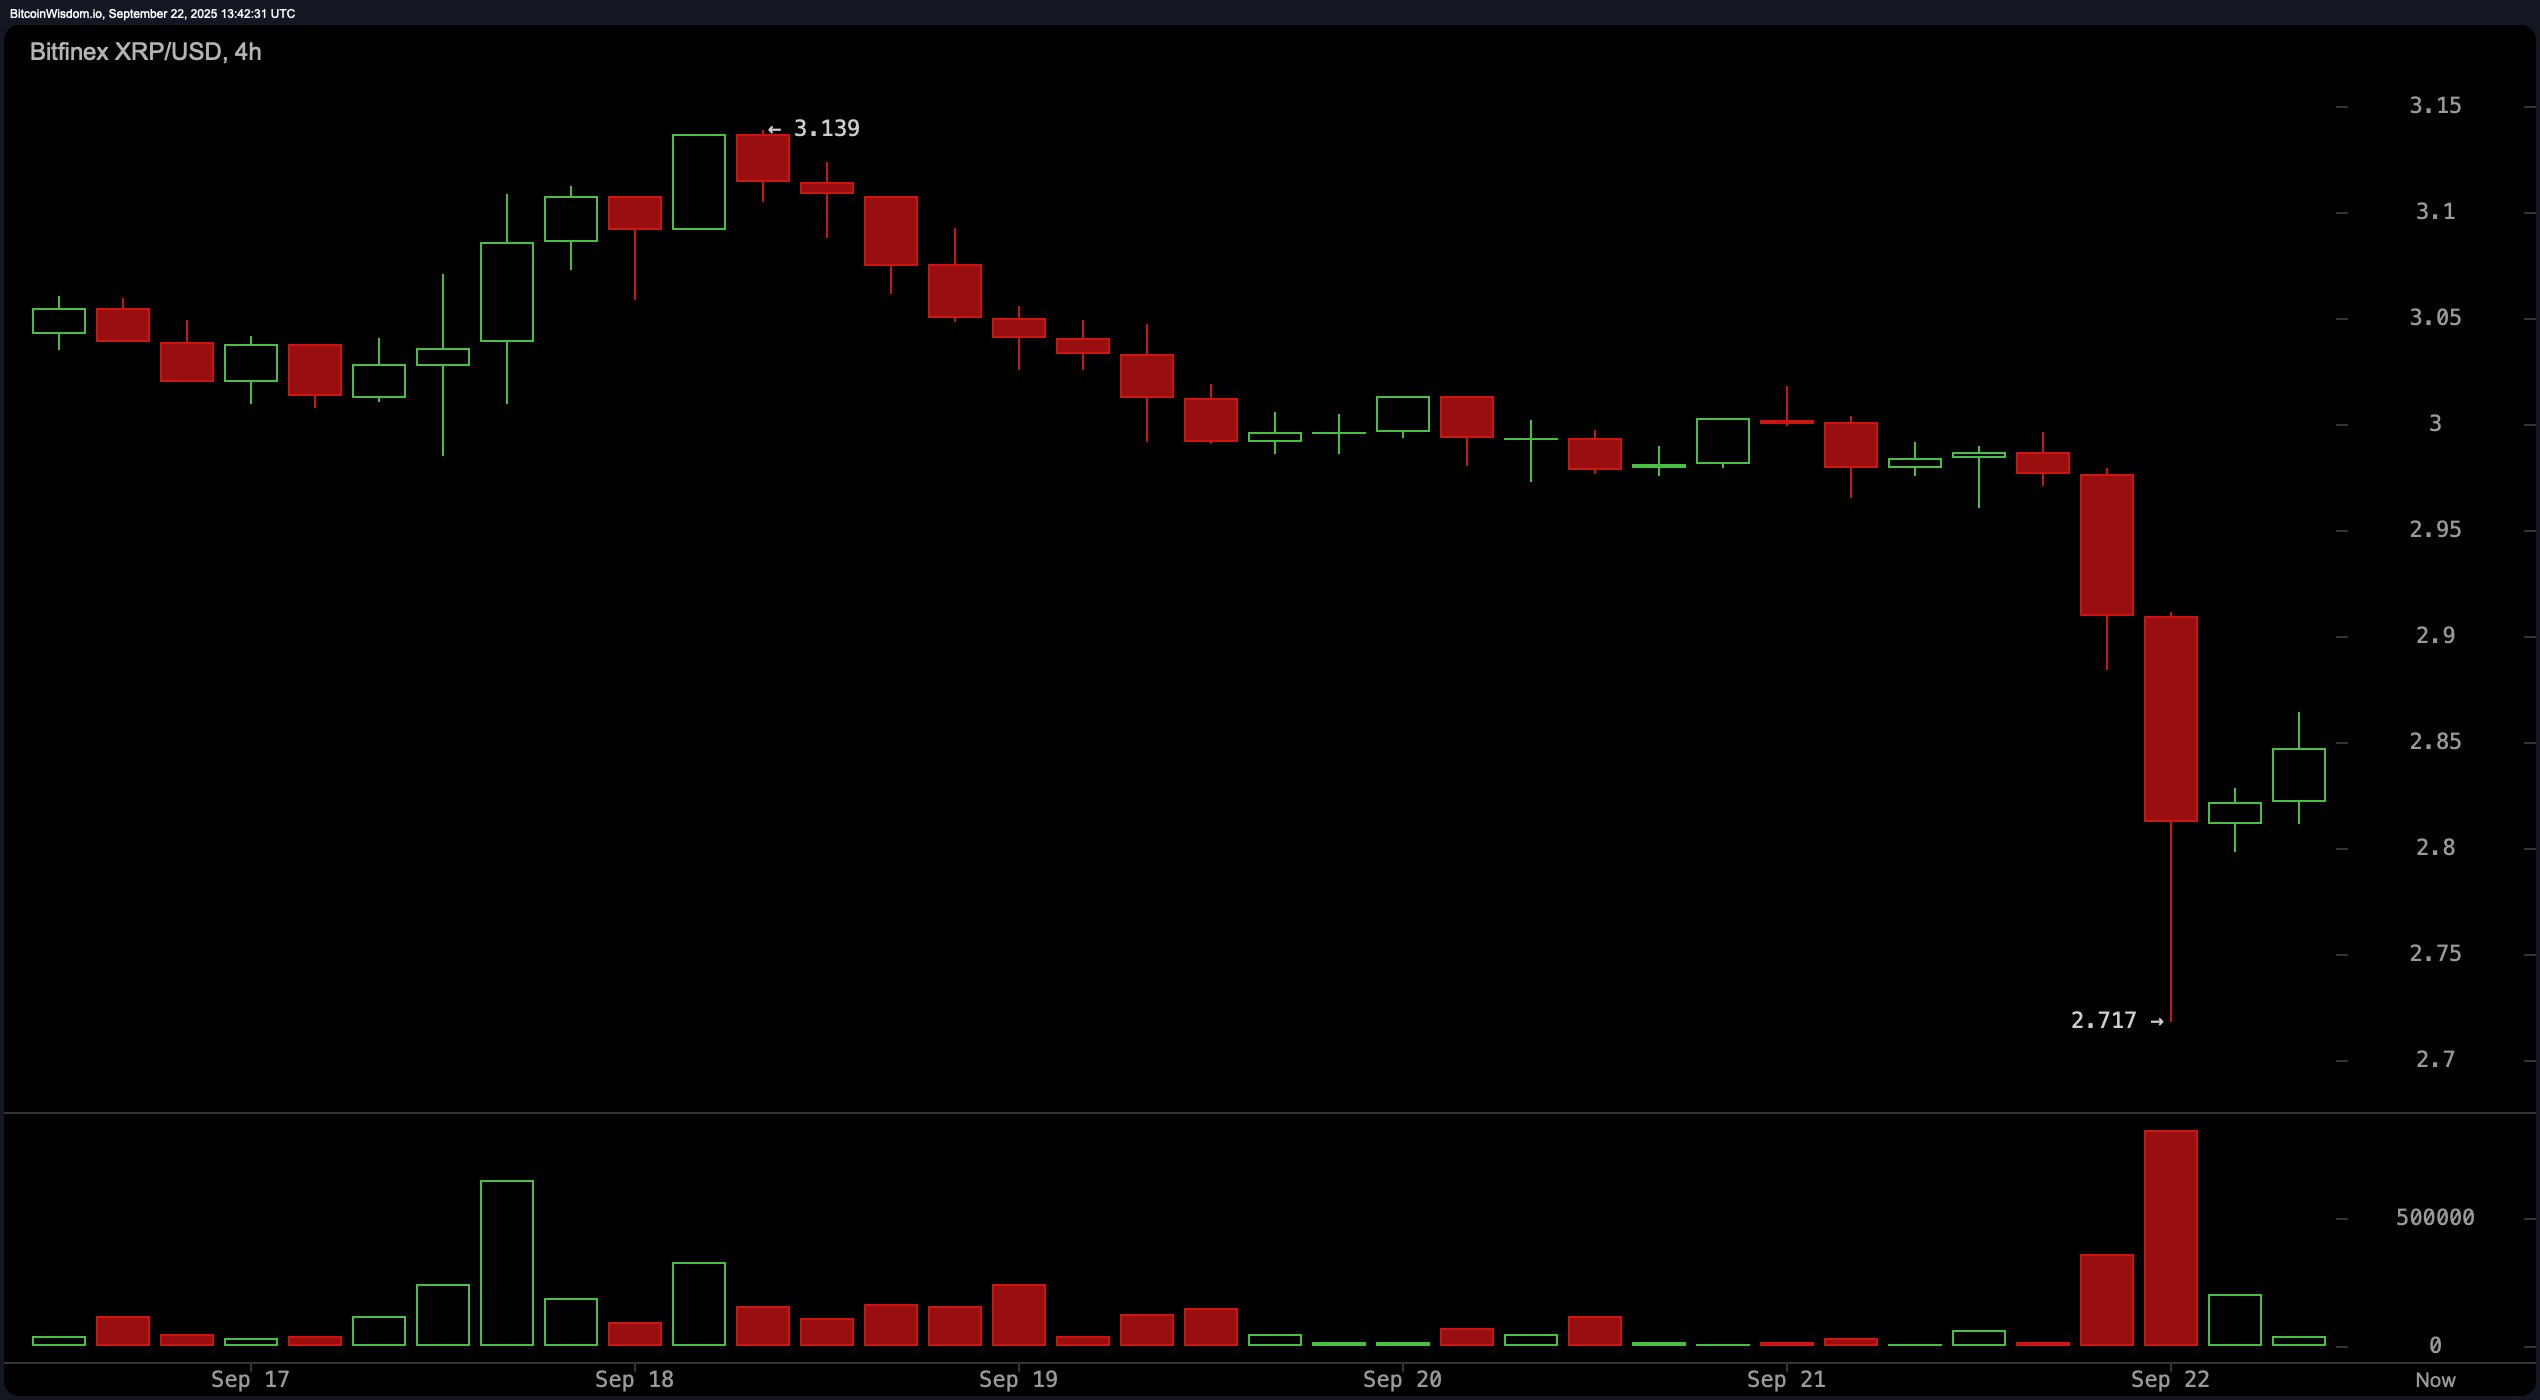
The 4-hour chart presents a rounded top pattern formed after XRP peaked at $3.139, followed by a steep breakdown to $2.717. While there has been a minor recovery with a series of bullish candles, the lack of significant volume indicates that this bounce may not be sustainable. The dominant red candles and weak bullish conviction underscore continued bearish pressure, keeping the bias skewed toward further downside unless bulls reclaim the $2.95–$3.00 resistance zone with strength.

XRP/USD via Bitfinex on Sept. 22, 2025. 4-hour timeframe.
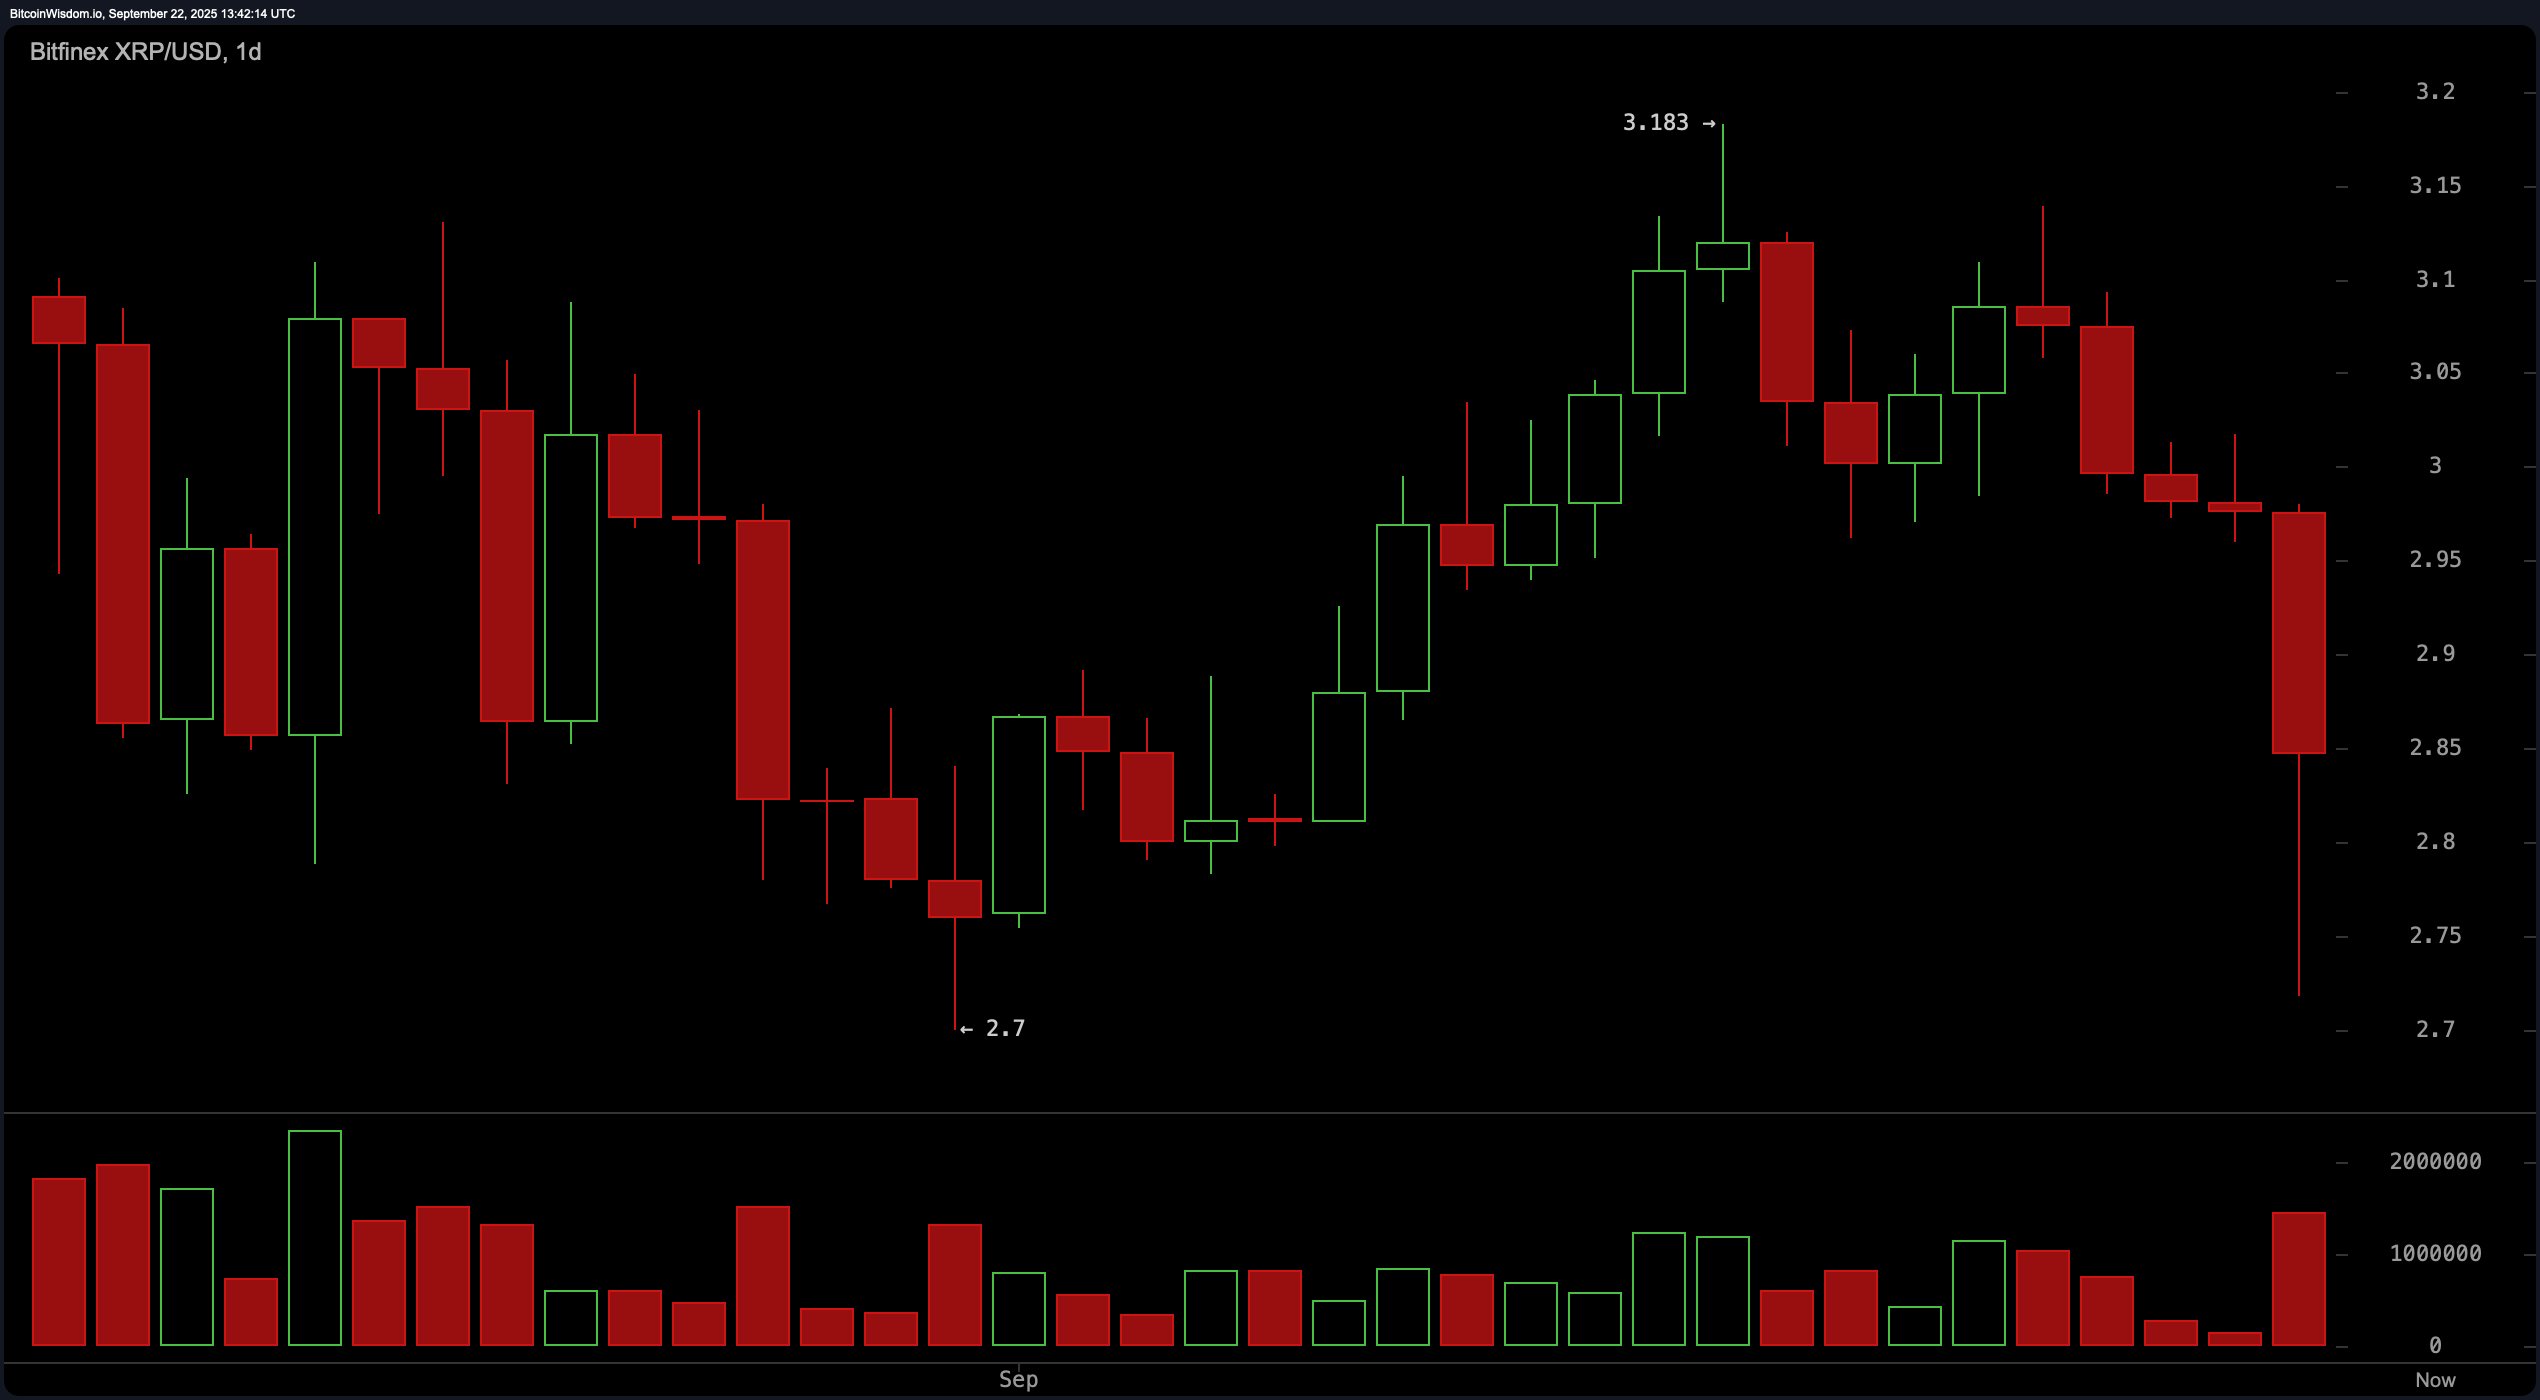
From the daily chart perspective, XRP exhibited a strong uptrend that topped at $3.183 before reversing sharply on a bearish engulfing candle. The recent high-volume selloff and long-bodied red candle are often associated with institutional or panic-driven selling, raising red flags for longer-term investors. Support remains visible between $2.70 and $2.75, and unless that zone holds firm, the price risks testing lower levels around $2.50. A daily close above $3.00 is now critical to reverse sentiment.

XRP/USD via Bitfinex on Sept. 22, 2025. Daily timeframe.
Turning to XRP’s oscillators, most indicators are flashing neutral signals, reflecting market indecision. Today, the relative strength index (RSI) stands at 41.02, the Stochastic oscillator at 36.52, and the commodity channel index (CCI) at -103.67—all suggesting neither overbought nor oversold conditions. The average directional index (ADX) at 15.61 also confirms weak trend strength. However, the momentum indicator at -0.25820 and the moving average convergence divergence (MACD) level at 0.00380 are both signaling a bearish trend, adding to the cautious outlook.
As for the moving averages, shorter-term indicators continue to lean bearish. The exponential moving averages (EMAs) for 10, 20, and 30 periods are at $2.977, $2.977, and $2.974, respectively, with all signaling sell. Similarly, the simple moving averages (SMAs) for the same periods—$3.013, $2.966, and $2.939—also indicate bearish momentum. However, longer-term EMAs and SMAs for the 100 and 200 periods are flashing bullish signals, with the 200-day SMA at $2.530 and EMA at $2.594 offering deeper support. This divergence between short- and long-term indicators suggests XRP is in a correction phase within a broader uptrend.
Bull Verdict:
If XRP maintains support above $2.70 and reclaims the $3.00 resistance level with conviction, the broader uptrend remains intact. Longer-term moving averages suggest structural strength, and the recent selloff could represent a healthy correction before another leg higher toward the $3.10–$3.18 range.
Bear Verdict:
The failure to sustain gains above $3.00, combined with bearish volume and weak short-term momentum indicators, points to further downside risk. If XRP breaks below $2.70, it could trigger a deeper retracement toward $2.50 or lower, as selling pressure remains dominant across intraday timeframes.
免责声明:本文章仅代表作者个人观点,不代表本平台的立场和观点。本文章仅供信息分享,不构成对任何人的任何投资建议。用户与作者之间的任何争议,与本平台无关。如网页中刊载的文章或图片涉及侵权,请提供相关的权利证明和身份证明发送邮件到support@aicoin.com,本平台相关工作人员将会进行核查。


