Decentralized exchanges (DEX) continue to reshape the way cryptocurrency trading is conducted, showing significant growth in trading volume, total locked value (TVL), and institutional interest. A typical example is Uniswap's launch of the v4 upgrade and "hook" mechanism to reduce gas fees and enhance user flexibility, while PancakeSwap set a monthly trading volume record of $325 billion in June 2025. These advancements signify that the DeFi sector is maturing deeply.
Key Data Summary
- In Q2 2025, the global DeFi protocol TVL reached $123.6 billion, a year-on-year increase of 41%.
- Ethereum maintains its dominance, accounting for about 63% (approximately $78.1 billion) of the total DeFi protocol TVL in mid-2025.
- PancakeSwap's trading volume reached $325 billion in June 2025, nearly double the data from May, setting a monthly record.
- As of mid-2025, Uniswap's TVL across all supported chains is approximately $4.5 billion.
- As of Q2 2025, the total market capitalization of the top 100 DeFi tokens is approximately $98.4 billion.
- PancakeSwap recorded 7.4 million unique users in Q2 2025.
1. DEX Dynamics
Uniswap launched its v4 version at the beginning of 2025, introducing a hook mechanism, singleton design, and gas optimization. The v4 version reduces gas costs and improves trading efficiency by directly supporting ETH and reducing reliance on WETH. Within about 177 days of launch, the TVL reached $1 billion, growing faster than v3 during the same period.
PancakeSwap's trading volume reached $325 billion in June 2025, nearly doubling the data from May and setting a monthly record.
Thanks to low fees (approximately $0.0025 per transaction) and fast block times (around 400 milliseconds), developer activity on Solana reportedly increased by 200% year-on-year. Institutional funds (such as Franklin Templeton) are increasing their allocation to DeFi on chains like Solana.
There is a significant increase in large-scale cross-chain activities, particularly represented by the growth of Arbitrum, BNB Chain, Optimism, and Base.
2. User Base and Adoption Trends
As of mid-2025, over 14.2 million unique wallets interacted with DeFi protocols. Some mainstream DEXs have daily trading volumes fluctuating between $1 billion and $2 billion, depending on market volatility. DEX aggregators and routing volumes are increasing, with 1inch and Matcha exceeding $3.9 billion in weekly routing volume.
In Q2 2025, the average weekly trading volume for DEXs was $18.6 billion, a year-on-year increase of about 33%. Among them, PancakeSwap had 7.4 million unique users in Q2 2025.
As of mid-2025, over 9.7 million unique wallets interacted with DEXs, up from about 6.8 million last year. Institutional interest (funds, ETFs) is growing, particularly focusing on scalable chains like Solana and Arbitrum.
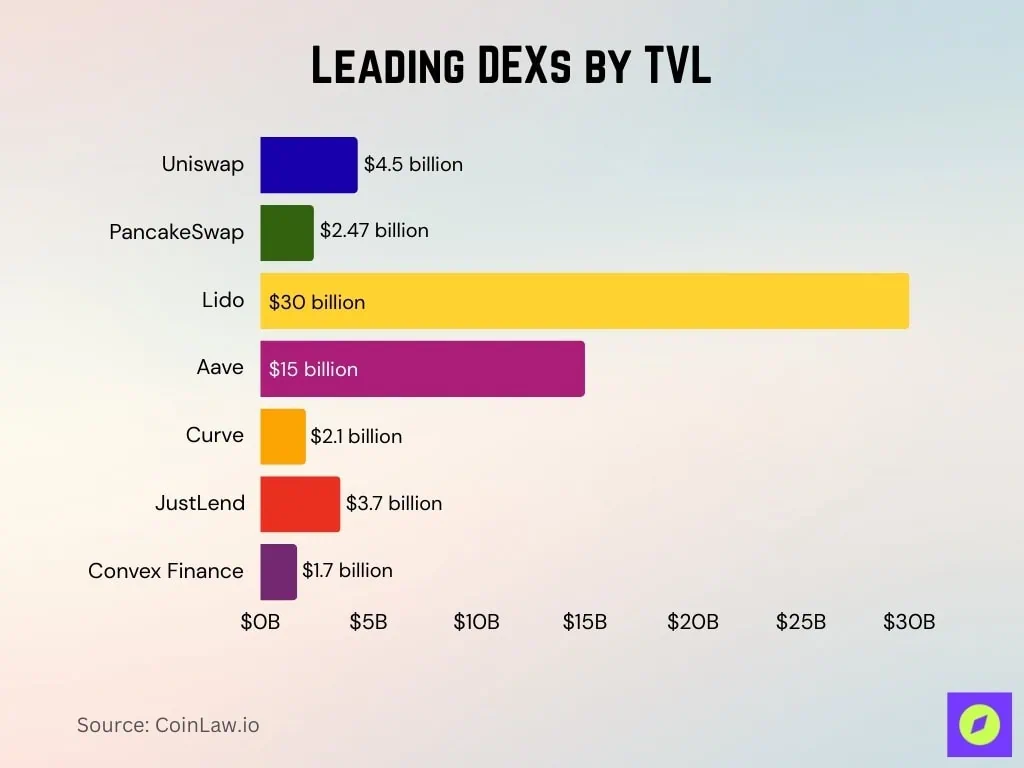
3. Mainstream DEX Ranked by Total Locked Value (TVL)
As of Mid-2025
- Uniswap's cross-chain TVL is approximately $4.5 billion.
- PancakeSwap's TVL is about $2.47 billion, mostly on BNB Chain (approximately $2.18 billion).
- Lido leads DeFi platforms with a TVL of about $30 billion, followed by Aave (approximately $15 billion) and Uniswap (approximately $10 billion).
- Curve Finance's TVL is about $2.1 billion.
- JustLend's TVL is approximately $3.7 billion.
- Convex Finance reports a TVL of about $1.7 billion.
4. Mainstream Trading Pairs on DEXs
The BTC/USDT trading pair remains at the forefront of most DEXs. ETH/USDC and ETH/USDT consistently rank among the top three trading volumes on Ethereum DEXs.
On Solana DEXs like Orca, SOL/USDC and SOL/USDT lead daily trading volumes, with SOL-related trading pairs dominating.
On Uniswap V4, high liquidity pools primarily involve stablecoin swaps and ETH/stablecoin pairs. The BNB/USDT trading pair is widely popular on BNB Chain and multi-chain DEXs, connecting BNB ecosystem tokens.
On chain-agnostic aggregators, cross-chain/multi-hop trading pairs involving USDT, USDC, or ETH frequently appear.
On derivatives DEXs like dYdX, BTC perpetual contracts against USD stablecoins and ETH perpetual contracts against USD remain mainstream trading pairs.
5. Fee Structure and Cost Comparison
Most DEX standard liquidity pool exchange rates range from 0.20% to 0.30%. Some stablecoin pools have lower fees, typically around 0.02% to 0.05%.
The distribution of exchange fees mostly goes to liquidity providers, with a small portion entering the protocol treasury.
Some emerging DEXs are experimenting with 0% listing fees or subsidizing fees to attract liquidity. On derivatives platforms like dYdX, listing and taker fee rates are usually at lower baseline levels.
Gas and network fees remain a significant cost for many users. Aggregators sometimes reduce effective costs by routing to cheaper liquidity pools.
Some DEXs adopt flexible fee models, with higher rates for volatile trading pairs and lower rates for stablecoin pairs.
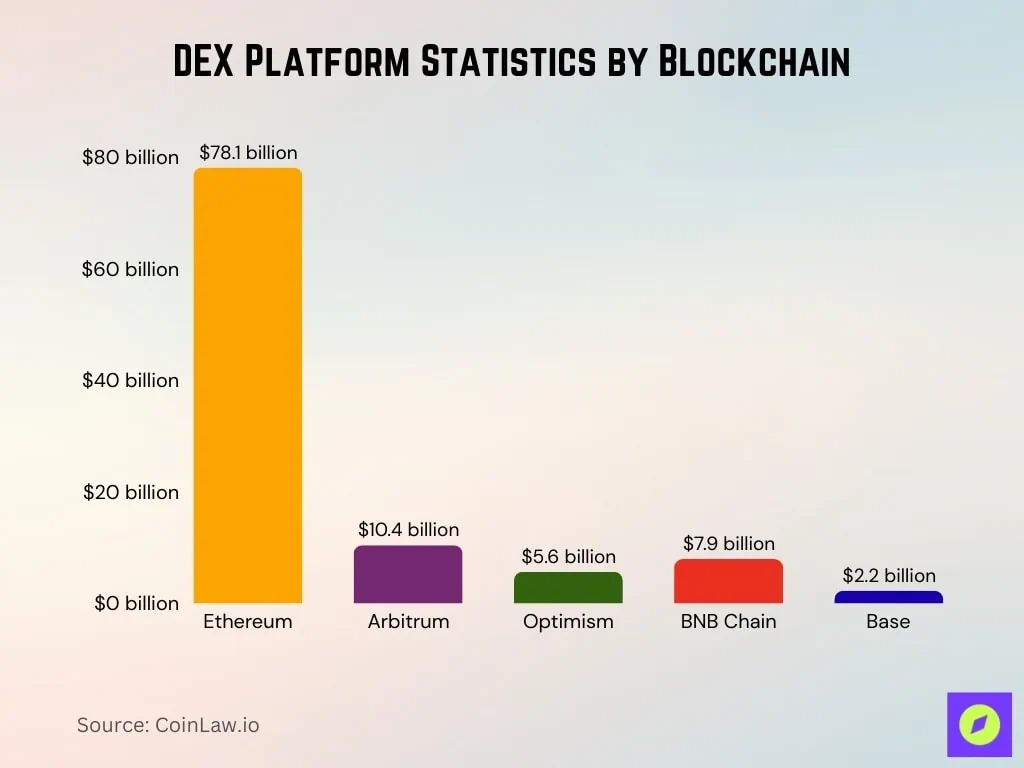
6. DEX Platform Data by Blockchain
- Ethereum: DeFi protocol TVL is approximately $78.1 billion, accounting for about 63% of total DeFi TVL.
- Arbitrum: TVL is approximately $10.4 billion, a year-on-year increase of about 70%.
- Optimism: TVL is approximately $5.6 billion, more than doubling from about $2.3 billion in 2024.
- BNB Chain: TVL has moderately increased to about $7.9 billion.
- Base: TVL is approximately $2.2 billion, continuing to grow since its launch.
- Solana: DEX activity is strong, including high trading volumes, high DEX usage shares, and technical appeal (low fees, fast block times).
- Volume distribution: Approximately 67.5% of Uniswap's daily trading volume now occurs on layer two networks.
- PancakeSwap: Dominates on BNB Chain, but its TVL composition also supports cross-chain activities.
- Liquidity staking protocols: While not strictly DEXs, they account for a significant portion of TVL composition on chains like Ethereum.
7. Liquidity Depth and Slippage Rates
Liquidity depth is higher for stablecoin pools and major asset pairs. For highly volatile or low liquidity tokens, slippage can be significant, reaching over 0.3% to 1%.
The concentrated liquidity model reduces slippage by focusing liquidity on active price ranges. Smart routing and aggregator tools reduce slippage by splitting trades across multiple liquidity pools.
In rapidly changing markets, slippage can spike due to shallow liquidity and MEV activities. The average daily slippage for large trades on mainstream DEXs has decreased compared to previous years. Many high liquidity pools have very small spreads, usually just a few basis points.
Traders' effective costs include slippage, gas fees, routing fees, and exchange fees.
8. Cross-Chain and Multi-Chain DEX Activity
In 2025, DEX trading volume grew by approximately 37%, with an average monthly trading volume of about $412 billion.
Ethereum-based DEXs account for about 87% of decentralized trading volume. Solana DEXs process over $1.5 billion in daily trading volume, demonstrating strong competitiveness. The importance of chains like BNB Chain, Polygon, Base, Arbitrum, and Optimism is increasing.
Cross-chain DEXs and bridges are more frequently used for arbitrage and liquidity migration. The usage of multi-chain supporting aggregators is rising as users seek optimal rates.
Liquidity fragmentation remains a challenge. Some multi-chain DEXs are introducing incentives to attract liquidity to less-used chains.
9. Key Data on the Decentralized Storage Market
The global decentralized storage market was valued at $622.9 million in 2024 and is expected to reach $4.5 billion by 2034.
From 2025 to 2034, the market is projected to expand at a strong compound annual growth rate (CAGR) of 22.4%. The public cloud segment alone is expected to exceed $2 billion by 2034. The enterprise sector accounted for 45% of the market share in 2024, reflecting high institutional adoption.
North America accounted for 40% of the market share in 2024, leading in decentralized storage adoption.
10. Aggregators and Routing Volume
Weekly routing volume through aggregators like 1inch and Matcha exceeds $3.9 billion. The 30-day average trading volume on 1inch is approximately $8.6 billion. The market share of Ethereum DEX aggregators is increasingly concentrated.
Aggregators serve as middleware, becoming an entry point for institutional funds, improving execution through gas optimization, MEV protection, and cross-chain routing. Some aggregators are building KYC and compliance features to attract institutions.
Aggregated routing often spans multiple chains, increasing bridging risks and complexity.
11. Smart Contract Audits and Security Incidents
In Q1 2025, Web3 lost over $2 billion due to vulnerabilities and attacks. In August 2025, 16 security incidents collectively stole $163 million.
- Cetus DEX was hacked in May 2025, resulting in losses of approximately $223 million to $260 million.
- New Gold Protocol lost $2 million due to a flash loan vulnerability.
- Nemo Protocol on Sui suffered approximately $2.6 million in exploits.
About 80% of the total losses in crypto assets stem from DeFi protocols. While formal verification and audits can reduce losses, adoption varies.
Vulnerabilities caused by unaudited code and logical flaws persist, hitting smaller DEXs the hardest.
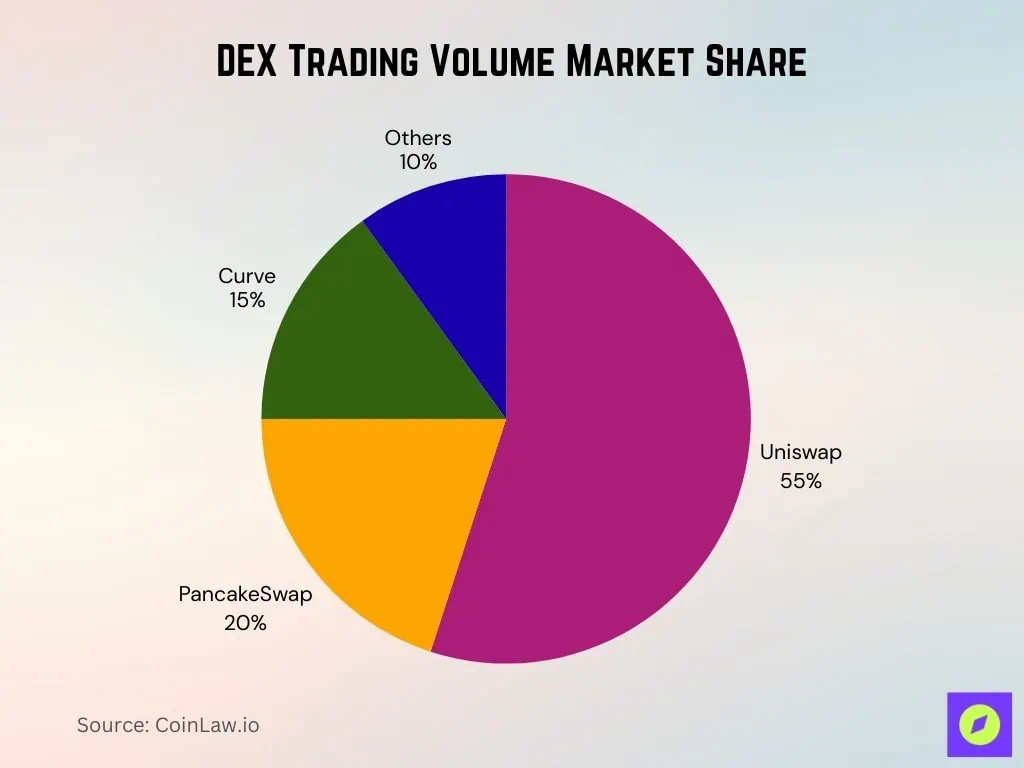
12. Trading Volume Market Share
→ Uniswap dominates the DEX market with a 55% share, being the absolute leader in trading volume.
→ PancakeSwap holds 20%, firmly in second place among decentralized exchanges.
→ Curve accounts for 15%, performing strongly in liquidity provision and stablecoin swaps.
→ Other DEXs collectively account for 10%, forming a smaller but still competitive market segment.
13. Regulatory and Compliance Data
In July 2025, the U.S. passed the "GENIUS Act," establishing a regulatory framework for stablecoin issuers.
By 2025, 90% of centralized crypto exchanges in North America fully comply with KYC requirements; the average compliance cost for crypto companies increased by about 28% in 2025, reaching an annual average of $620,000. Anti-money laundering (AML) and KYC protocols now consume about 34% of compliance budgets.
Enforcement actions by the U.S. Commodity Futures Trading Commission (CFTC) increased by about 59% year-on-year.
14. Growth of DEX Derivatives and Perpetual Contracts
In Q2 2025, the trading volume of DEX perpetual futures reached $898 billion.
Hyperliquid recorded a trading volume of $653 billion in the second quarter, capturing approximately 73% market share. dYdX remains one of the top decentralized derivatives exchanges.
- The growth momentum comes from the demand for leverage, speculation, and hedging tools.
- Institutional traders are increasingly participating in the perpetual contract market.
- Risks and compliance concerns remain major obstacles.
- Cross-chain perpetual contract products are emerging, accompanied by opportunities and risks.
- For several quarters, the growth rate of derivatives trading volume has outpaced that of spot DEXs.
15. DEX User Demographics and Regional Distribution
As of mid-2025, over 9.7 million unique wallets interacted with DEXs, up from about 6.8 million last year.
Daily trading volume is concentrated in North America, Europe, and Asia. Among them, developing countries show a higher growth rate in DEX adoption. Institutional users are concentrated in jurisdictions with clearer regulations. The gender distribution still leans towards male, but there is a slight shift.
Small transactions in Asia and Africa have a higher adoption rate on low-fee chains.
16. Conclusion
There are clear signs of maturity in the DEX space.
Aggregators are not only tools for retail users but are gradually becoming key infrastructure for institutions. However, risks remain high, with exploits, security missteps, and regulatory uncertainty posing real threats.
The trading of DEX derivatives and perpetual contracts is experiencing explosive growth, with increased appeal for mobile and wallet-integrated platforms, and global user adoption continues to rise.
For traders and protocol developers, key points include:
- Choosing DEXs or aggregators that have undergone rigorous security audits.
- Prioritizing chains and tools that can reduce fees and slippage.
As DEXs increasingly approach centralized alternatives in terms of trading volume, liquidity depth, and trust, the coming years will test which platforms can withstand the challenges of security, compliance, and usability.
免责声明:本文章仅代表作者个人观点,不代表本平台的立场和观点。本文章仅供信息分享,不构成对任何人的任何投资建议。用户与作者之间的任何争议,与本平台无关。如网页中刊载的文章或图片涉及侵权,请提供相关的权利证明和身份证明发送邮件到support@aicoin.com,本平台相关工作人员将会进行核查。


