Key Indicators for Success in the Lending Market: Loan Volume and Supply of Underlying Assets.
Author: jake (Handsome Jake)
Translation: Deep Tide TechFlow
The metrics for DeFi have become obsolete, and most of us have yet to realize it.
Today, we will re-examine this metric from the perspective of lending.
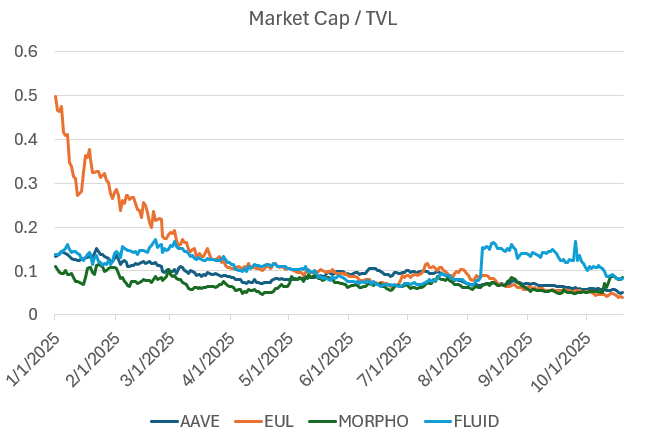
The relationship between the lending market and TVL
As seen, TVL (Total Value Locked) is often used as a reference metric for evaluating lending protocols. However, through discussions with most major DeFi lending teams, we found that TVL tends to obscure issues rather than reveal them, leading to misjudgments by risk assessors.
Here are our attempts and findings to go beyond surface growth and delve into the core operational mechanisms of the DeFi system:
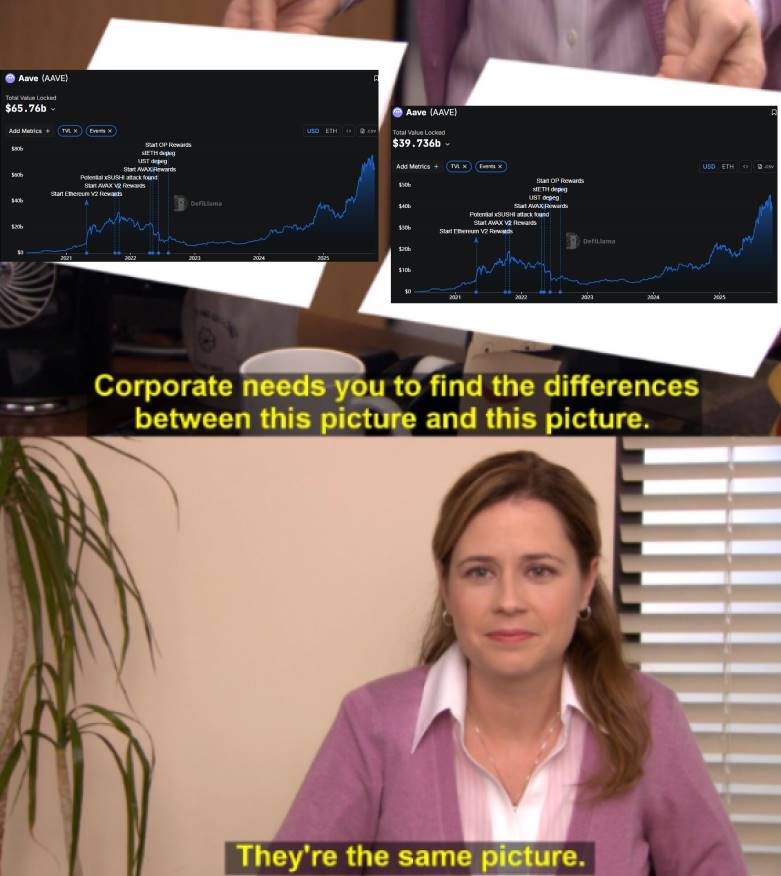
TVL is a Poor Metric for Measuring Lending
In 2019, we adopted TVL as a benchmark. When experimenting with early DeFi protocols (such as Maker, Compound, Uniswap, Bancor, etc.), Scott Lewis and the Defi Pulse team invented the TVL metric to compare different protocols (like comparing "apples to oranges"). At that time, when the market only had xyk AMM (constant product automated market makers), TVL was a decent metric. However, as the industry matured, we began optimizing capital efficiency (such as Uniswap v3, Pendle & Looping, Euler, Morpho, etc.), and the insights from TVL gradually diminished.
In other words, our design space has shifted from "Can we do it?" to "How well can we do it?"; and TVL can only track the former. Clearly, we need better metrics to measure the latter today.
One issue with TVL in lending is that its definition can refer to two situations:
Total Capital Supply, regardless of the loaned amount; if $1 billion is deposited in the protocol, the TVL will show $1 billion whether or not any funds are borrowed.
Total Capital Supply minus the Loaned Portion; if $1 billion is deposited in the protocol, and $500 million is borrowed, the TVL will show $500 million.
This definitional ambiguity leaves risk assessors at a loss. Even in the two cases above, "TVL" may refer to entirely different capital bases.
Furthermore, both definitions are flawed and do not truly reflect the health of the protocol:
Total Supply: Does not indicate how much lending activity the protocol actually facilitates.
Total Supply minus the Loaned Portion: Fails to reflect capital efficiency and merely rewards idle capital.
An efficient lending protocol should be able to match borrowers and lenders effectively and at scale, while the existing TVL definitions fail to capture this dynamic.
At best, TVL can only provide risk assessors with a vague concept of "scale."
Lending platforms were once used for leveraged trading and risk exposure management, but this has changed.
Historically, the lending market was primarily used for leveraged long and short trading. However, with the emergence of Hyperliquid (a perpetual contract exchange that requires no KYC and reduces counterparty risk), the widespread use of perpetual contracts has made them a more favorable tool for expressing directional views.
Additionally, the lending market tends to avoid adding lower-rated assets, while decentralized exchanges for perpetual contracts compete to list these assets more quickly. For traders, eliminating the need for manual leverage operations and gaining quicker access to new assets is clearly a significant enhancement in user experience.
In comparison, we can look back at Aave's asset usage during its early stages, specifically the top assets at the end of the last cycle.
Top Assets on Aave (April 26, 2022):
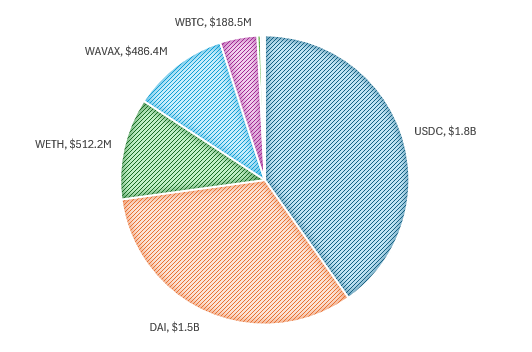
The usage patterns at that time were relatively simple:
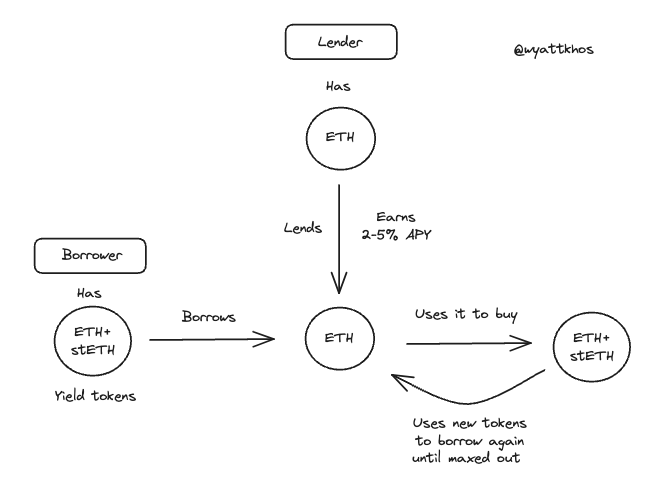
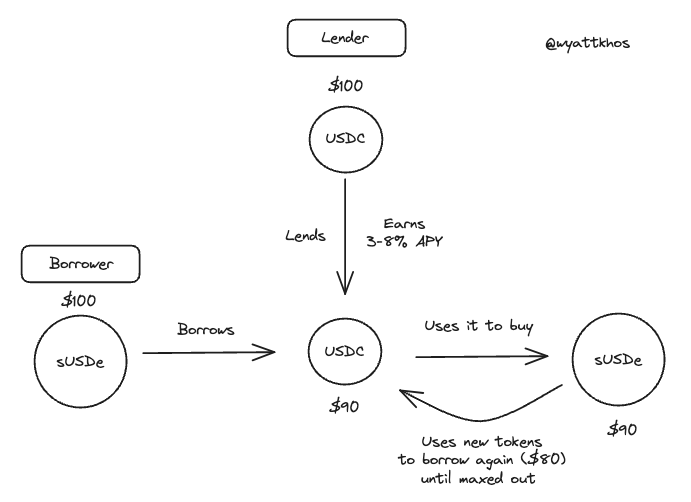
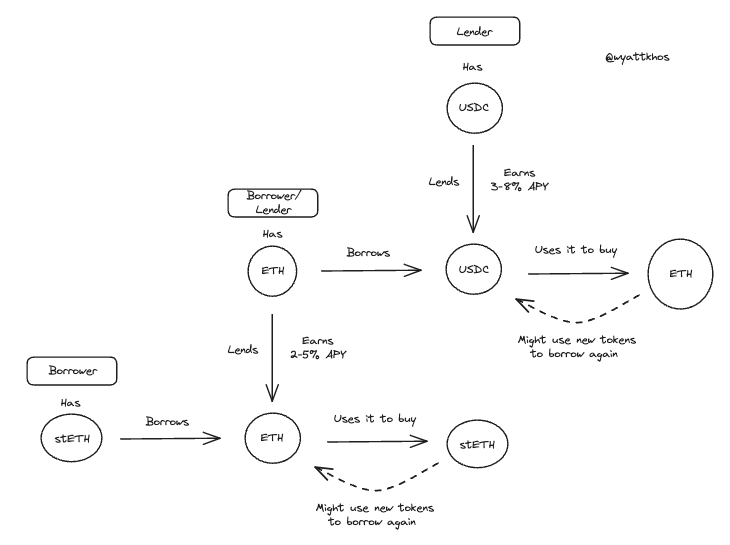
Lenders: Provided stablecoins (mainly USDC and DAI) to earn yields, with annual yields typically ranging from 3% to 8%, depending on market conditions.
Borrowers: Used blue-chip assets (like BTC or ETH) as collateral to borrow stablecoins for reinvestment while maintaining risk exposure or leveraging to purchase more of the same assets.
Typical Early Aave User Flow:
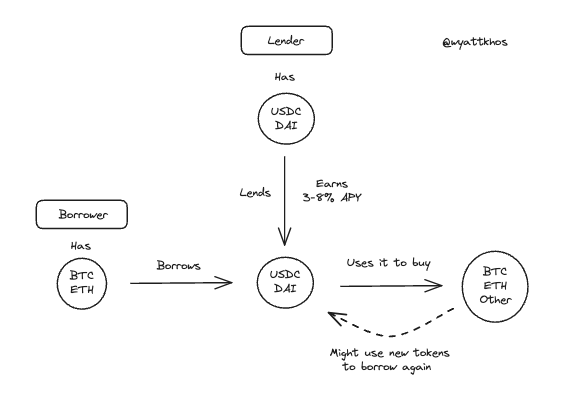
This model still exists but is no longer dominant. Perpetual contracts have become a competitive tool for trading long and short based on collateral assets, while the lending market has gradually shifted to other uses.
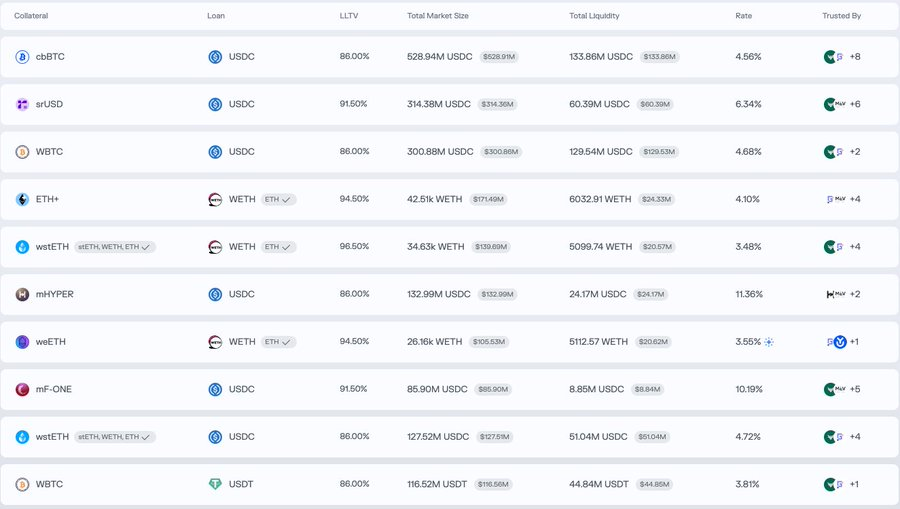
To understand the current usage of the lending market, we can look at the leading markets on Morpho. Aside from the BTC market (like cbBTC and WBTC), its main trading pairs show different activity patterns, leaning more towards optimizing yield or liquidity rather than directional leverage:
Deposit ETH+, Borrow WETH
Deposit wstETH, Borrow WETH
Deposit mHYPER, Borrow USDC
Deposit mF-ONE, Borrow USDC

From these examples, we can draw the following conclusion.
Yield Cycling is Currently the Main Application in the DeFi Lending Market
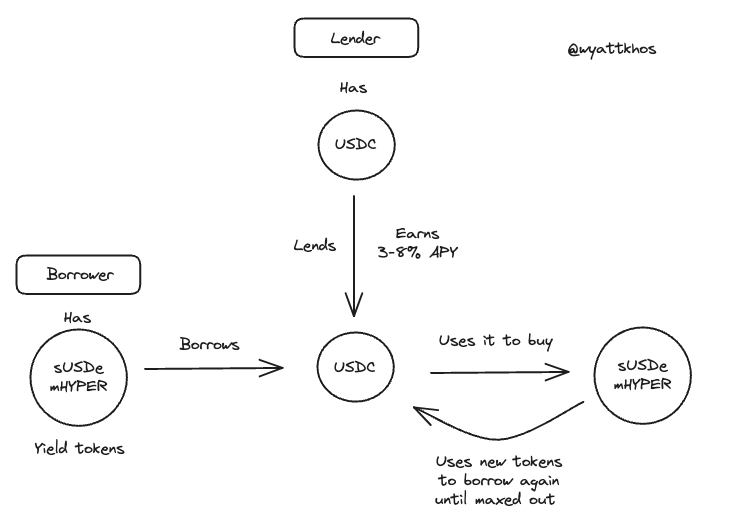
In the aforementioned Morpho example, users deposit a yield-bearing asset and borrow a non-yielding counterpart, then use the borrowed funds to purchase more of the original yield-bearing asset, continuously repeating this process to amplify returns.
Here are some practical examples of cyclical trading:
- ETH - stETH Cyclical Trading
- sUSDe/mHYPER - USDC Cyclical Trading
Ethena's USDe has become a key driver behind the recent surge in yield cycling strategies. This type of trading has now become very common, primarily relying on Aave and Pendle, but can also be replicated with other yield assets. The sustainability of this strategy directly depends on the quality and stability of the underlying yield. As @shaundadevens mentioned in a tweet in August, this market behavior has a clear description.
These cyclical strategies typically combine the following three components:
A yield-bearing "stablecoin"
Pendle, for yield stripping
A lending market for leveraging
However, the scale of this trading is constrained by two key limiting factors:
1 - Liquidity of the Underlying Asset
There must be sufficient stablecoin liquidity available for lending.
2 - The Strategy's Yield Must Exceed Borrowing Costs
If borrowing costs approach or exceed the underlying yield, the strategy will collapse. Therefore, any new cyclical strategy must generate a yield higher than USDe. Why? Because, as shown in the following diagram, the yield of USDe has effectively become the capital cost of DeFi, i.e., the risk-free rate. Similarly, the risk-free rate of ETH typically tracks the most reliable ETH yield sources (like staking rewards).
The impact of these relevant interest rates on the DeFi design space cannot be underestimated.
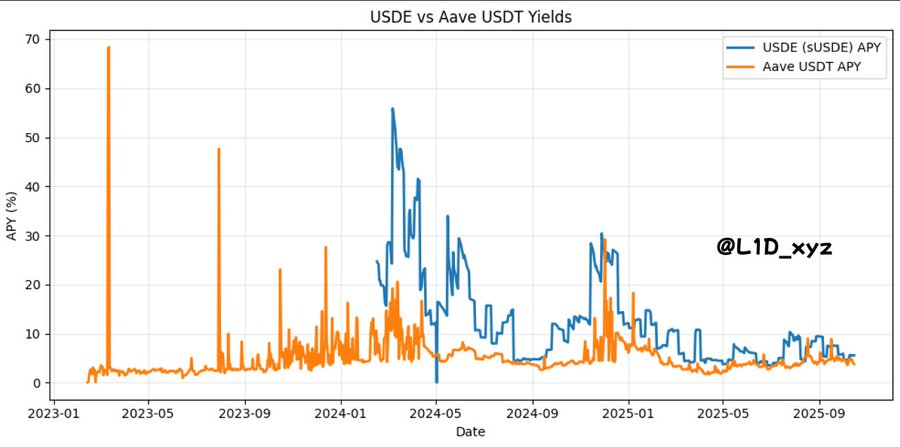
As revealed by @TraderNoah
In other words—though some may find it hard to accept—currently, the yield of USDe can be viewed as the "government bond yield" of our industry.
This indeed carries a deeper meaning: our digital "nation" is built on speculation, and thus our "government bond yield" should naturally be a speculative proxy derived from the yield of the underlying trades.
As long as the lending protocol can maintain sufficient supply of underlying assets (such as stablecoins like USDC, USDT, and DAI, as well as underlying assets like ETH and wBTC), the "cyclical trading" model can drive rapid expansion of TVL.
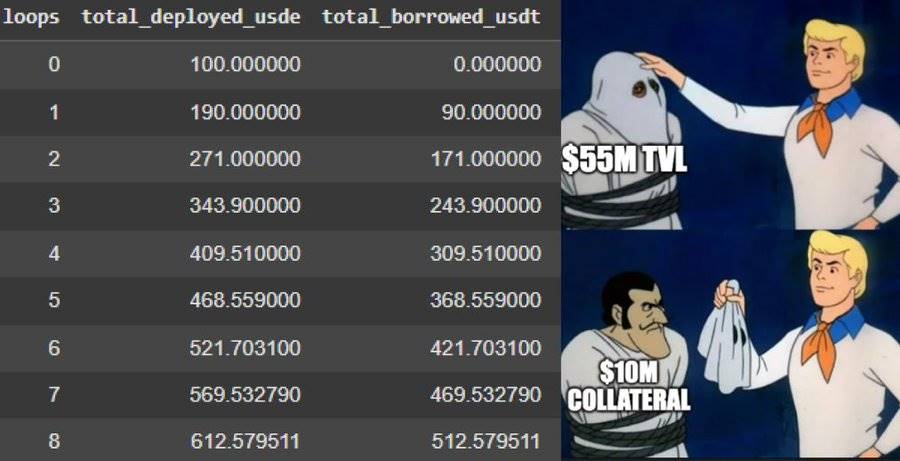
However, this also exposes the issue of TVL as a metric for lending protocols: borrowers deposit assets, borrow funds, and then re-deposit the borrowed funds. This process is typically limited to five to ten repetitions based on the loan-to-value ratio (LTV). The end result is that TVL data is artificially inflated: the protocol counts the original deposit, the borrower's initial deposit, and the funds re-deposited in each cycle.
Example: sUSDe - USDC Cyclical Trading (using $100 as an example)
In this case, before the transaction occurs, the borrower provides $100 worth of assets to the lending protocol, which counts as $100 TVL.
However, after the transaction occurs, when the borrower cycles in $100, the TVL will appear as follows:
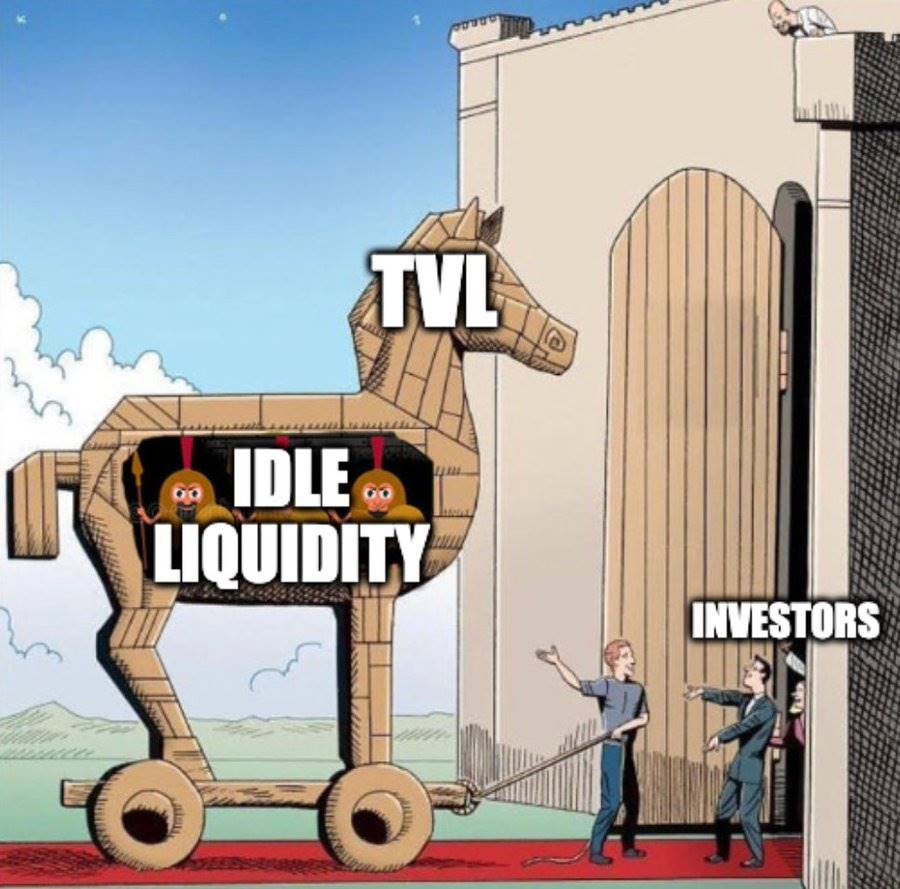
Nevertheless, TVL is merely a proxy metric for measuring platform supply. But the supply itself is not an excellent measure; more importantly:
Key Indicators for Success in the Lending Market: Loan Volume and Supply of Underlying Assets
The supply of unborrowed assets does not generate income for the protocol; what truly drives income is the lending of assets.
As risk assessors, our responsibility is to understand the revenue drivers of the business and the bottlenecks of these drivers—within the lending market, the lending of assets drives the business through loan issuance and service fees, while the supply of underlying assets is the bottleneck in this process.
After discussions with industry experts, we found that more underlying assets (especially stablecoins) are the core indicators of success in the lending market.
"If we receive $200 million in USDC today, it will be fully borrowed out by tomorrow."
Therefore, a deep supply of USDC, along with the supply of other assets (such as ETH and large assets with staking yields), is the primary value that the lending market can provide to users and the goal that users pursue. More stablecoins mean more cyclical trading, leading to more activity and fees. If the lending market can attract more underlying assets, it will facilitate more lending matches, attract more users, and generate more income, among other benefits.
Conversely, long-tail assets contribute little to the lending market, adding complexity and risk with almost no other benefits. While these assets may attract users who are less sensitive to fees, "there's no such thing as a free lunch."
How to Attract More Underlying Assets?
The answer lies in: better distribution mechanisms and higher yields on underlying assets.
What can create higher yields on underlying assets?
This traces back to how borrowers generate yields and what yields are considered "safe" in the market.
In many modern lending markets, the assets used as collateral by borrowers (such as sUSDe for borrowing USDC) can also be used as borrowed capital, which can then be borrowed by another user. Depending on the nature of the collateralized assets, they may be useful to other users (like ETH) or not (like stETH).
For example, on Euler, we can see that the utilization rates of major stablecoins (like RLUSD and USDC) are very high, while there is almost no lending activity for long-tail yield-bearing derivative assets.
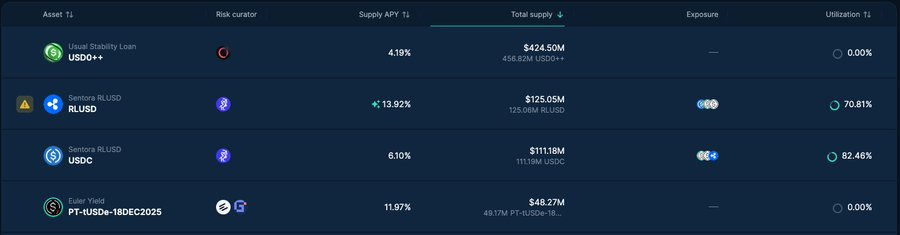
If the proportion of long-tail tokens in a lending market is too high relative to the underlying assets, it indicates that there are overall more useless assets, which may suggest "liquidity mining" or incentivized idle liquidity.
So, how can the protocol become more efficient in its supply and borrowed assets, as well as preferred transactions?
Why is asset link reuse (re-collateralization) useful?
In the lending market, the utility of certain asset pairs is significantly higher than that of others, or they are more "attractive." Here are a few specific examples:
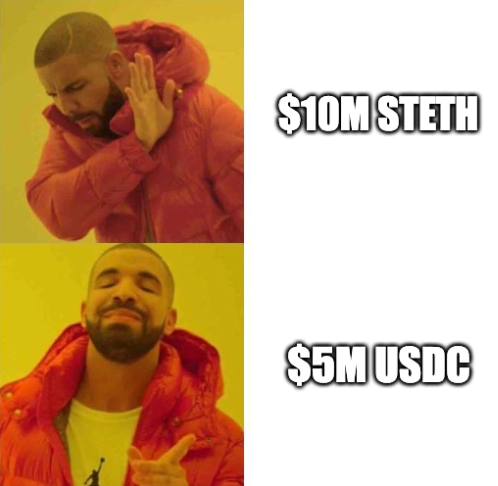
Suppose User 1 deposits stETH (staked ETH) to borrow ETH and purchase more stETH. This is a reasonable and feasible transaction as long as the user can borrow ETH at a rate lower than the stETH rewards. However, in this case, other users are likely unwilling to borrow the stETH provided by User 1. This transaction makes sense for the lending protocol, but in this example, the situation ends there.
Now consider another scenario where User 2 deposits ETH to borrow USDC and uses the borrowed USDC to purchase more ETH. In this case, it becomes even more "attractive" for the lending protocol. Why? Because the entire transaction chain of User 1 can directly utilize the ETH deposited by User 2 to complete the transaction. In other words, User 2's trading behavior creates the possibility for additional cyclical trading. In situations where underlying assets (like ETH or USDC) are scarce, User 2's actions can be seen as enabling the lending protocol to support two complete cyclical trades, while User 1's actions can only support one.
Example Lending Flow for User 1 and User 2:
This is what truly drives "capital efficiency" and asset utilization. Generally speaking, if the protocol can generate more trading activity between underlying assets, such as depositing BTC to borrow USDC or depositing ETH to borrow USDC, this is very valuable for the protocol, as it can layer more activity on top of the initial transaction.
The Difficulty of Measuring System Leverage is Dangerous
To summarize, we find the most concerning issue is that, amidst all the intertwined lending, chain trading, and cyclical trading, it seems difficult to accurately identify how much leverage is being used throughout the entire system.
For example, if a protocol has $1 billion in stETH and a loan-to-value ratio (LTV) of 75%, then the composition of this asset could be one of the following scenarios:
$500 million is the initially deposited stETH, and another $500 million is borrowed funds.
$300 million is the initially deposited stETH, and another $700 million is borrowed funds.
We have no good way to determine the specific situation, so we can only guess: if the market experiences large-scale liquidations or a general downturn leading to user withdrawals, how many assets would be sold off?

For those readers who are smarter than us, if anyone has a good method for identifying system leverage levels, we would be very eager to hear your suggestions.
免责声明:本文章仅代表作者个人观点,不代表本平台的立场和观点。本文章仅供信息分享,不构成对任何人的任何投资建议。用户与作者之间的任何争议,与本平台无关。如网页中刊载的文章或图片涉及侵权,请提供相关的权利证明和身份证明发送邮件到support@aicoin.com,本平台相关工作人员将会进行核查。