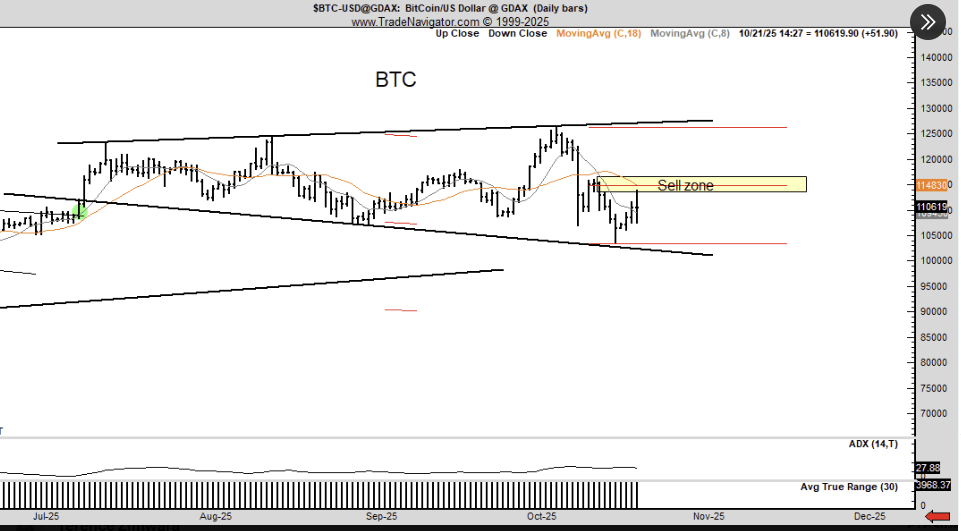
Veteran futures trader Peter Brandt has asserted that bitcoin ( BTC) is exhibiting a dangerous price pattern, comparing its current chart to that of soybeans in 1977 just before a massive price decline. In a post on X, Brandt noted that BTC is forming a “broadening top,” a bearish chart pattern that typically signals a potential reversal from an uptrend to a downtrend.
Since reaching a peak above $126,000 on Oct. 6, BTC has entered a turbulent period of price action, repeatedly swinging between a floor of approximately $108,000 and a ceiling near $115,000. This pattern of progressively higher highs and lower lows—the hallmark of a broadening formation—reflects intensifying market uncertainty. It appears to echo the volatility observed immediately following the cryptocurrency’s previous all-time high of just over $124,000 on Aug. 14.

According to technical analysts, a broadening top is characterized by the widening range between the highs and lows, which reflects growing market uncertainty and indecision. Brandt’s shared chart showed BTC seemingly forming this pattern since July. This action appears consistent with the soybean price between March and June 1977, which was followed by a sharp decline.
Brandt, who acknowledges his assessment could be wrong, issued a bold warning about the potential consequences of a breakdown:
A 50% decline in BTC will put MSTR [Strategy], a major Bitcoin treasury company, underwater. Whether I am right or wrong, you have to admit this old guy has the gonads to make big calls.
Brandt’s prediction seemingly resonated with fellow chartists who cite emerging signs of buyer exhaustion.
However, the analogy immediately faced fierce pushback from BTC advocates, who argued the comparison to 1977 soybeans was inherently flawed due to fundamental differences in market dynamics. While the soybean market of that era was driven down by chronic overproduction and supply saturation, BTC is defined by its finite and highly inelastic supply schedule.
One critic highlights that the forces driving any BTC price drop are typically market leverage and whale activity, not the overwhelming excess supply that led to the historical commodity’s collapse.
“Each chart reveals market dynamics beyond patterns. Soybean overproduction, building since the early 1970s, peaked in the late 1970s, saturating the market. Bitcoin has growing demand and highly inelastic supply. The price may drop from whales selling, but leverage is the driving force. Thus, these charts are as different as apples and oranges,” argued one social media user.
- What pattern did Peter Brandt spot in bitcoin’s chart? He identified a “broadening top,” a bearish signal that may indicate a price reversal.
- How has bitcoin traded since its October peak? BTC has swung between $108K and $115K, showing rising volatility and market uncertainty.
- Why did Brandt compare bitcoin to soybeans in 1977? He sees similar chart behavior before soybeans crashed, warning BTC could face a sharp decline.
- What do critics say about Brandt’s comparison? They argue Bitcoin’s fixed supply and leverage-driven drops make the analogy flawed and misleading.
免责声明:本文章仅代表作者个人观点,不代表本平台的立场和观点。本文章仅供信息分享,不构成对任何人的任何投资建议。用户与作者之间的任何争议,与本平台无关。如网页中刊载的文章或图片涉及侵权,请提供相关的权利证明和身份证明发送邮件到support@aicoin.com,本平台相关工作人员将会进行核查。


