Author: Lasse Clausen, Christopher Heymann, Robert Koschig, Clare He, Johannes Säuberlich
Compiled by: Jiahua, ChainCatcher
8 Key Conclusions
- On-chain revenue becomes a $20 billion economic powerhouse
- DeFi dominates on-chain revenue by 2025
- Maturity of blockchain technology leads to a decrease in transaction fees, paving the way for explosive growth in the application layer (year-on-year growth of 126%)
- Asset prices are an obvious revenue driver, but more efficient infrastructure is becoming a new driving force
- While the top 20 protocols contribute 70% of the revenue, innovators can disrupt existing giants at an unprecedented pace
- Although the application layer shows a stronger causal relationship between revenue and valuation, blockchain still dominates total market capitalization
- Tokenization, DePIN, wallets, and consumer applications are high-growth areas worth watching
- On-chain fees are expected to achieve a 60% year-on-year growth by 2026, with all growth attributed to the application layer
This report is the first comprehensive analysis aggregating data on over 1,000 protocols regarding on-chain fees, covering industry trends, revenue drivers, fee distribution, and valuation impacts. On-chain fees paid by users are the clearest signal of value creation by protocols, but must be understood in context:
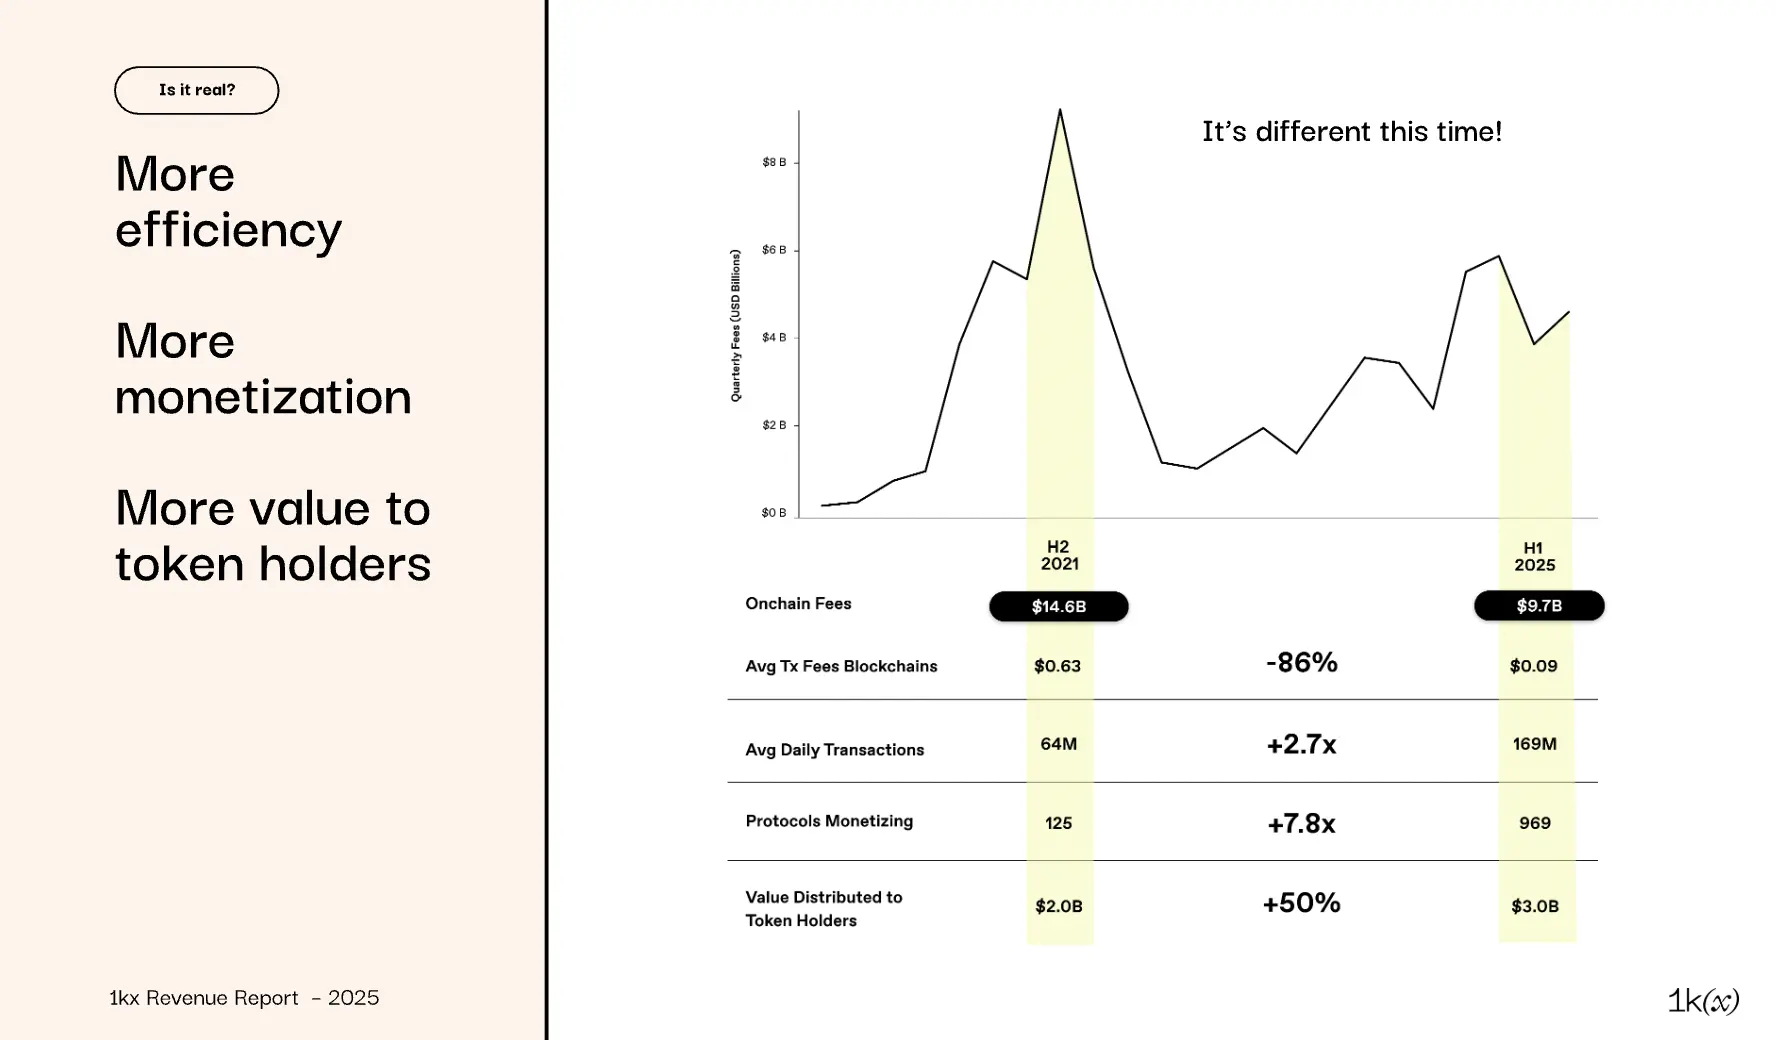
At the peak of the bull market in 2021, quarterly fees reached $9.2 billion, primarily dominated by a few proof-of-work (PoW) blockchains; among them, Ethereum accounted for about 40%, as speculative sentiment soared and users were insensitive to high transaction costs.
By 2025, transaction costs are expected to decrease by about 90%, optimizing network efficiency and expanding the user base, allowing applications to achieve sustainable monetization on blockchain infrastructure. Regulatory barriers limiting investor participation are also gradually being relaxed.
These changes collectively mark the entry of digital asset monetization into a more mature phase, with protocol value creation increasingly aligning with investability: the light blue line shows that the value distributed to token holders has reached an all-time high, and efficiency improvements allow revenue to effectively flow back. Therefore, now is the time for investors to focus on the mature monetization of protocols. 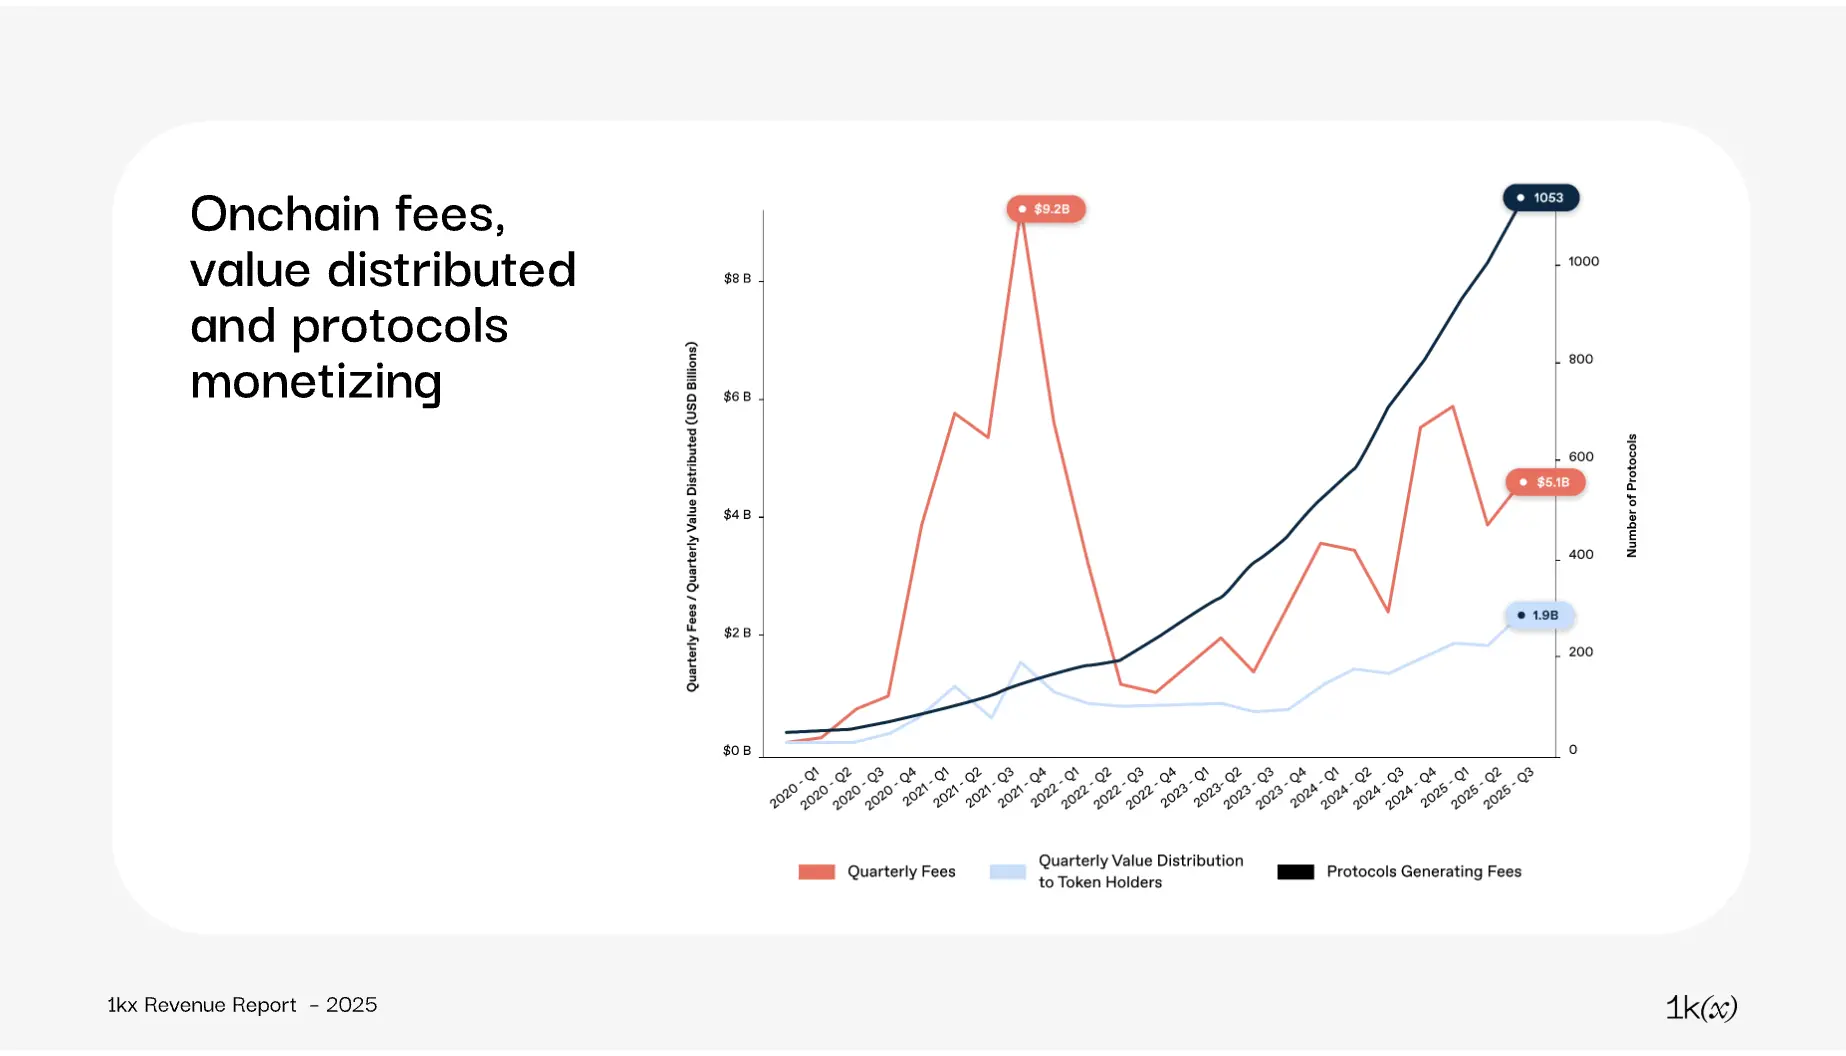
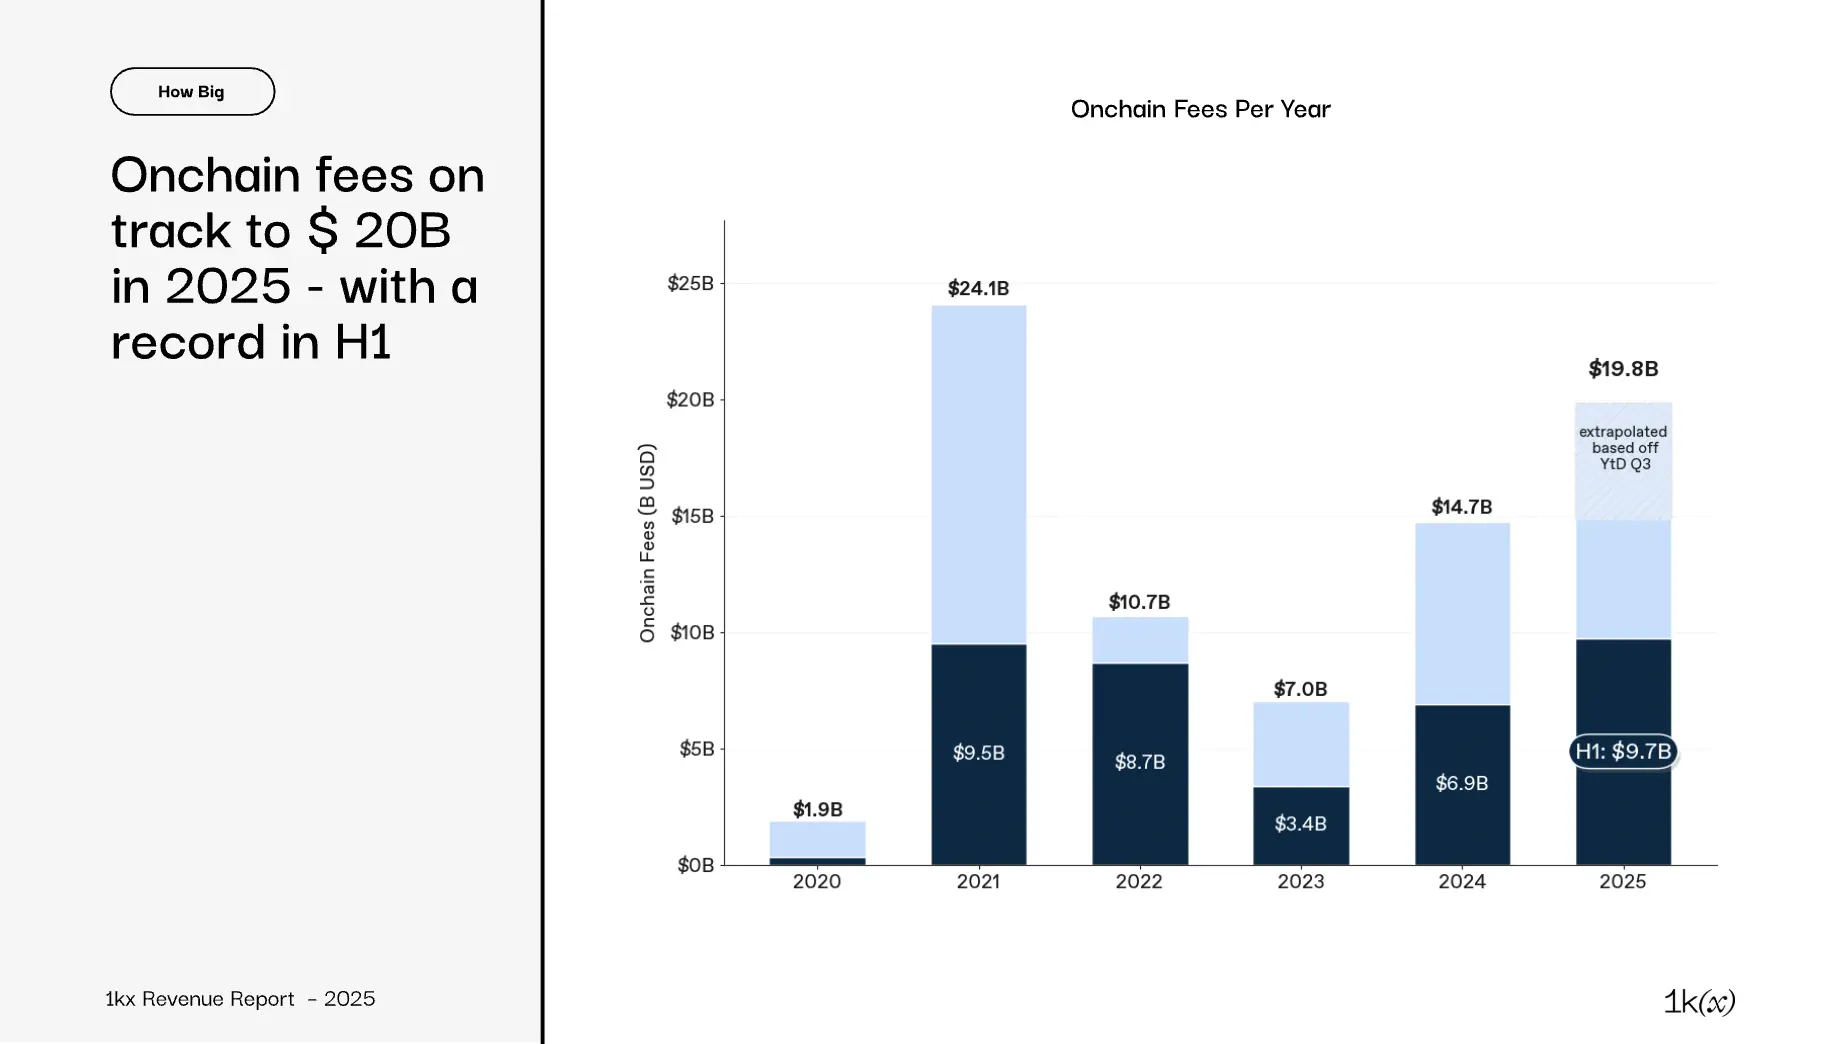
On-chain revenue becomes a $20 billion economic powerhouse
How large is the scale of on-chain fees?
According to data as of Q3 2025, annual on-chain fees are expected to be $19.8 billion, a year-on-year increase of 35%, but still 18% lower than the peak in 2021:
- On-chain fees in 2025 are expected to grow over 10 times compared to 2020, with a compound annual growth rate (CAGR) of about 60%
- In the first half of 2025, users paid $9.7 billion in on-chain fees, a year-on-year increase of 41%, setting a historical high for the first half of the year
- 2021 remains the overall peak, primarily driven by the second half—significant changes in industry dynamics have occurred, which we will review multiple times in the report
Why are the fees paid by on-chain users important?
Establishing protocol tokens as an investable asset class
Currently, digital tokens are primarily misunderstood as speculative assets for investors. This report argues that as long as the network achieves product-market fit and establishes a sustainable business model, tokens can evolve into a broader, higher-tier investable asset class.
We view user-paid fees as the best indicator, reflecting the willingness of users and businesses to pay for repeatable utility value. As protocols mature and regulations improve, the ability to continuously generate and distribute fee revenue will distinguish enduring networks from early experiments.
Currently, over 80% of on-chain fees come from tokenizable protocols, providing global, permissionless investment channels. Exposure to off-chain revenue is mainly limited to mature public companies or private equity tools.
The increasing importance of on-chain activity and efficiency
Although on-chain fees still account for a minority of industry revenue, they provide clear adoption and long-term value creation signals: since 2025, nearly 400 protocols have annualized revenues exceeding $1 million, and 20 protocols have returned over $10 million in value to token holders.
This is thanks to the global reach and efficiency improvements of blockchain, allowing applications to scale quickly and profitably (see subsequent sections for details).
This has driven market share gains from off-chain competitors, for example: decentralized exchanges (DEX) now account for 25% of total crypto trading volume, while many high-growth business models (such as DePIN) must rely on on-chain infrastructure.
Advantages of on-chain fee transparency
Transparency is a core principle of blockchain—"Don't trust, verify." Unlike the delayed disclosures of traditional finance, on-chain financial data is real-time and verifiable.
For protocols issuing tokens to attract global investors, this visibility is crucial: investors expect verifiable business metrics. An increasing number of protocols now disclose revenue or use on-chain mechanisms to reflect performance, even if some revenue remains off-chain.
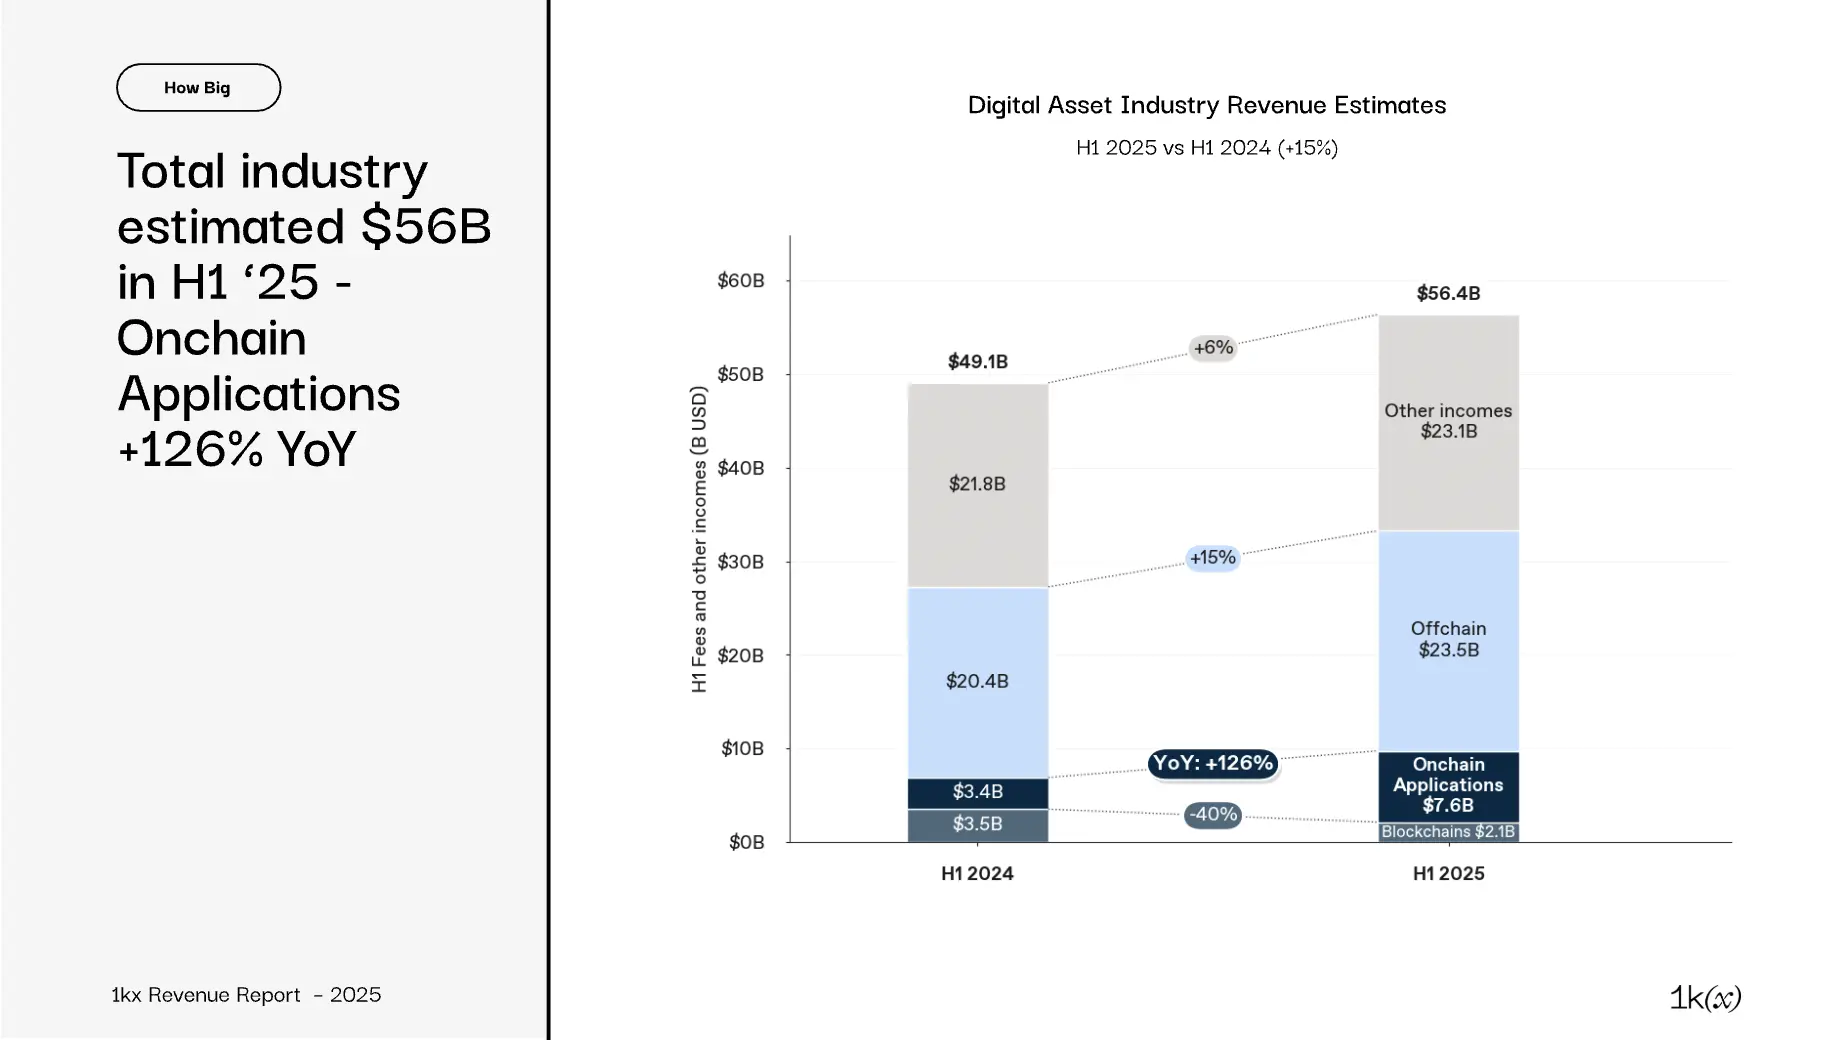
Digital asset revenue is not limited to on-chain fees, but the latter is growing the fastest, thanks to the maturity of blockchain technology:
- On-chain fees of $9.7 billion: a year-on-year increase of 41%, divided into two parts:
- Blockchains have moved away from the high-cost, low-volume phase, gradually commoditizing, with fees continuously decreasing due to efficiency improvements²⁾
- The application layer benefits from this shift, rapidly scaling on cheaper, more efficient tracks, with a year-on-year growth of 126%
- Off-chain fees of $23.5 billion:
- Centralized exchanges (CEX) account for the largest share of revenue, estimated at $19 billion
- The remainder mainly comes from other financial infrastructure (market makers, fund management fees) and crypto casinos³⁾
- Other revenue of $23.1 billion is mainly divided into two parts:
- Block rewards: income for miners and stakers, with Bitcoin ($8 billion), Solana ($2 billion), and Ethereum ($1 billion)
- Stablecoin issuance: Circle and Tether generate $4.5 billion through the yields of supported assets (such as U.S. Treasury bonds)**
DeFi dominates on-chain revenue by 2025
Where do on-chain fees come from? 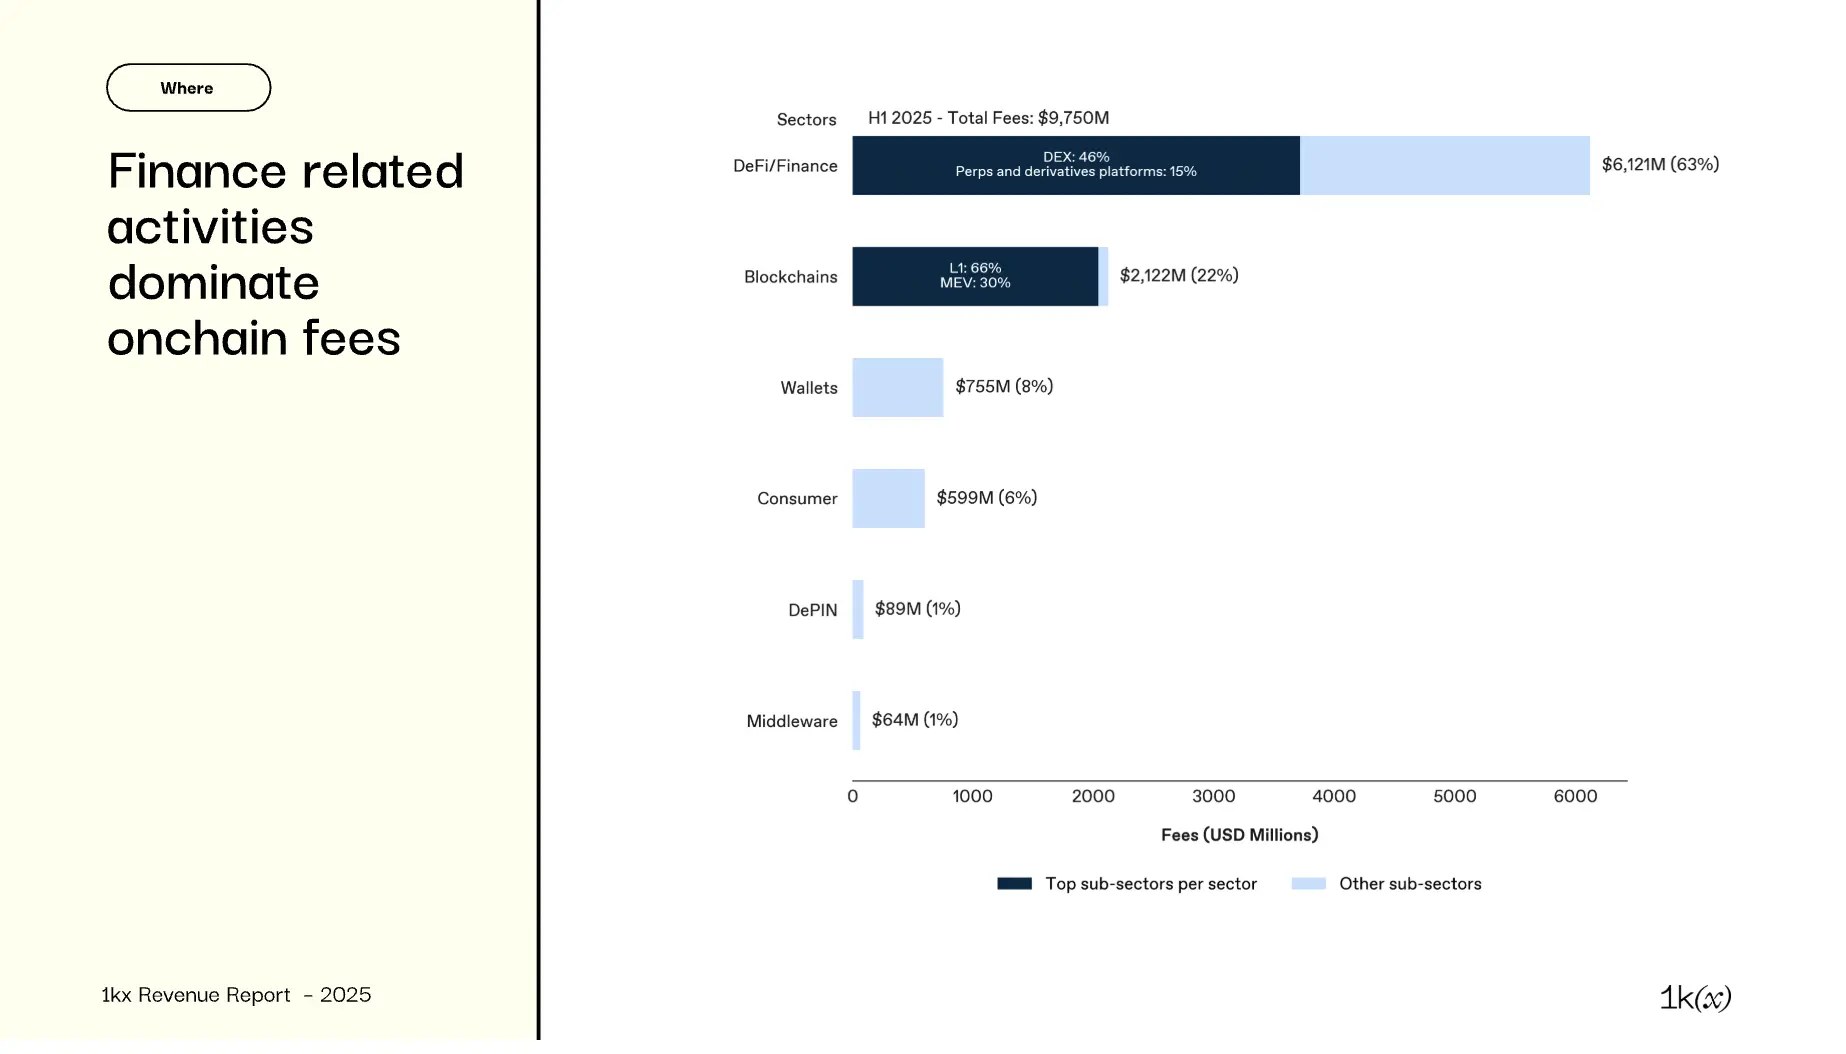
In the first half of 2025, of the $9.7 billion paid to protocols, DeFi takes the lead:
- 63% DeFi/Finance: primarily from trading fees on DEX, perpetual contracts (Perps), and derivatives platforms
- 22% Blockchain: mainly L1 transaction fees and MEV capture; L2/L3 fees remain negligible
- 8% Wallets: significant fees generated from swap activities since Q4 2024, with Phantom accounting for 30% of wallet fees
- 6% Consumer: >80% from launchpads (Pump.fun accounts for ~60% in this area), 8% from casinos, and 4% from creator economy and social
- 1% DePIN: small scale but fastest growth (>400% year-on-year growth)
- 1% Middleware: 55% from bridging (Li.fi leads), 15% from identity and reputation, 15% from developer tools
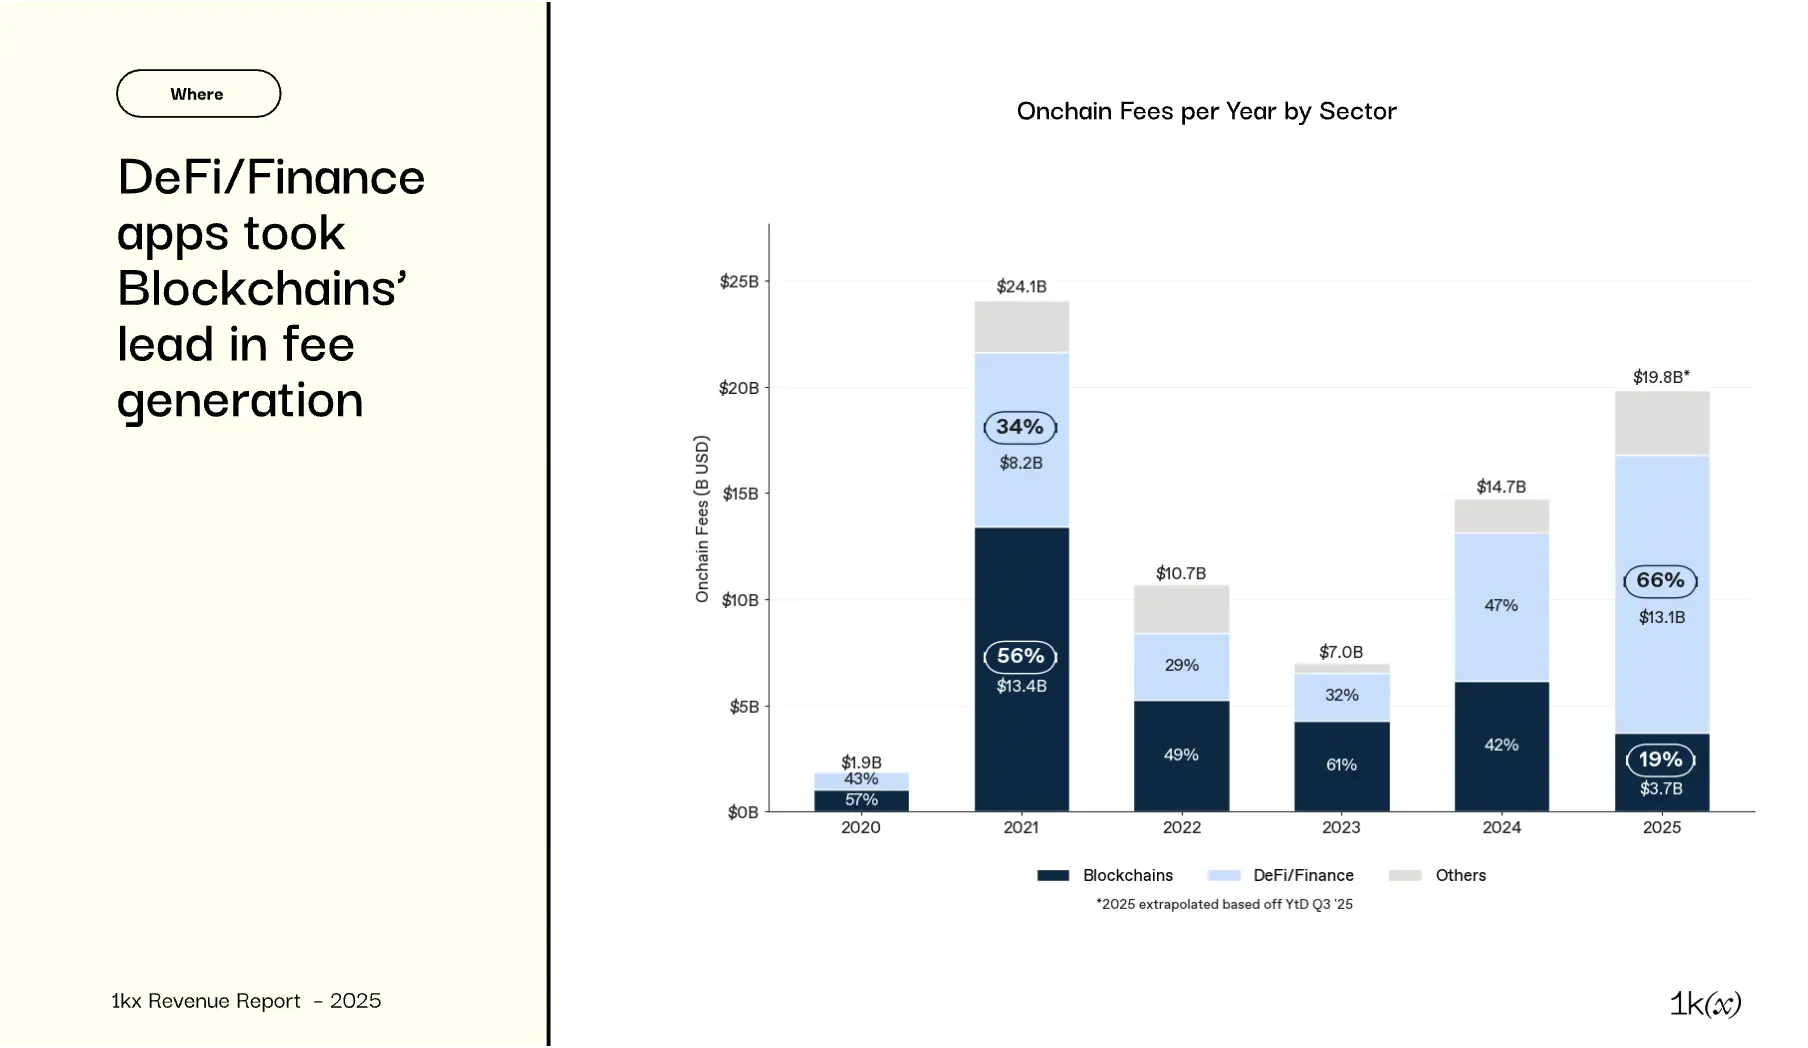
Blockchain is expected to account for 20% of fees by 2025:
- In 2021, users paid $13.4 billion for blockchain transactions, accounting for 56% of total fees
- By 2024, as on-chain fees rebound, blockchain will have lost its leading position, with DeFi/finance applications expected to reach $13.1 billion / 66% by 2025
- DeFi/finance continues to grow strongly, with a year-on-year increase of 113% in the first half of 2025, setting a historical high for on-chain fees—see below for driving factors
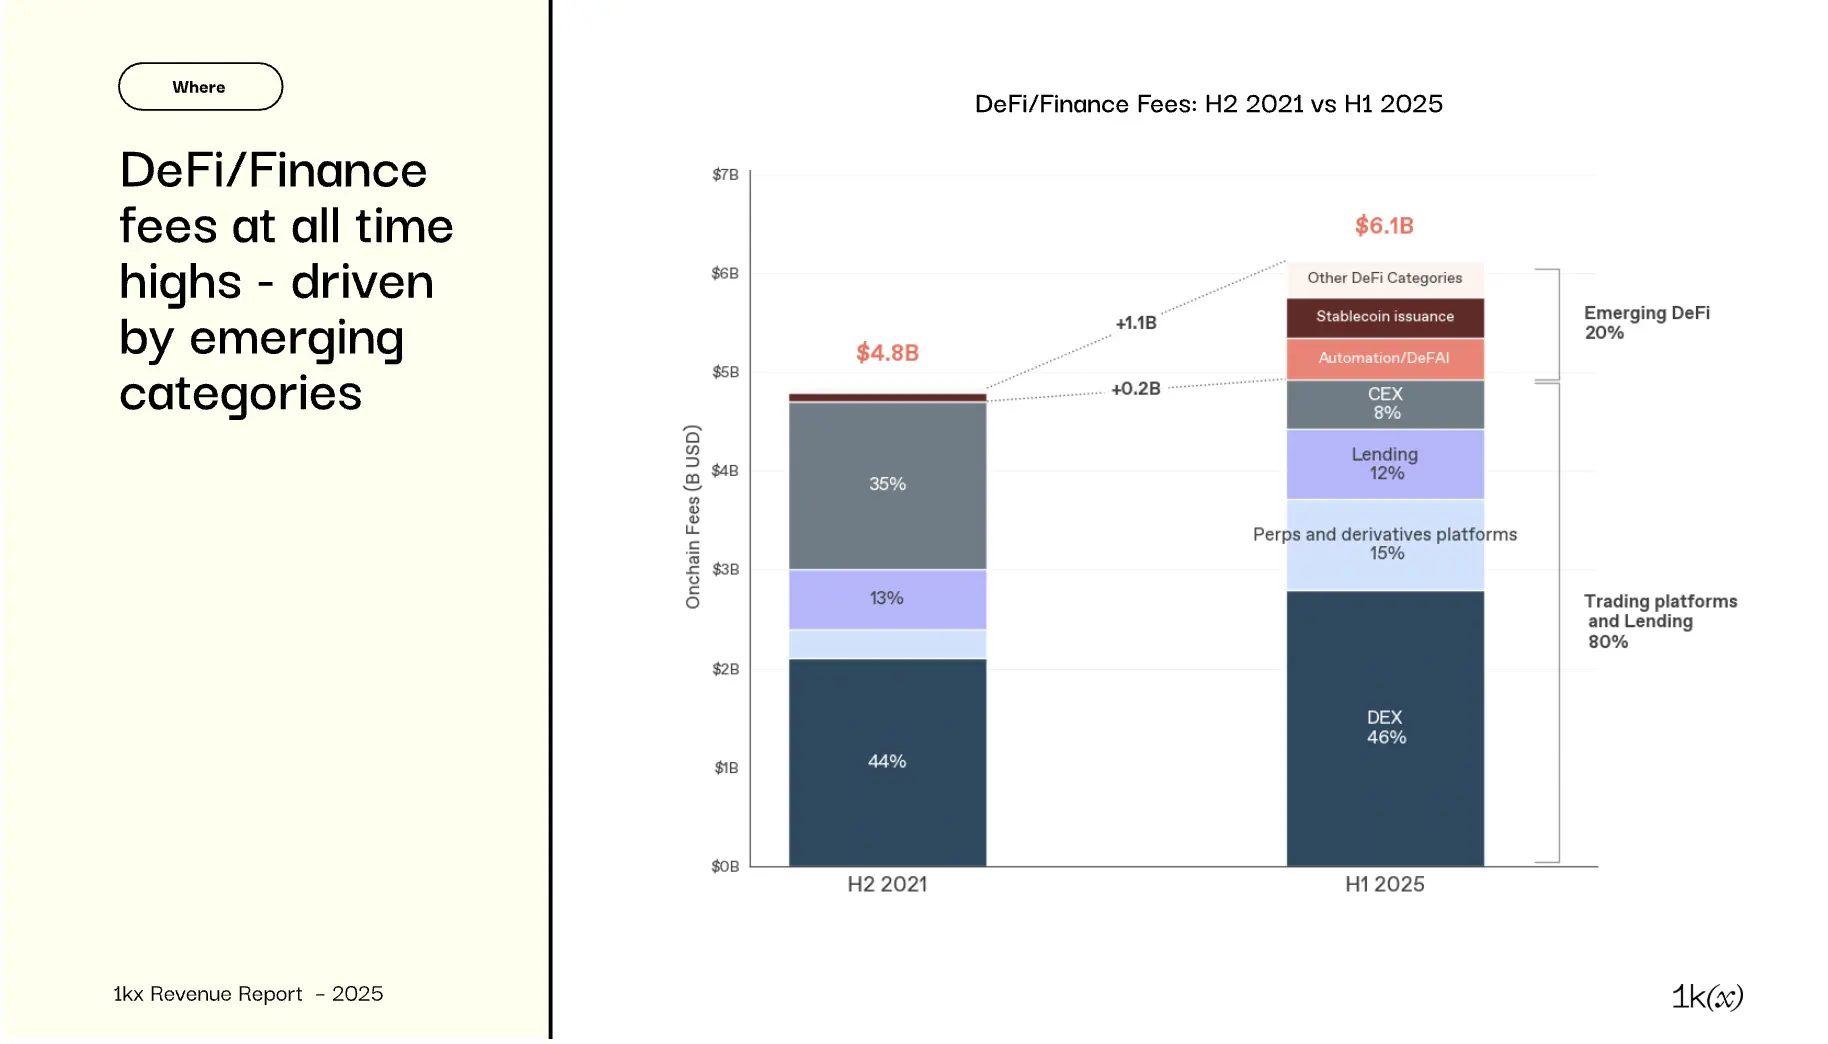
Setting a historical high: Fees in the first half of 2025 exceeded the peak in the second half of 2021, driven by new use cases and stablecoin growth.
- Mature categories grow ~4%
- DeFi DEX, perpetual contracts, and derivatives are capturing market share from CEX
- Perpetual contract fees tripled, with trading volume increasing sixfold year-on-year, led by Hyperliquid
- Lending stabilized at ~700 million, with new entrants like Morpho enhancing efficiency
- Stablecoins: Although not a new category, on-chain fees reached record levels due to new all-time highs in market capitalization and improved monetization of off-chain collateral yields
- Other emerging use cases added $1.1 billion in fees:
- Automation/DeFAI (bots and AI agents), risk curation and treasury, RWA, liquid staking (re-staking)—all generating fees through user deposit revenue sharing
CEX revenue is opaque through token buybacks: buyback commitments reflect revenue/profit, but verification is limited. Binance and Bitget no longer link buybacks to revenue, and OKX may not have executed market buybacks as stated; therefore, this is excluded here, with the total market capitalization of stablecoins approaching $300 billion as of Q3 2025.
DeFi/Finance fees rise to $6.1 billion (year-on-year growth of 113%), with core categories (DEX, perpetual contracts/derivatives, lending) totaling $4.4 billion. Most of the growth comes from new entrants that previously generated negligible revenue.
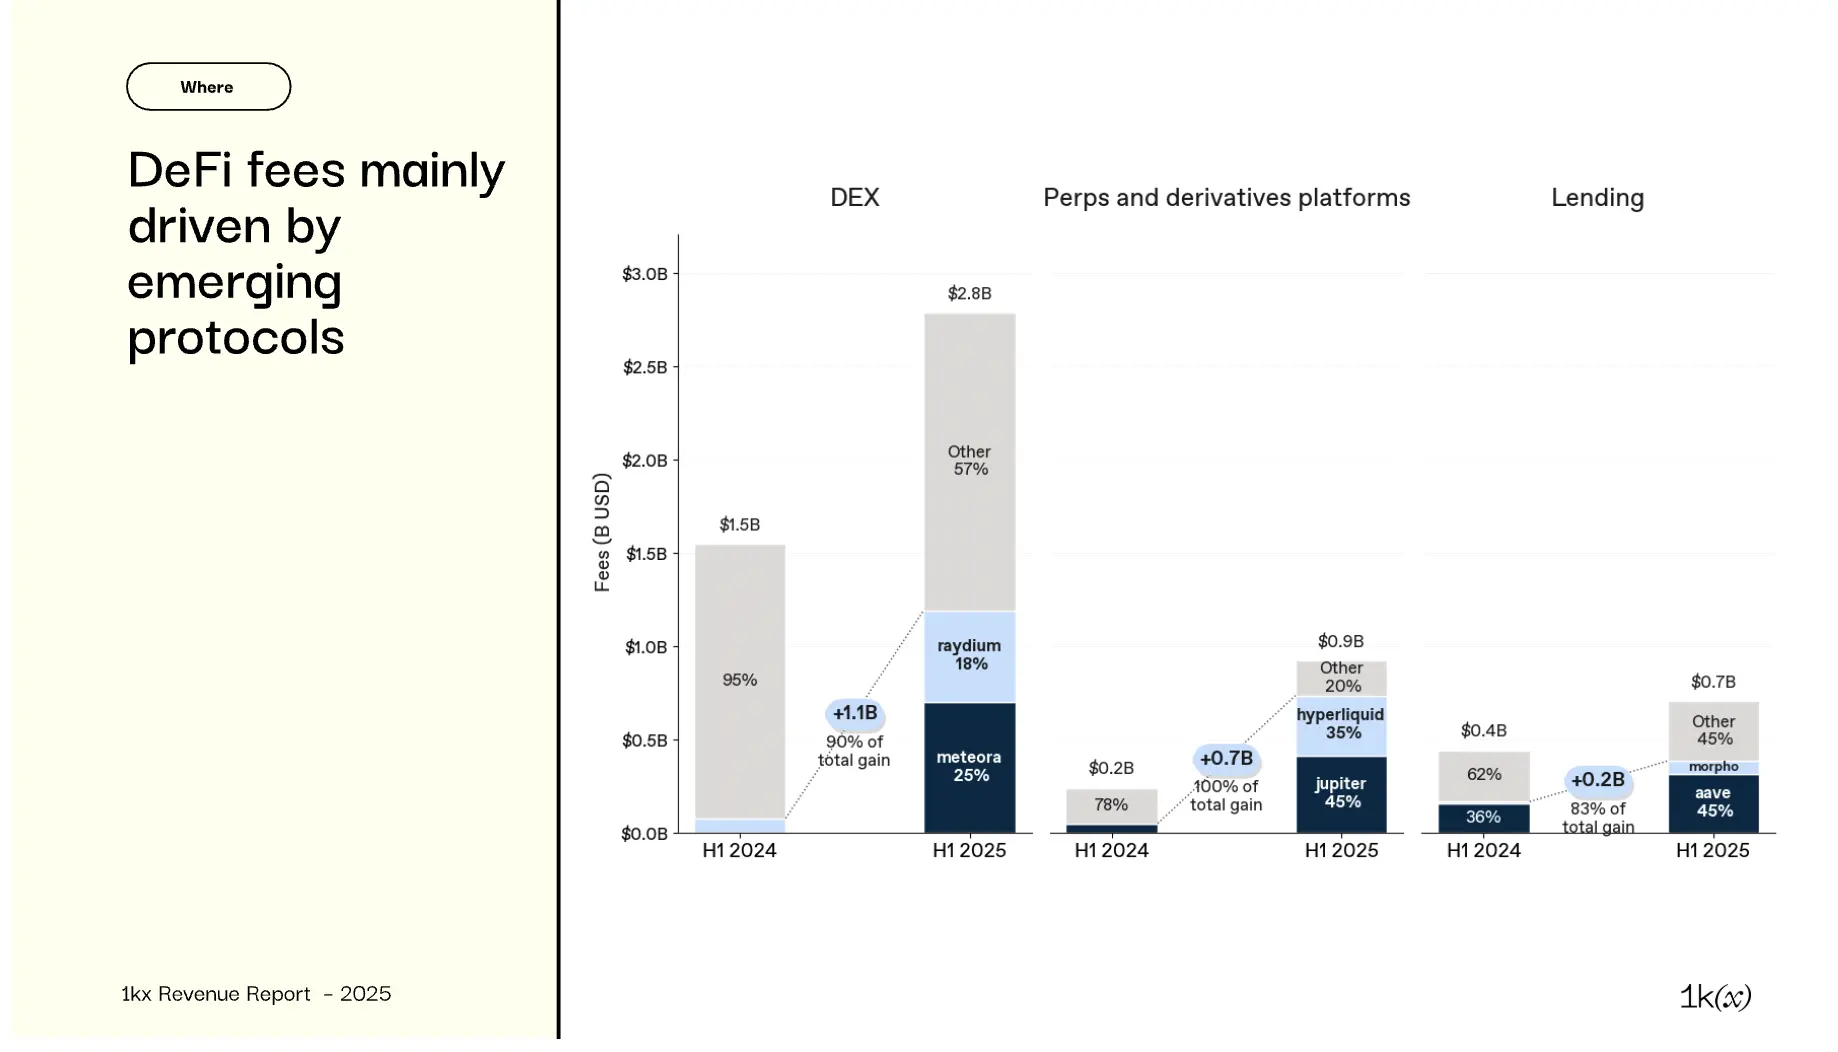
- DEX: Growth led by Raydium and Meteora, benefiting from the surge in Solana; Uniswap (ranked 3rd) lagged, with its share dropping from 44% to 16%
- Perpetual contracts/derivatives: Jupiter's fee share rose from 5% to 45%; Hyperliquid (launched less than a year ago) contributed 35% of fees in this subfield
- Lending: Aave remains dominant, but Morpho (a lending aggregator based on Aave) saw its fee share rise from nearly 0% in the first half of 2024 to 10%
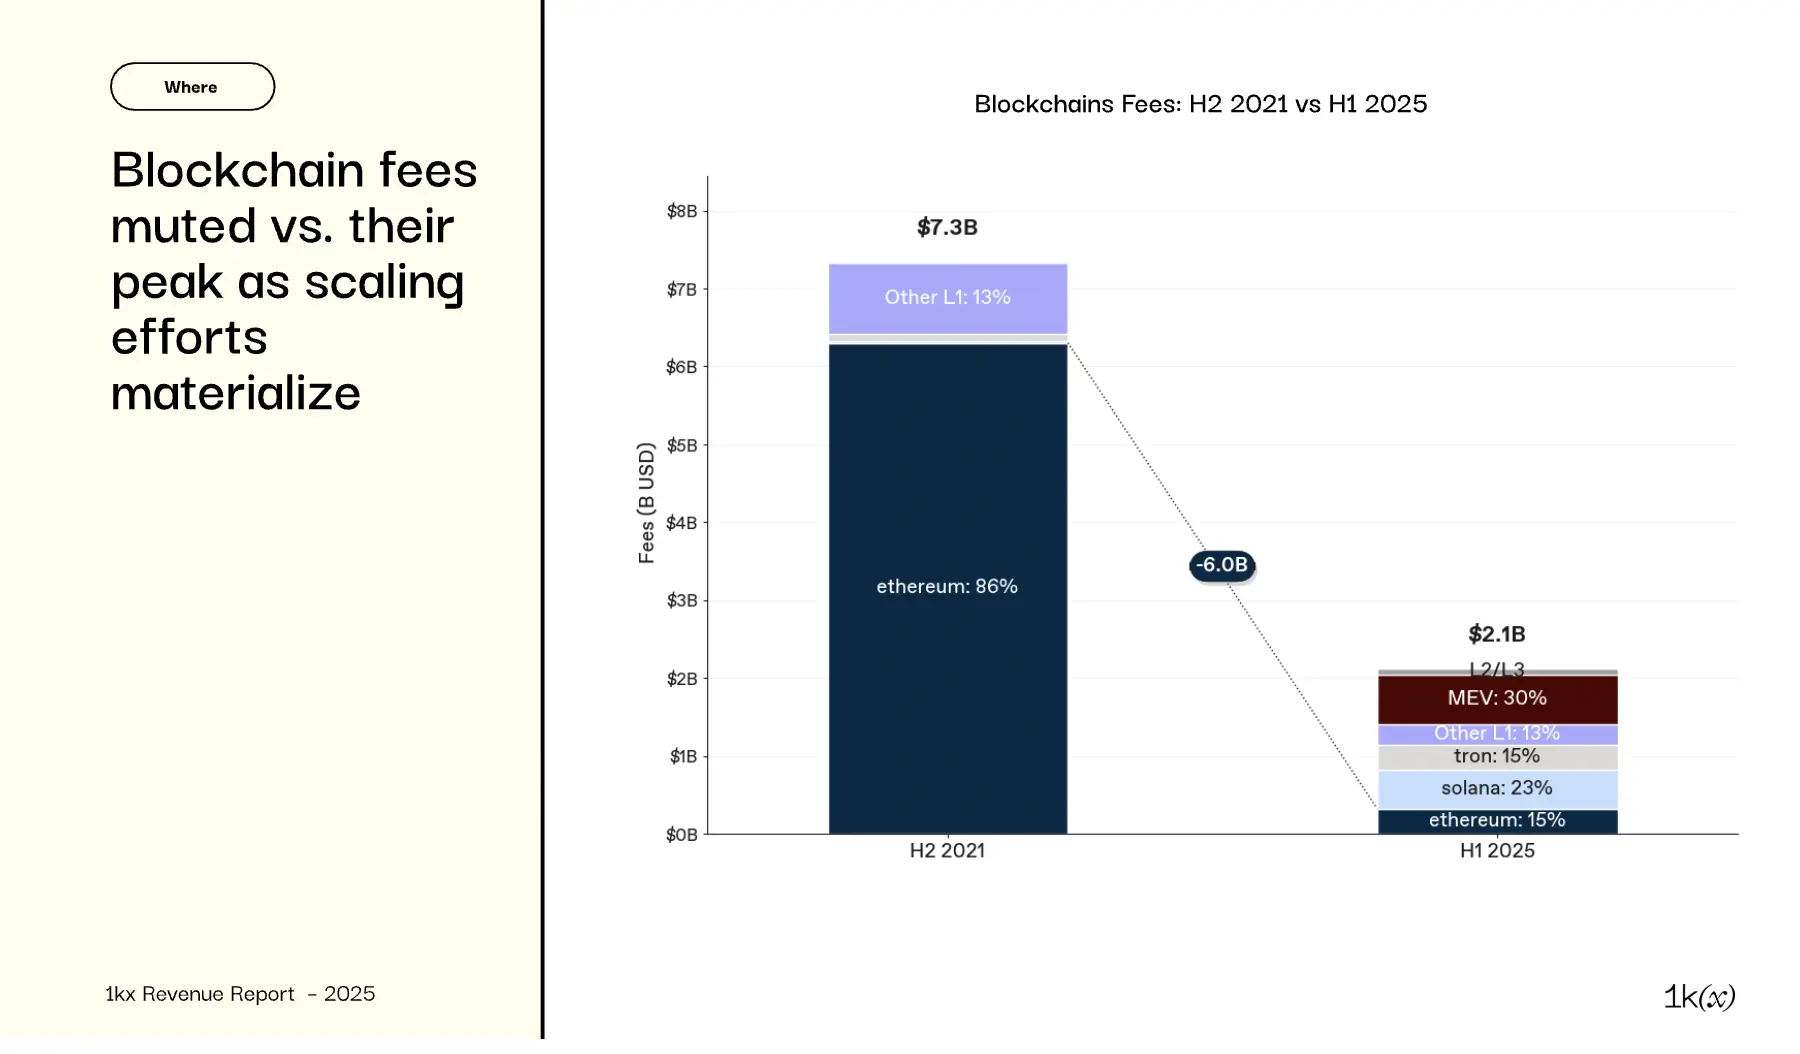
Four notable trends in blockchain fees:
- Efficiency improvements: Particularly significant for Ethereum, where transaction costs have decreased, leading to a reduction in overall fee revenue (see section (04) for breakdown)
- MEV: The Flashbots protocol coordinates MEV transactions on Ethereum, while Jito performs similar functions on Solana. These fees are related to arbitrage opportunities, surging during speculative periods (such as the meme coin craze in the second half of 2024/Q1 2025)
- Concentration: The top 5 protocols (Tron, Ethereum, Solana, Jito, Flashbots) captured ~80% of blockchain fees in the first half of 2025. While still high, this is an improvement from Ethereum's 86% dominance in 2021
- Rollup (L2/L3): Emerged in 2022, charging significantly less than L1, but transaction volumes are insufficient to generate a significant share of fees
Maturity of technology leads to a decrease in transaction fees, paving the way for explosive growth in the application layer
Fees vs. Value — Have we created real economic value?
In the first half of 2025, user-paid fees decreased 34% from the historical high in the second half of 2021, but:
- Blockchain efficiency improvements stimulate activity:
- Ethereum accounted for over 40% of on-chain fees in 2021, but only 3% so far in 2025 — its scaling efforts are the main driver behind the average blockchain transaction fee decreasing by 86%
- Daily transaction volume for L1 and L2 has grown approximately 2.7 times, reaching 169 million transactions
- More protocols are monetizing: Only 125 protocols generated fees in 2021, almost entirely contributed by 20 protocols. In contrast, 969 protocols generated fees in the first half of 2025: an 8-fold increase over four years
- Value distributed to token holders has increased:
- Although fees are lower than in 2021, the value returned to holders by protocols has increased by 50% — reaching an all-time high
- This development is accompanied by a more favorable regulatory environment for digital assets and value distribution, starting from the end of 2024
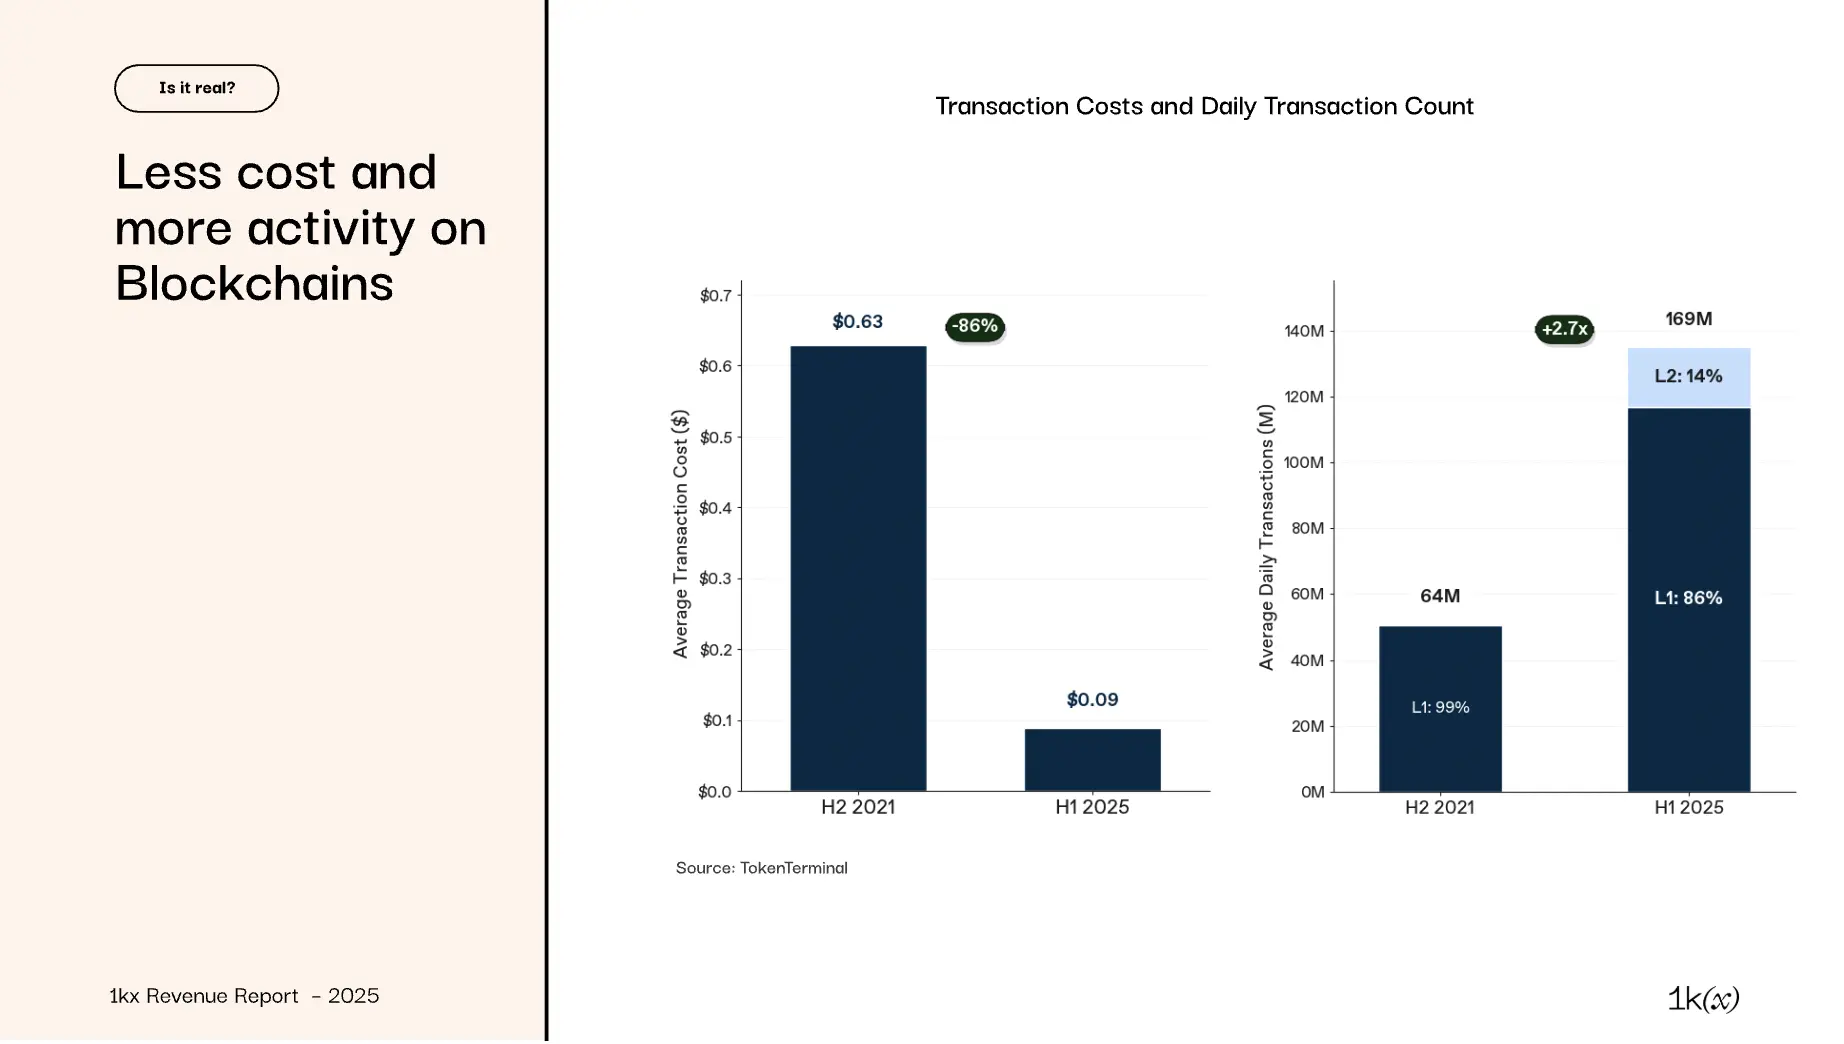
Blockchain efficiency surges, supporting higher throughput and lower costs:
- Average transaction fees have decreased 86%, primarily driven by Ethereum (accounting for over 90% of the decrease), due to Ethereum's new fee mechanism (EIP-1550) and increased L2 adoption
- Lower costs expand participation:
- Average daily transaction volume has grown 2.7 times compared to the second half of 2021, with an increased share from L2
- The number of monthly active wallets has grown 5.3 times, reaching 273 million (in the first half of 2025)
In our dataset, 1,124 protocols generated fees in 2025.
- Among them, 389 generated fees for the first time in 2025²⁾, accounting for 13% of total fees so far in 2025, with Q3 accounting for 17%
- Notable examples include:
- Meteora (ranked 1st in total fees in the first half of 2025)
- Axiom
- Bullx
- Trojan
- 2025 is the first year with a significant number of new protocols monetizing outside of DeFi/finance: among the 150 "other" protocols in 2025, DePIN and consumer protocols dominate
- Since 2020, a total of 1,205 protocols have generated fee revenue
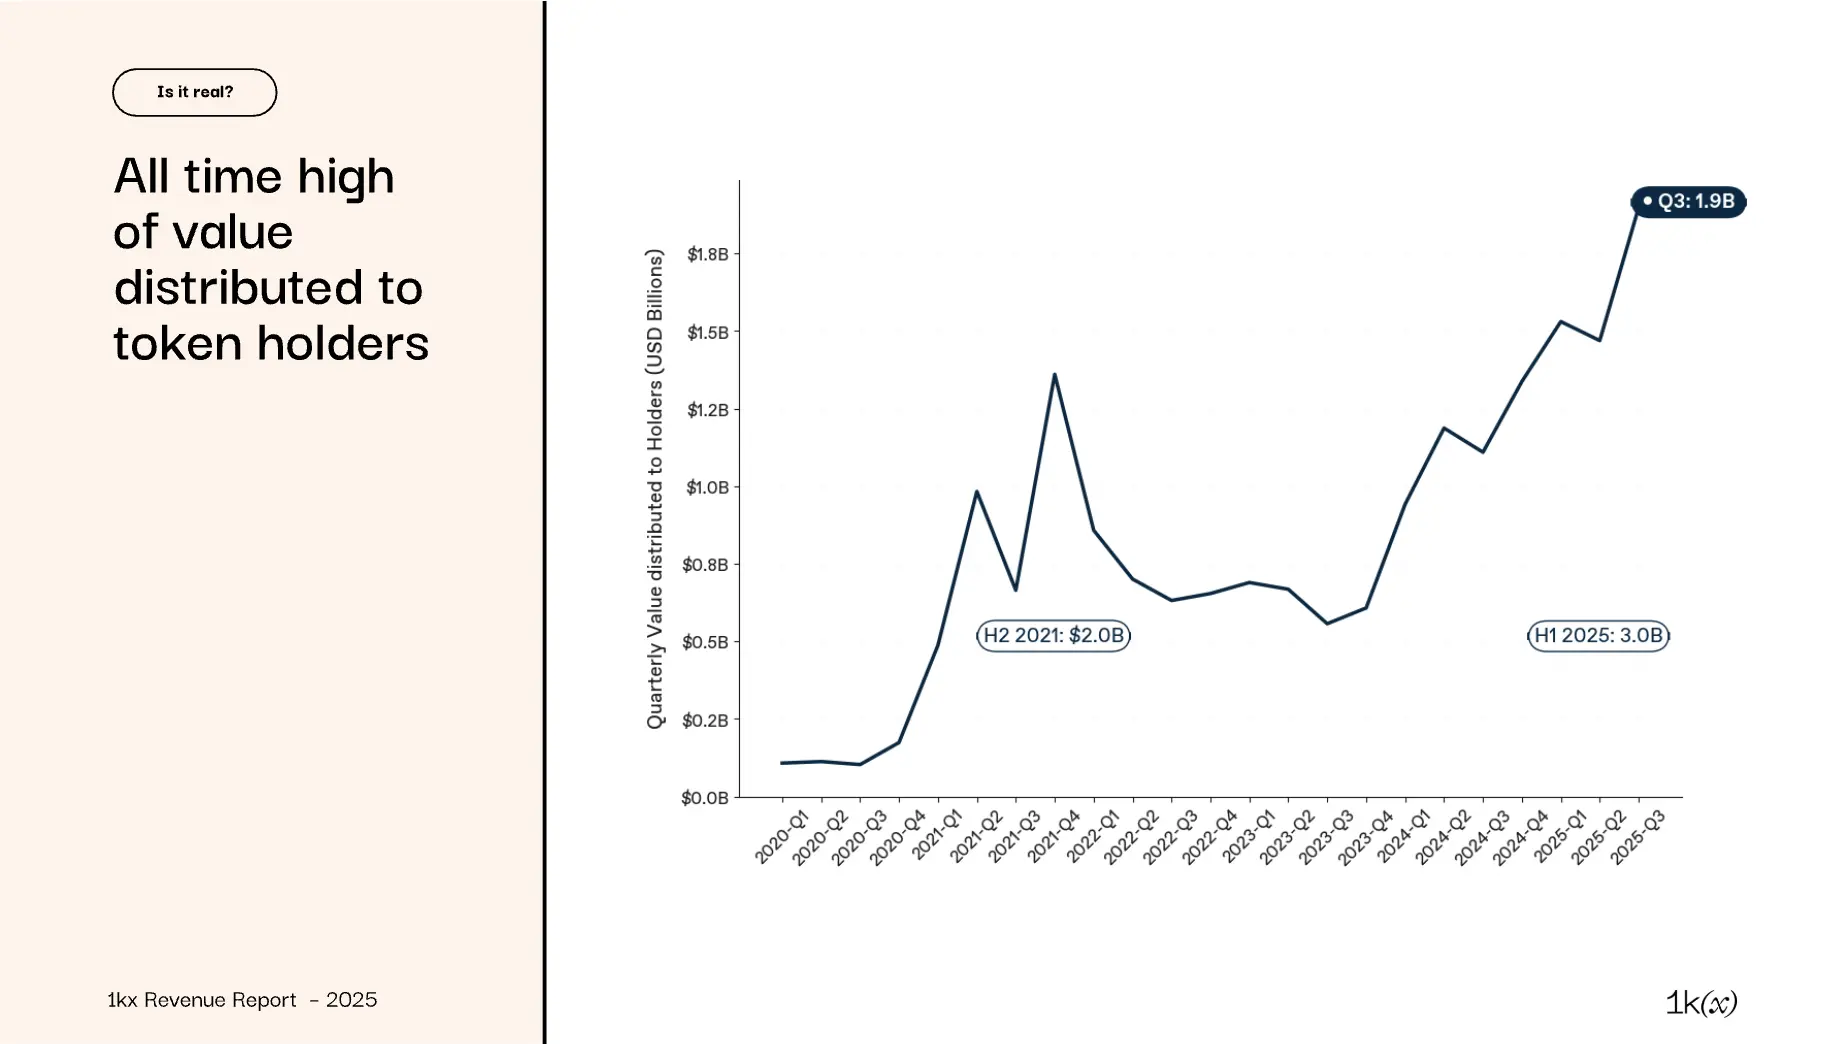
Value distributed to token holders — buybacks, burns, and other net values minus emissions — reached an all-time high in the past three quarters:
- In Q3 2025, $1.9 billion was distributed, nearly equal to the total during the peak of fees in the second half of 2021
- However, many protocols (especially newer networks) still have zero distributions, as they continue to emit more incentives — a common pattern for blockchain L1
- The application layer drives most of the distribution value, as incentives decrease: applications among the top 20 fee-generating protocols¹⁾ reduced token incentives from $2.8 billion (90% of their fees) in the second half of 2021 to $100 million in the first half of 2025, significantly enhancing net returns for holders
- Profit-based metrics (such as value distribution) have limitations, especially regarding which holders benefit (active vs. passive). See downloadable report slide 51 and subsequent details on methodology and industry metrics
More efficient infrastructure is becoming a new driving force
What drives fees?
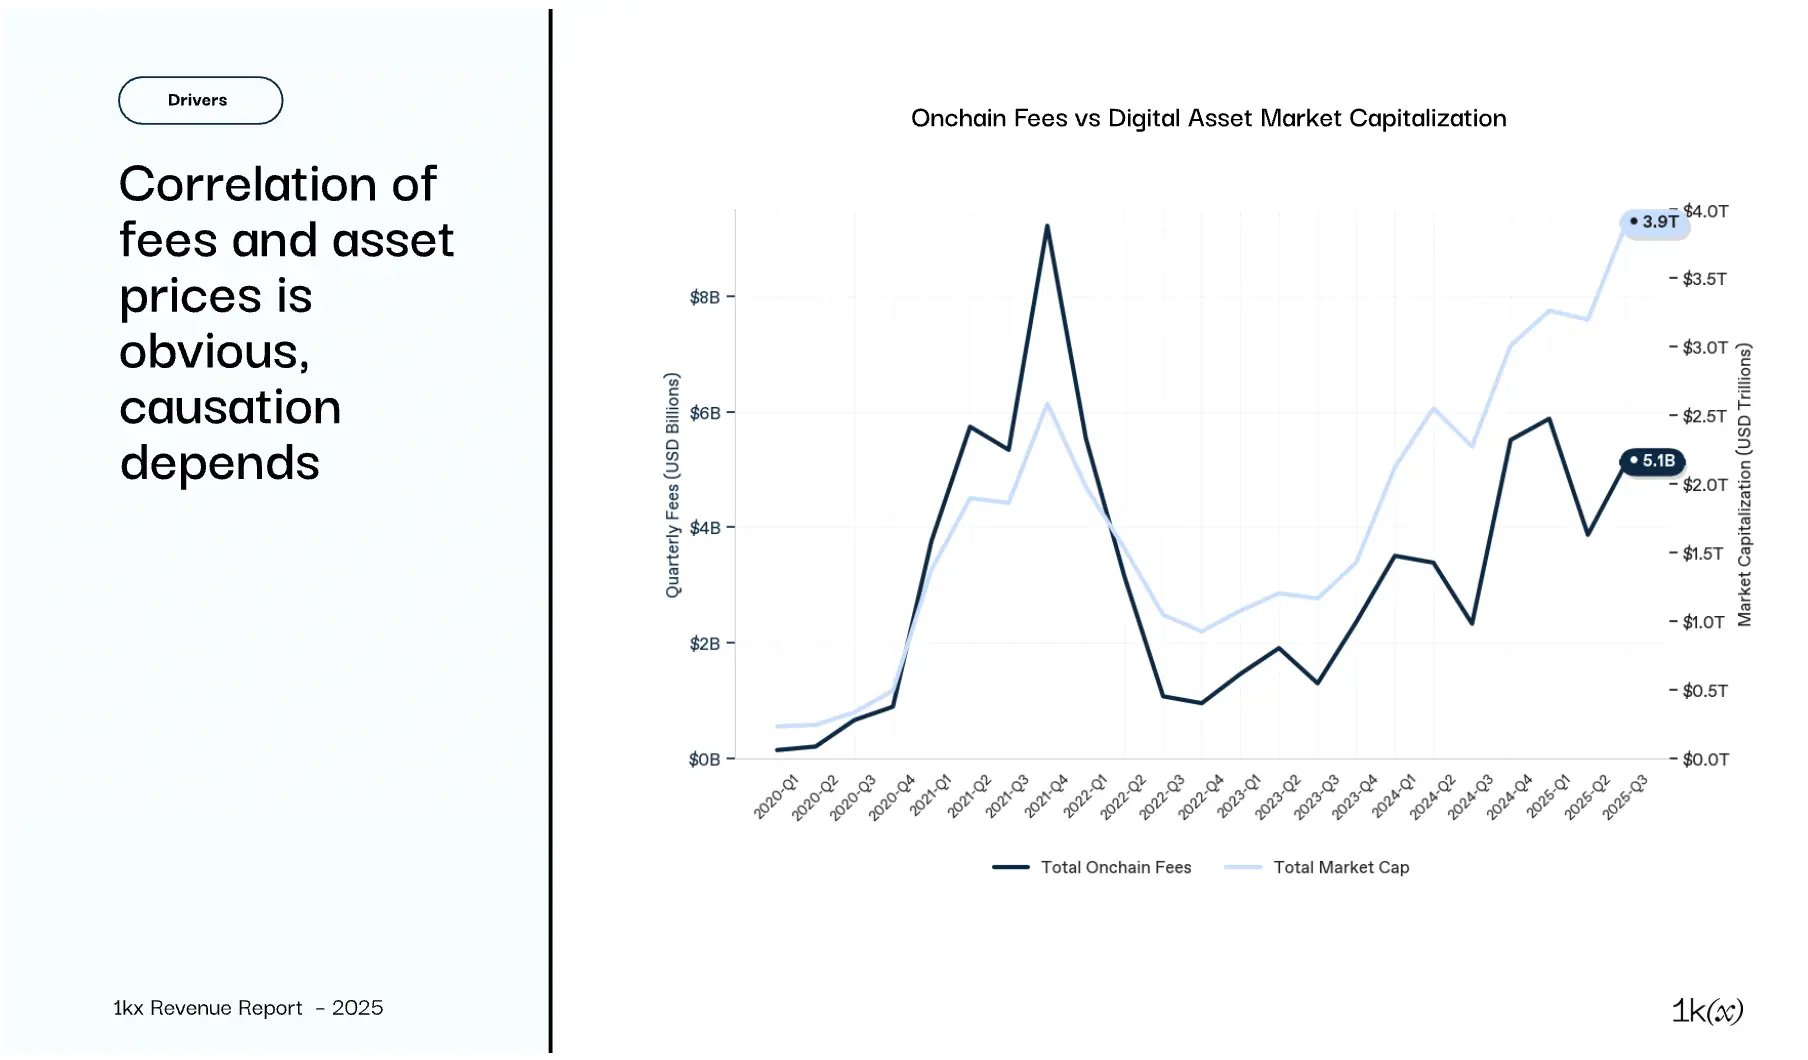
Asset prices are the input for dollar-denominated fees in most areas, generating expected correlations, but not limited to that:
- Seasonality: Changes in market risk appetite drive cyclical fluctuations in token prices and fee levels
- Causality: The causal relationship between fees and valuation varies by time and domain. In DeFi/finance (stronger since 2022) and blockchain (only a one-month lag after 2021), changes in fees lead valuation
- Domain dynamics:
- Blockchain L1: Previously driven by price (in 2021), now more influenced by transaction costs due to efficiency improvements
- Trading platforms (DEX, perpetual contracts, etc.): Still driven by asset prices, but increased competition has led to lower rates (on both supply and demand sides)
- Lending: Fees are driven by utilization, positively correlated with price, but constrained by rate mechanisms
- DePIN: Fees track the dollar value of delivered services, with limited sensitivity to asset price fluctuations
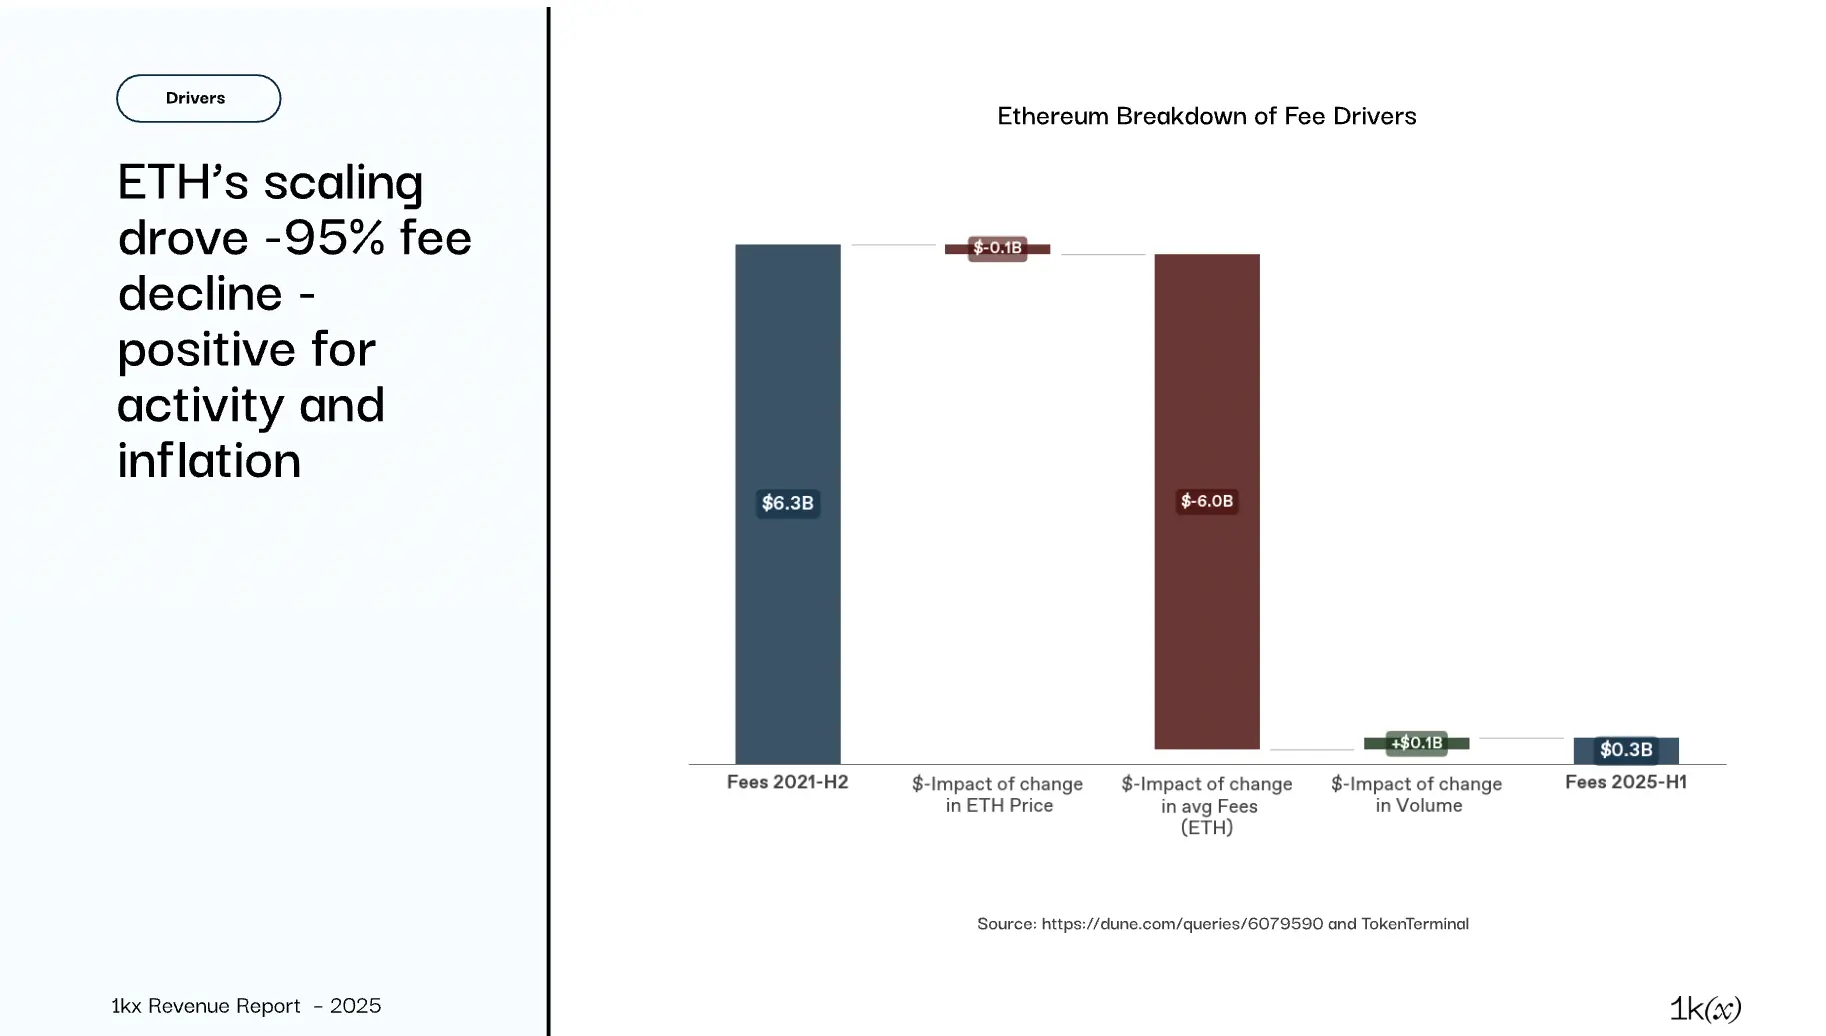
Ethereum fee dynamics have changed dramatically since 2021:
- The record $6.3 billion in the second half of 2021 was driven by high ETH prices and speculative demand, with users bearing extreme fees
- In the first half of 2025, ETH prices and transaction volumes were similar, but scaling efforts reduced average fees by ~95%, leading to a significant decline in dollar fee revenue
Positive impacts on activity and inflation:
- This allows for a simultaneous reduction in validator incentives — from $9.4 billion in the second half of 2021 to $1.2 billion (down 90%) in the first half of 2025, with ETH token supply remaining stable since the end of 2022
- Ethereum's own transaction volume has only grown moderately, but L2 now processes 18 times its transaction volume, totaling ~22.9 million daily transactions in the first half of 2025
As we shift towards proof of stake, Rollup, dynamic fees, capacity enhancements, and transaction bundling
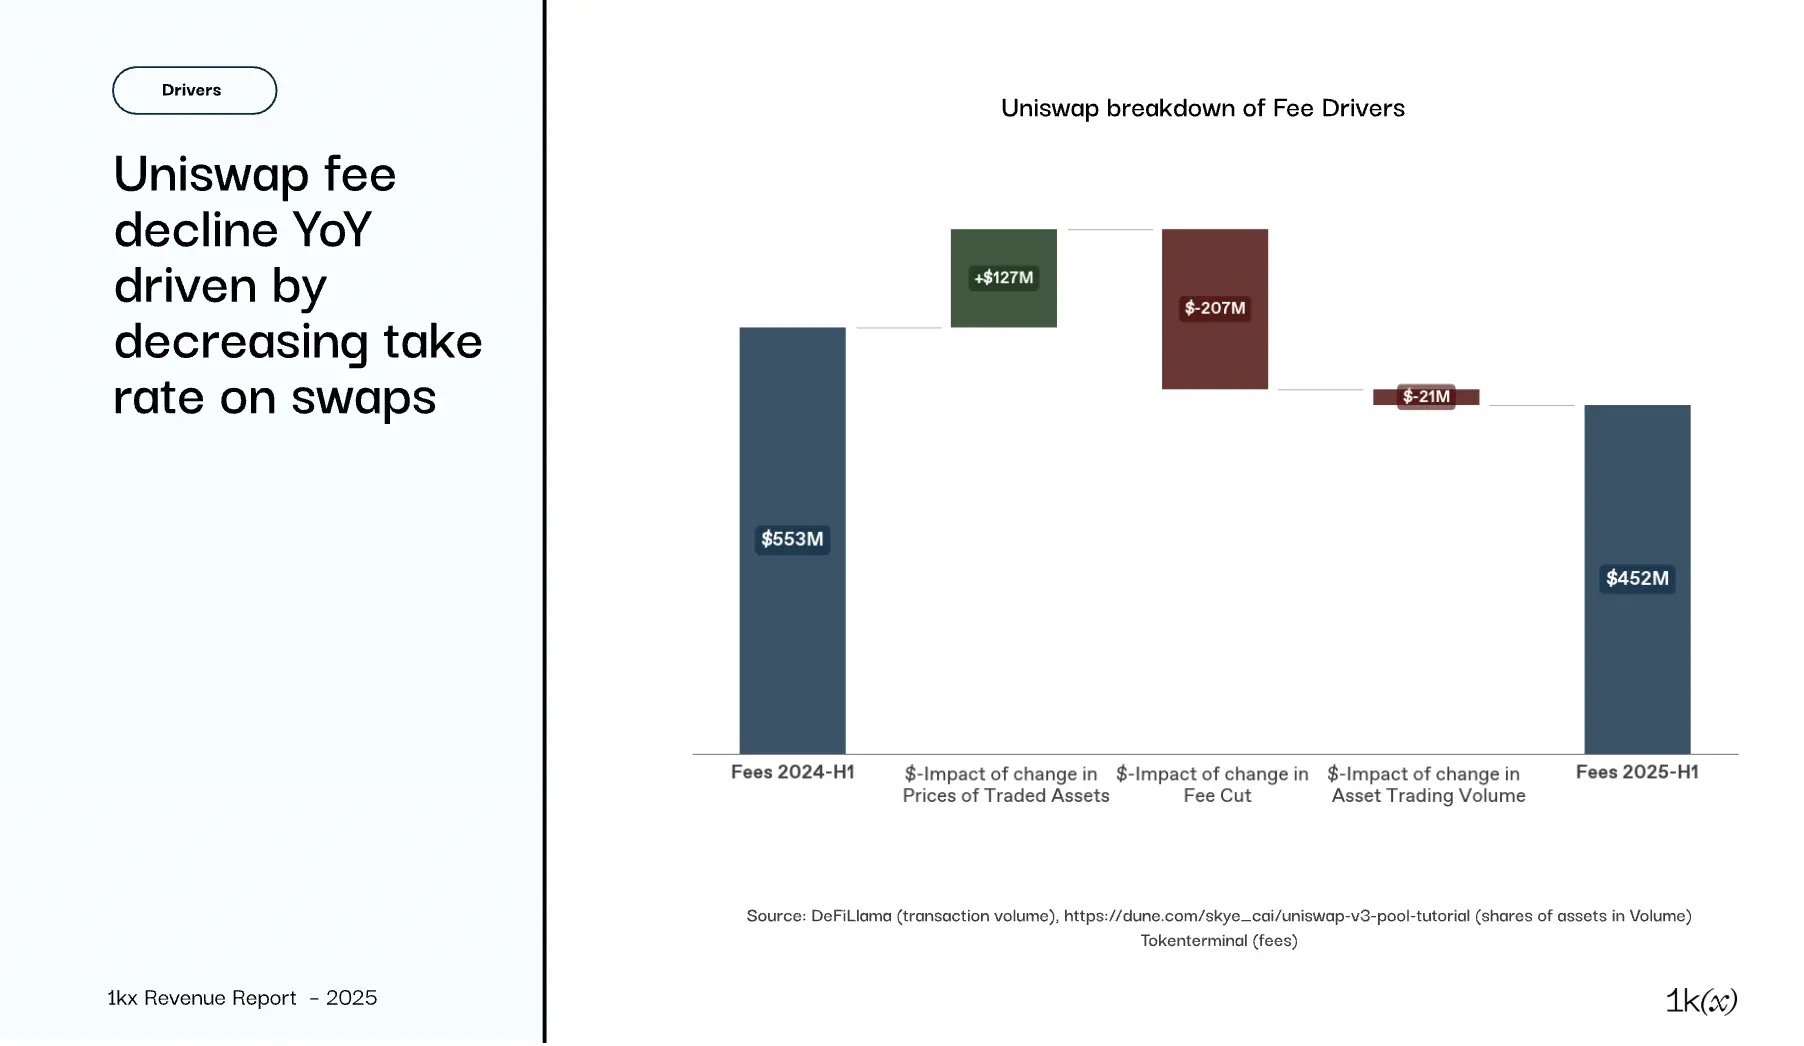
Uniswap (the leading DEX, long dominant in trading volume and fee capture) saw dollar fees decrease by 18% year-on-year in the first half of 2025 due to lower average rates:
- The average price of traded assets increased, positively impacting fees
- Swap fees ranged from 5 to 100 basis points, but trading volume shifted to low-fee pools, with average rates dropping by over 30%
- Q2 2025 trading volume grew 20% year-on-year to ~$230 billion, but was primarily driven by rising crypto asset prices, with standardized asset trading volume actually declining slightly
- Other DEXs are also facing similar rate compression. PancakeSwap offset this with higher trading volumes, with fees increasing by ~150% year-on-year
The top 20 protocols contribute 70% of revenue, but leadership is constantly shifting
Who is winning? The protocols with the highest fees
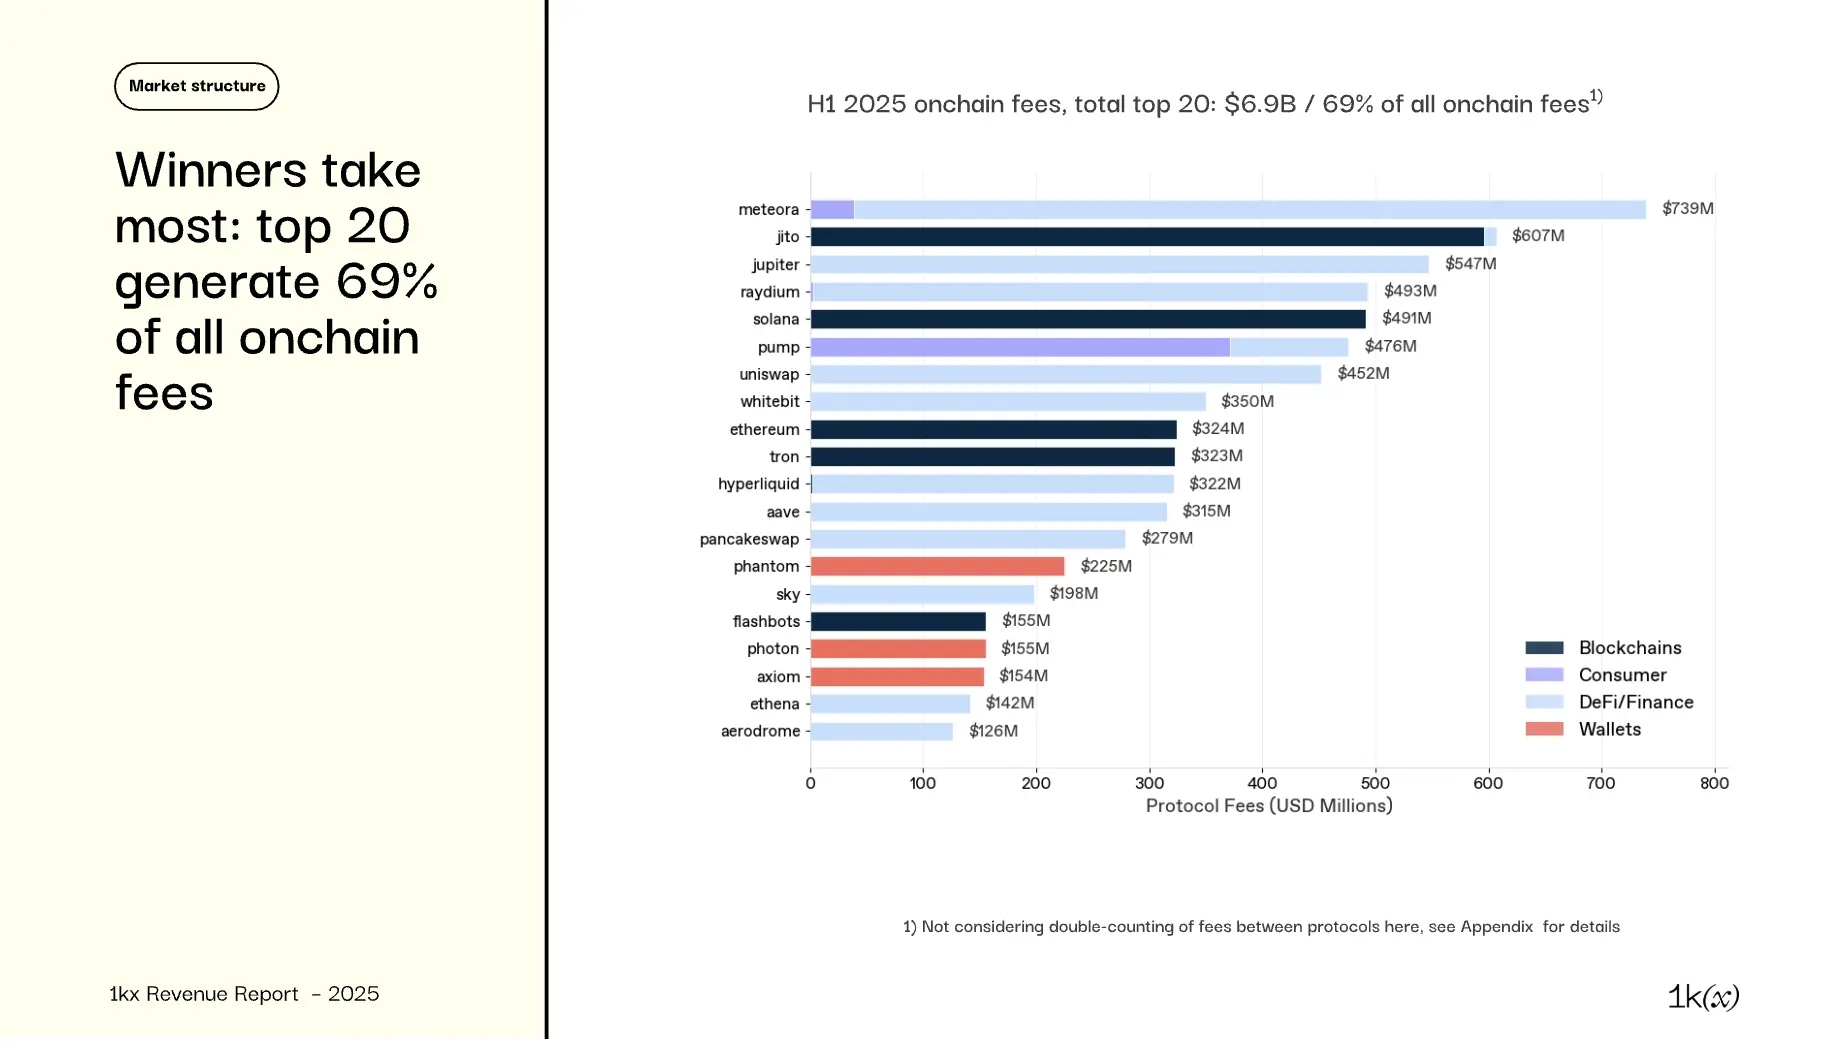
Consistent with domain shares, the top protocols are primarily DeFi/Finance and Blockchain.
- Exceptions are Pump (consumer) and Phantom (wallet), although some protocols charge fees across domains (e.g., Meteora also has a token launchpad (consumer))
- The top 20 protocols (accounting for only 2% of the total) contribute 69% of fees, reflecting the typical concentration in the digital asset market
- Some protocols like Uniswap, Aave, and all blockchain protocols have been operating for years, but Pump, Photon, and Axiom are all under 2 years old
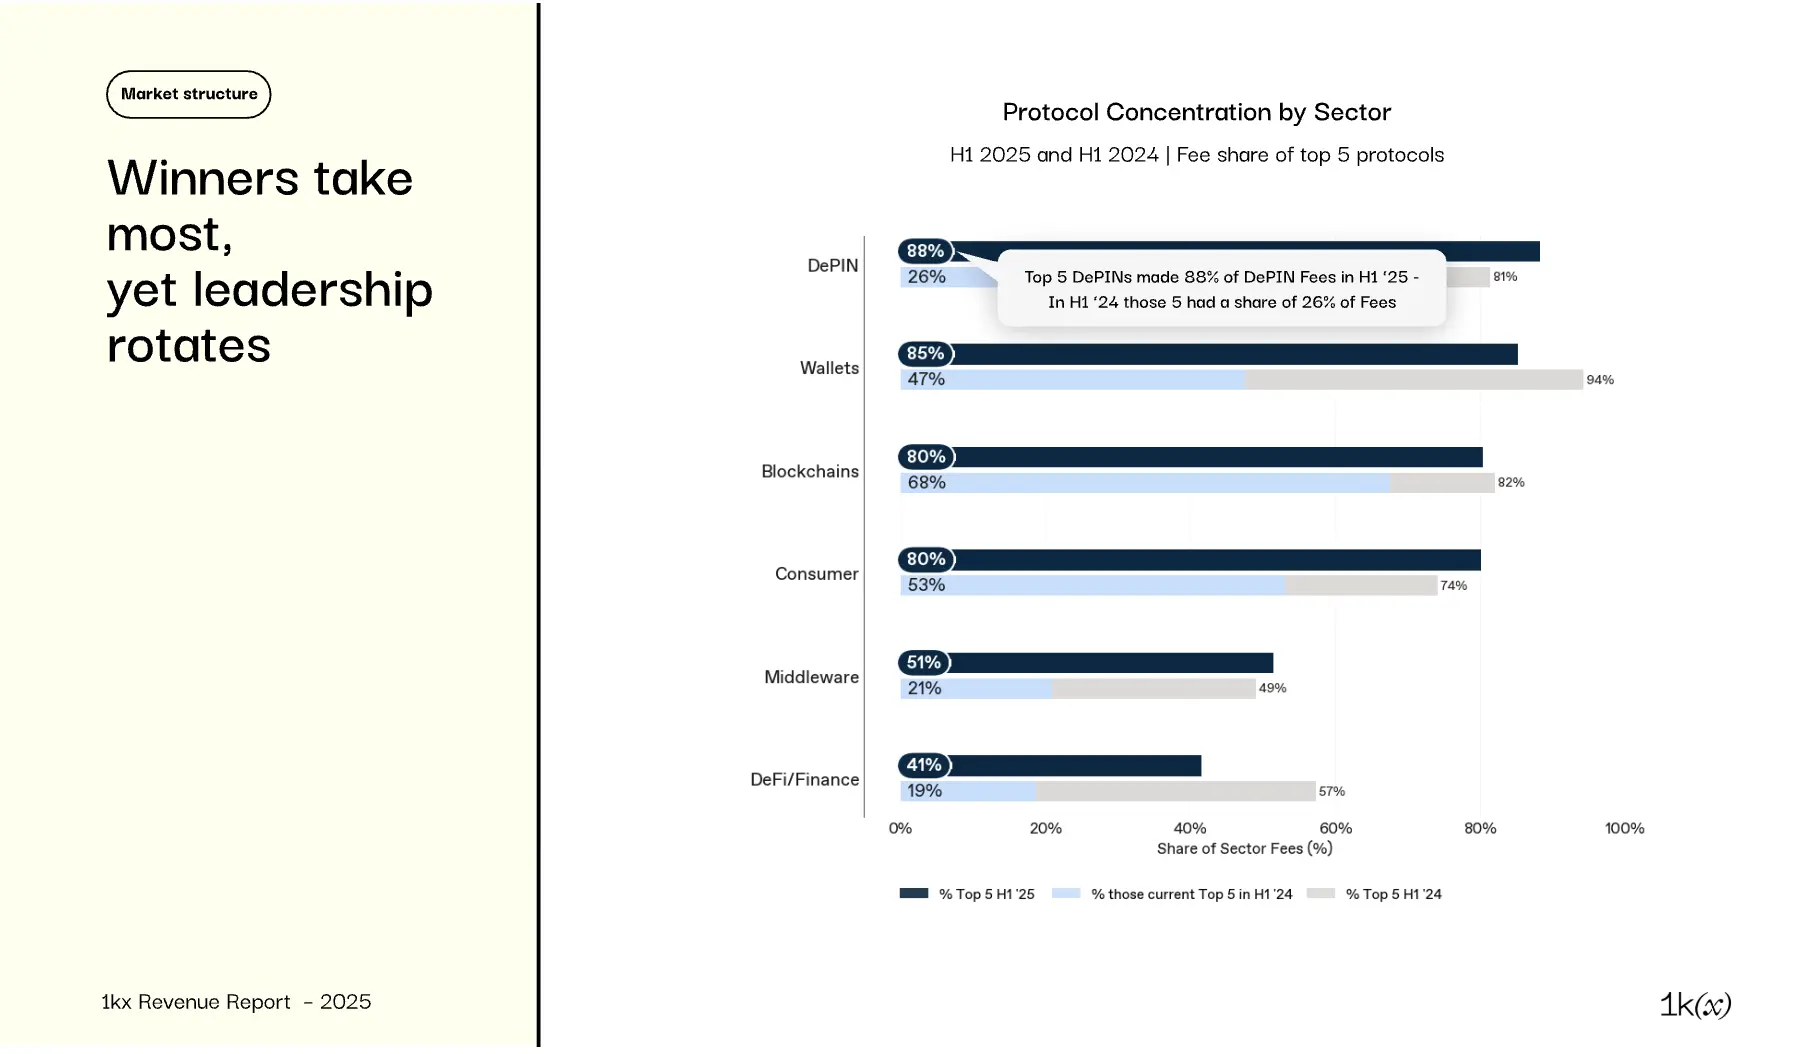
Fee generation is highly concentrated:
- In most domains, the top 5 protocols capture 80%+ of fees (higher for DePIN and wallets) — deep blue bars
- DeFi/Finance is more decentralized: the top 5 only account for 41%
But leadership is rotating:
- Up to 25% of the top 20 fee-generating protocols change each quarter
- The top 5 in 2025 captured far lower shares a year ago (light blue bars), as seen in the DePIN example in the chart
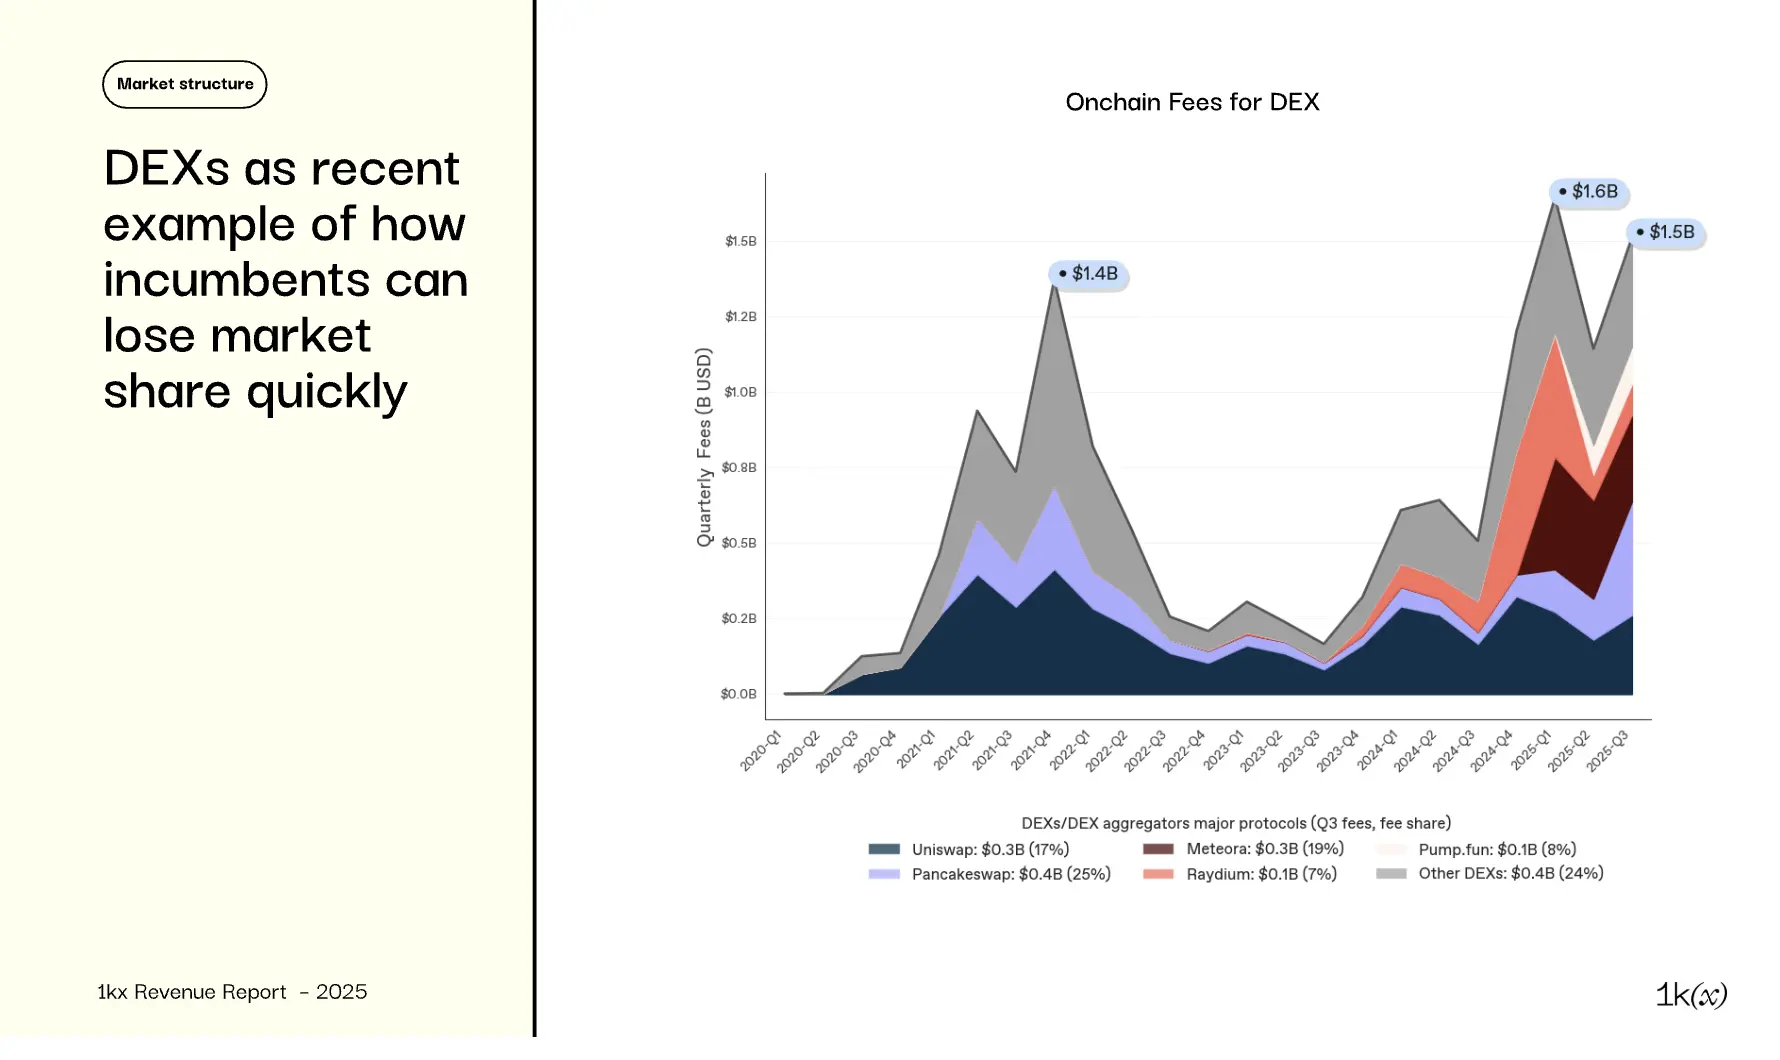
Overall DEX fees continue to rise, reaching a historical high for a single quarter in Q4 2024. Recent growth is primarily driven by DEX on Solana (such as Meteora and Raydium)
- These DEX had negligible fees a year ago — Solana DEX are both expanding market share and the overall on-chain fee pool
- Protocols like Pump.fun have also launched new DEX, quickly achieving high fee revenues
- Uniswap, as a previously leading mature DEX, maintains absolute levels but has lost market share due to not launching on Solana
- PancakeSwap achieved fee growth through expansion activities on the BNB Chain, leading in fee rankings in Q3 2025
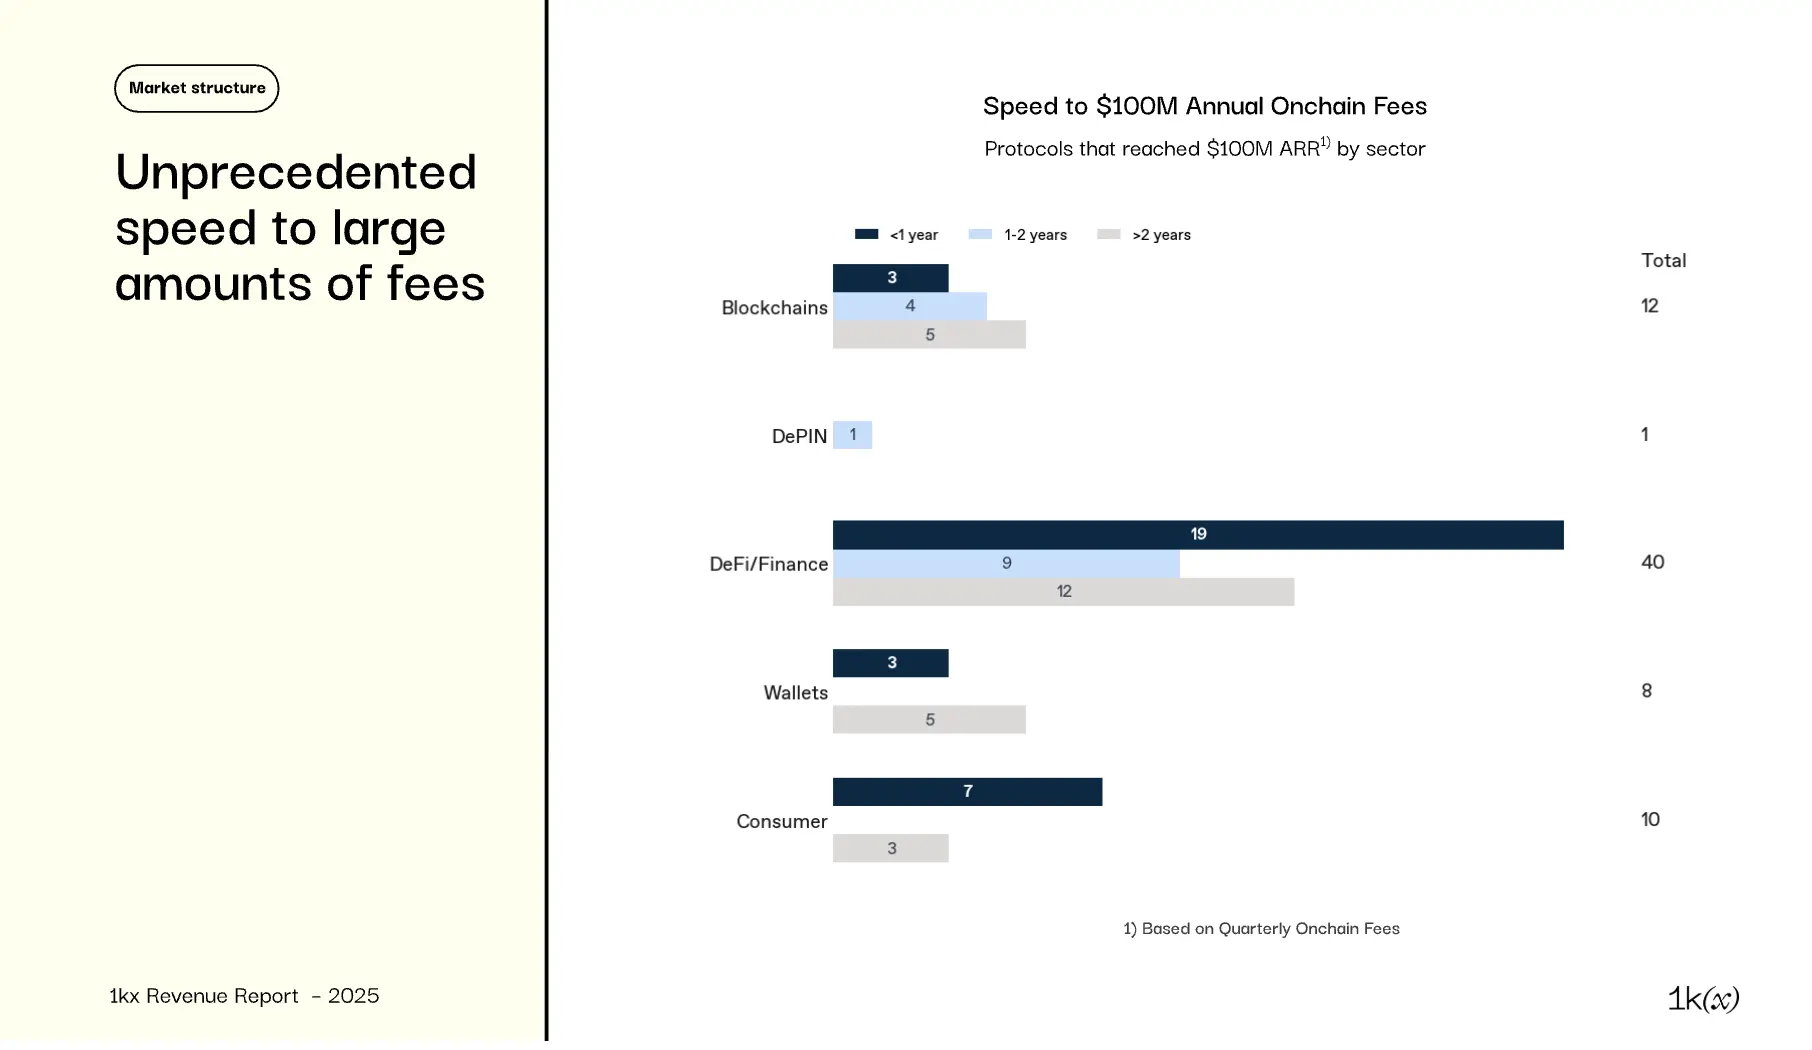
Among the over 1,000 protocols analyzed, 71 have annualized on-chain revenues exceeding $100 million, with 32 reaching this within a year, a speed comparable only to top AI breakthroughs (like Cursor). Examples include:
- Blockchain: Base, Filecoin, Linea
- DePIN: Aethir
- DeFi/Finance: Ethena, GMX, Virtuals, Sushiswap
- Wallets/Interfaces: Axiom, Moonshot, Photon
- Consumer: Friend.tech, LooksRare, Pump.fun
Many early surges were driven by incentives, such as LooksRare generating $500 million in fees in the first three months, but emitting an equal amount in rewards during the same period.
Notably, 16 of the 71 launched platforms after June 2023, all applications except for Base, highlighting the concentration of fee generation and the rapid disruption of infrastructure maturity. 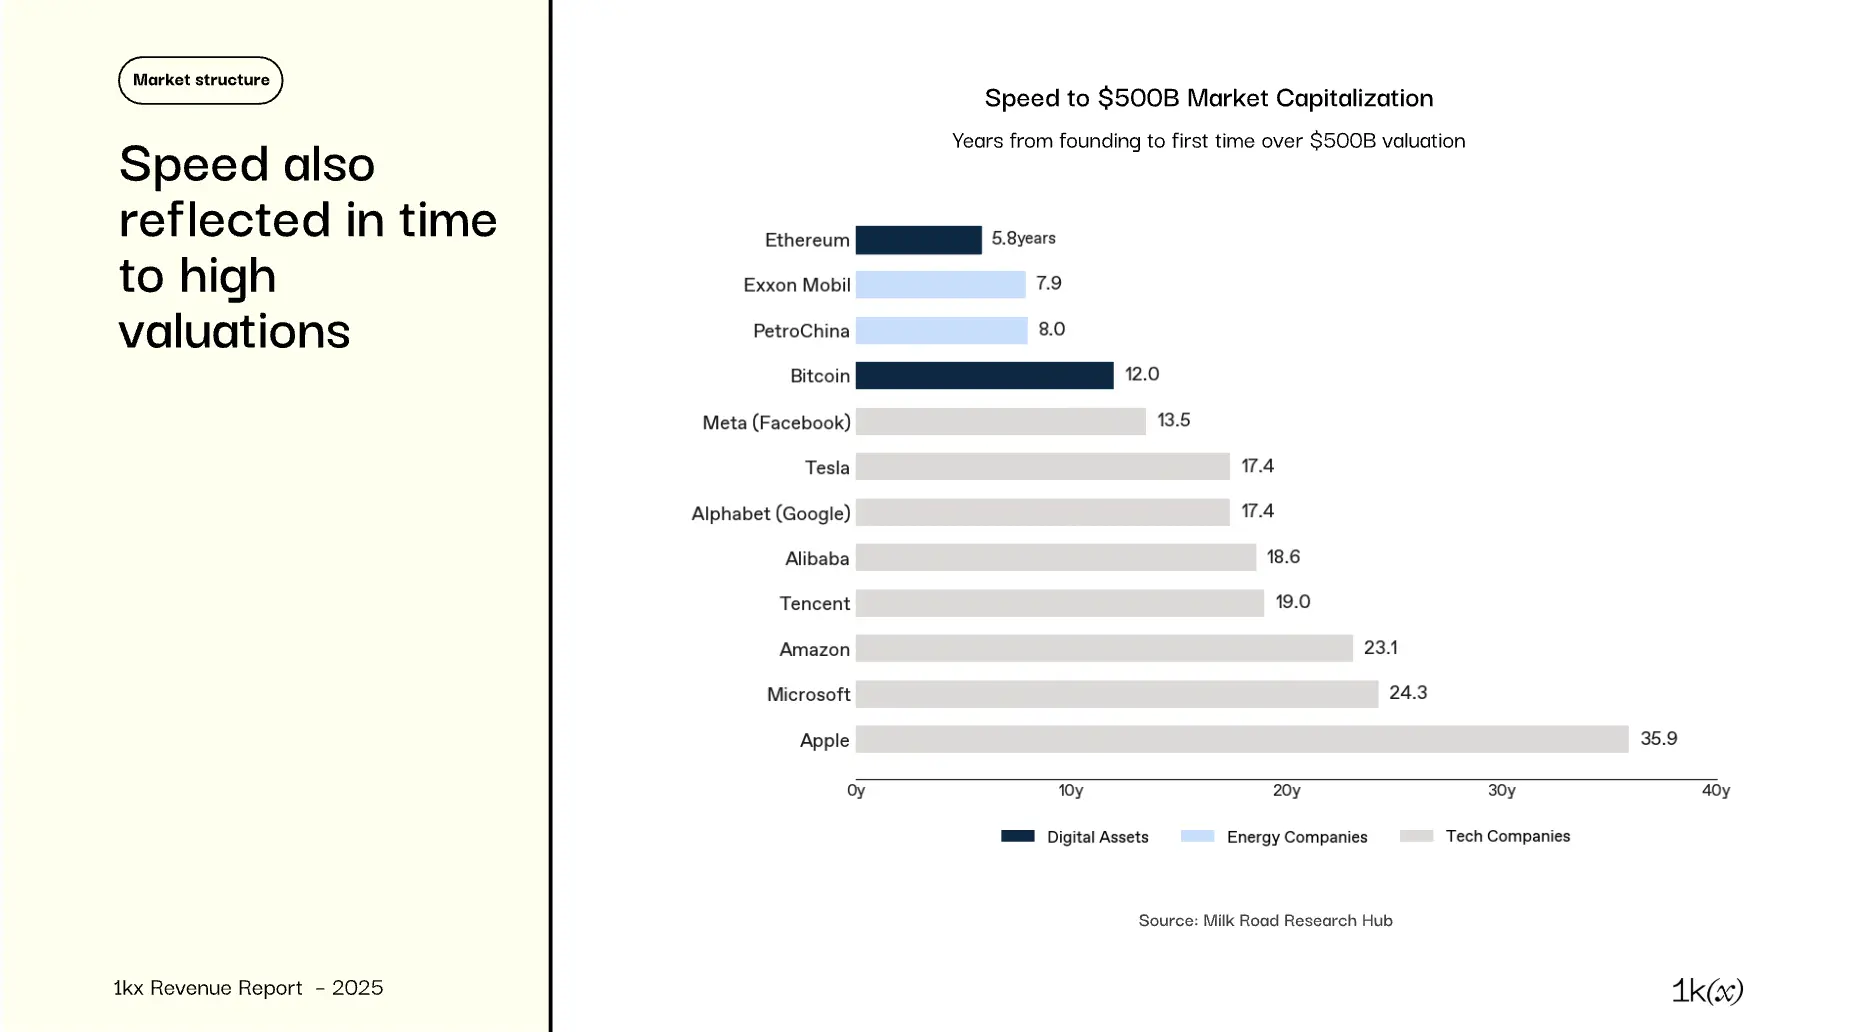
Ethereum is the first publicly investable asset to exceed a market cap of $500 billion within six years (during the 2021 bull market):
- Along with Bitcoin, its uniqueness lies in being globally accessible since its inception
- Before reaching this valuation, Ethereum took only 2.5 years to achieve $100 million ARR
- Ethereum's fee revenue has since declined, but in Q4 2021, annualized fees were close to $15 billion
- Only energy companies can match the speed of BTC and ETH's $500 billion valuation — Meta, as the fastest tech company, took 13.5 years
Application layer revenue is more strongly correlated with valuation, but public chains still dominate total market cap
What has the market missed? On-chain fees vs. valuation
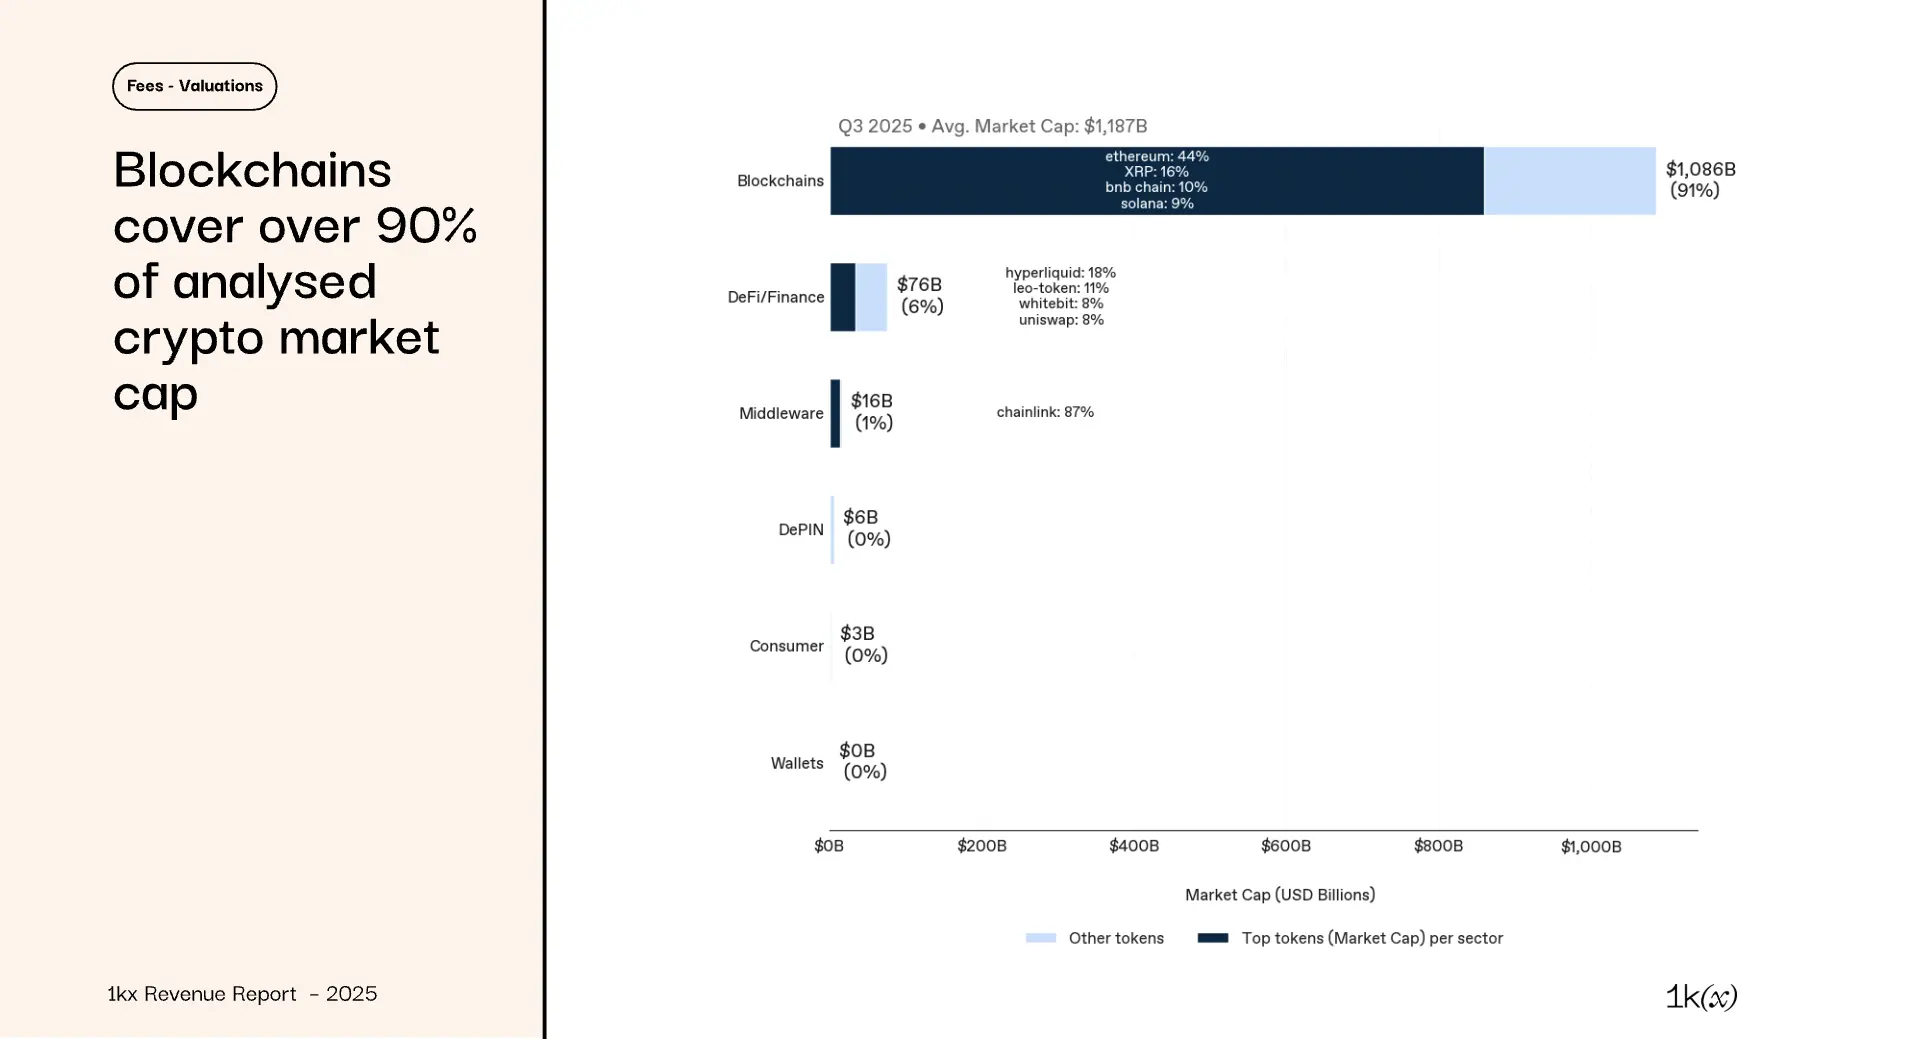
Public chains dominate the valuation of fee-generating protocols, accounting for 91% of the considered $12 trillion market cap (excluding Bitcoin)
- Ethereum, XRP, Solana, and BSC together account for ~80% of blockchain market cap
- DeFi/Finance 6%: Hyperliquid's perpetual contract DEX, launched less than a year ago, is leading in both valuation and fees
- All other domains combined account for 2% of market cap
- Therefore, the stark contrast between fees and market cap shares leads to a price/fee ratio (P/F, market cap/annualized fees): L1 is over a thousand times, while other domains range from 10-100 times (see the chart on the next page)
- This reflects the market's valuation premium for L1 (similar to Bitcoin, where value surpasses fee generation)
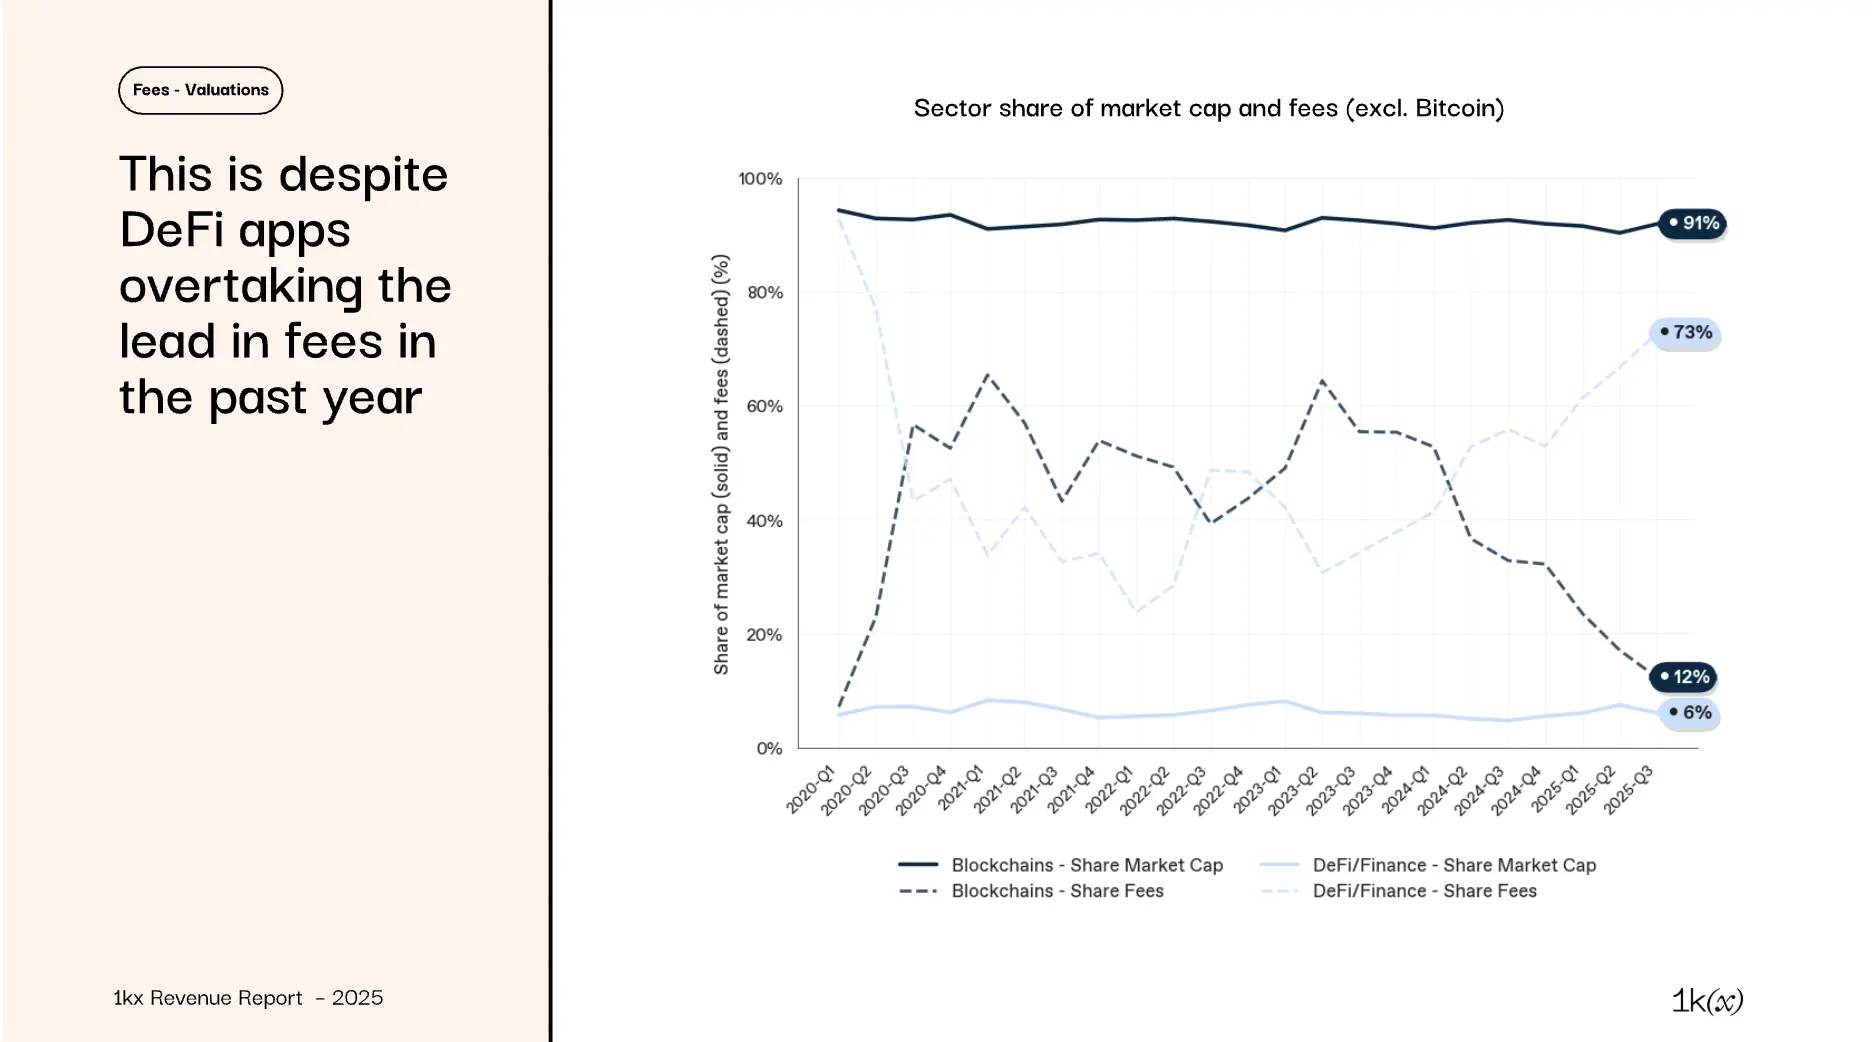
Valuation and fee share differentiation:
- Public chain valuations continue to account for over 90% of the total market cap of fee-generating protocols, despite their fee share dropping from over 60% in 2023 to 12% in Q3 2025
- In contrast, DeFi/Finance protocols account for 73% of total fees, but their total market cap share remains well below 10%
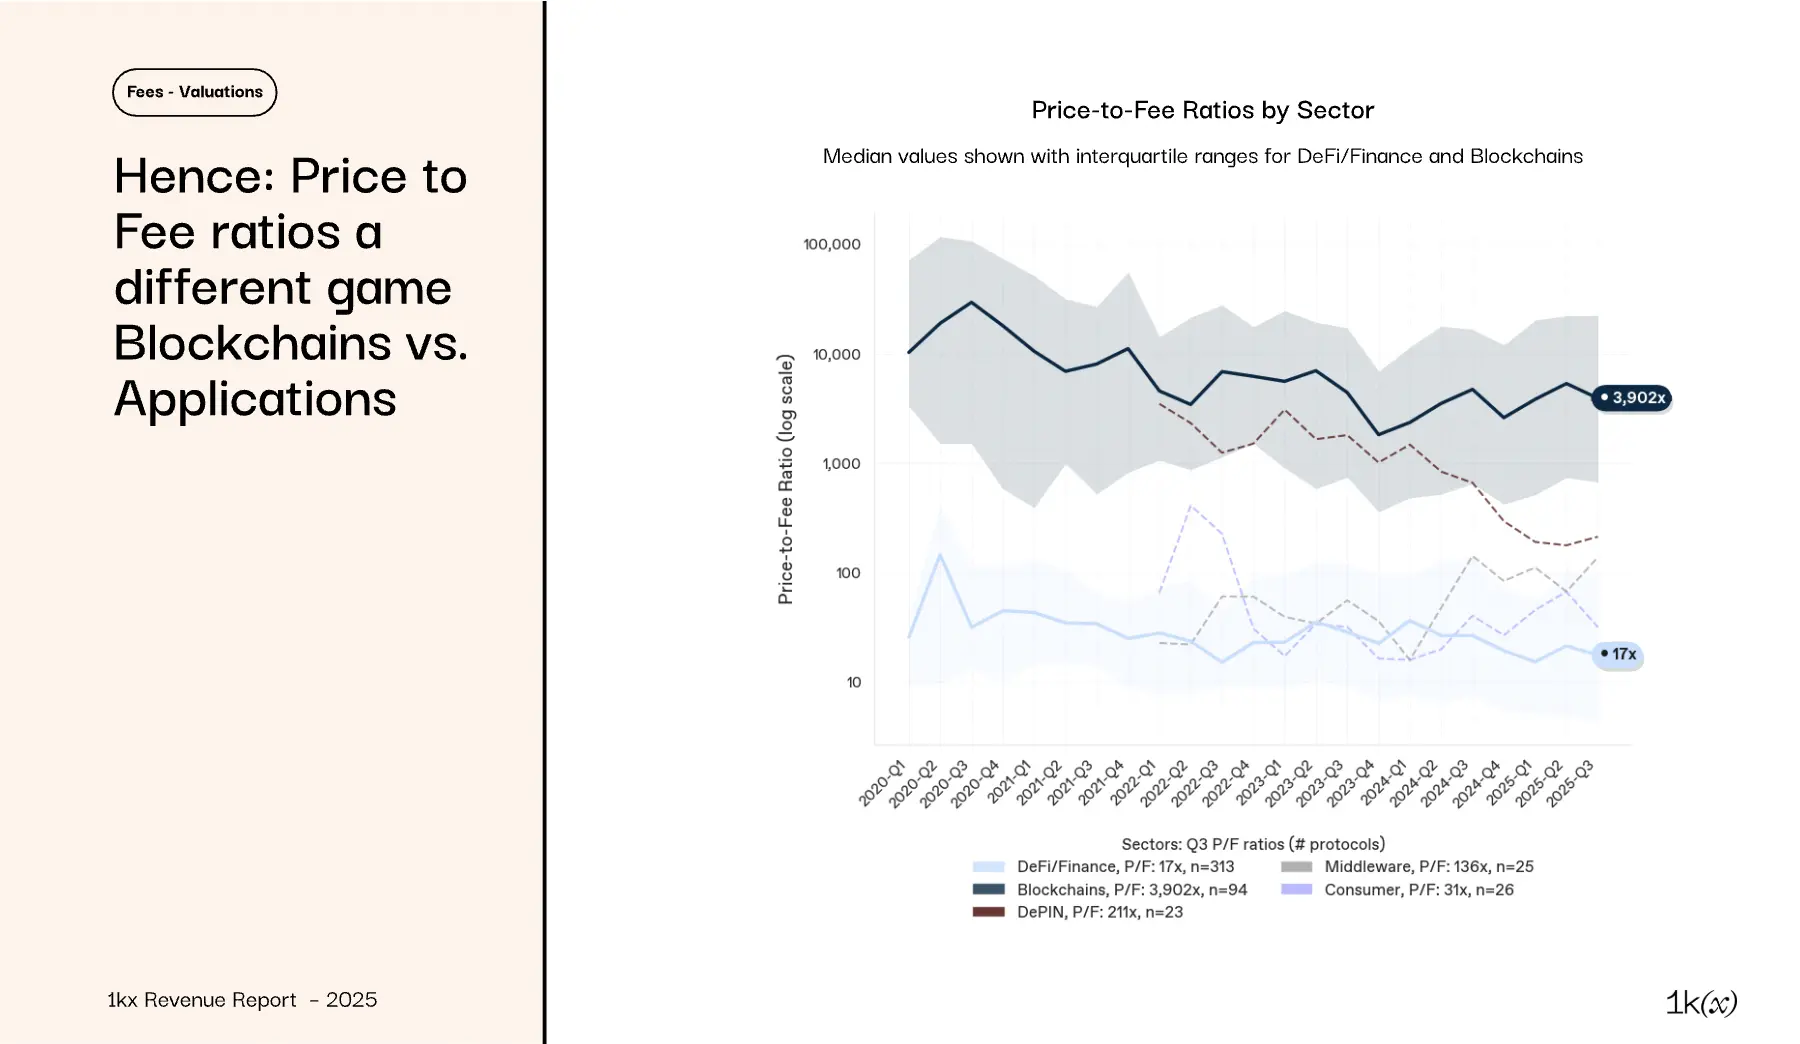
Price/Fee (P/F) ratio (fully diluted market cap/annualized fees) is significantly higher in blockchain than in applications, reflecting the aforementioned differentiation in valuation and fee generation:
- Blockchain: The median P/F ratio in Q3 2025 is 3,902 times (L1 ~7,300 times)
- DeFi/Finance: The median P/F ratio is 17 times (DEX 14 times, lending 8 times)
- Domain range is broad: The interquartile range for blockchain (Q3 2025) is 1,000–12,000 times, but has remained stable within a wide range over the past three years
- DePIN exception: The median has dropped from ~1,000 times a year ago to 211 times
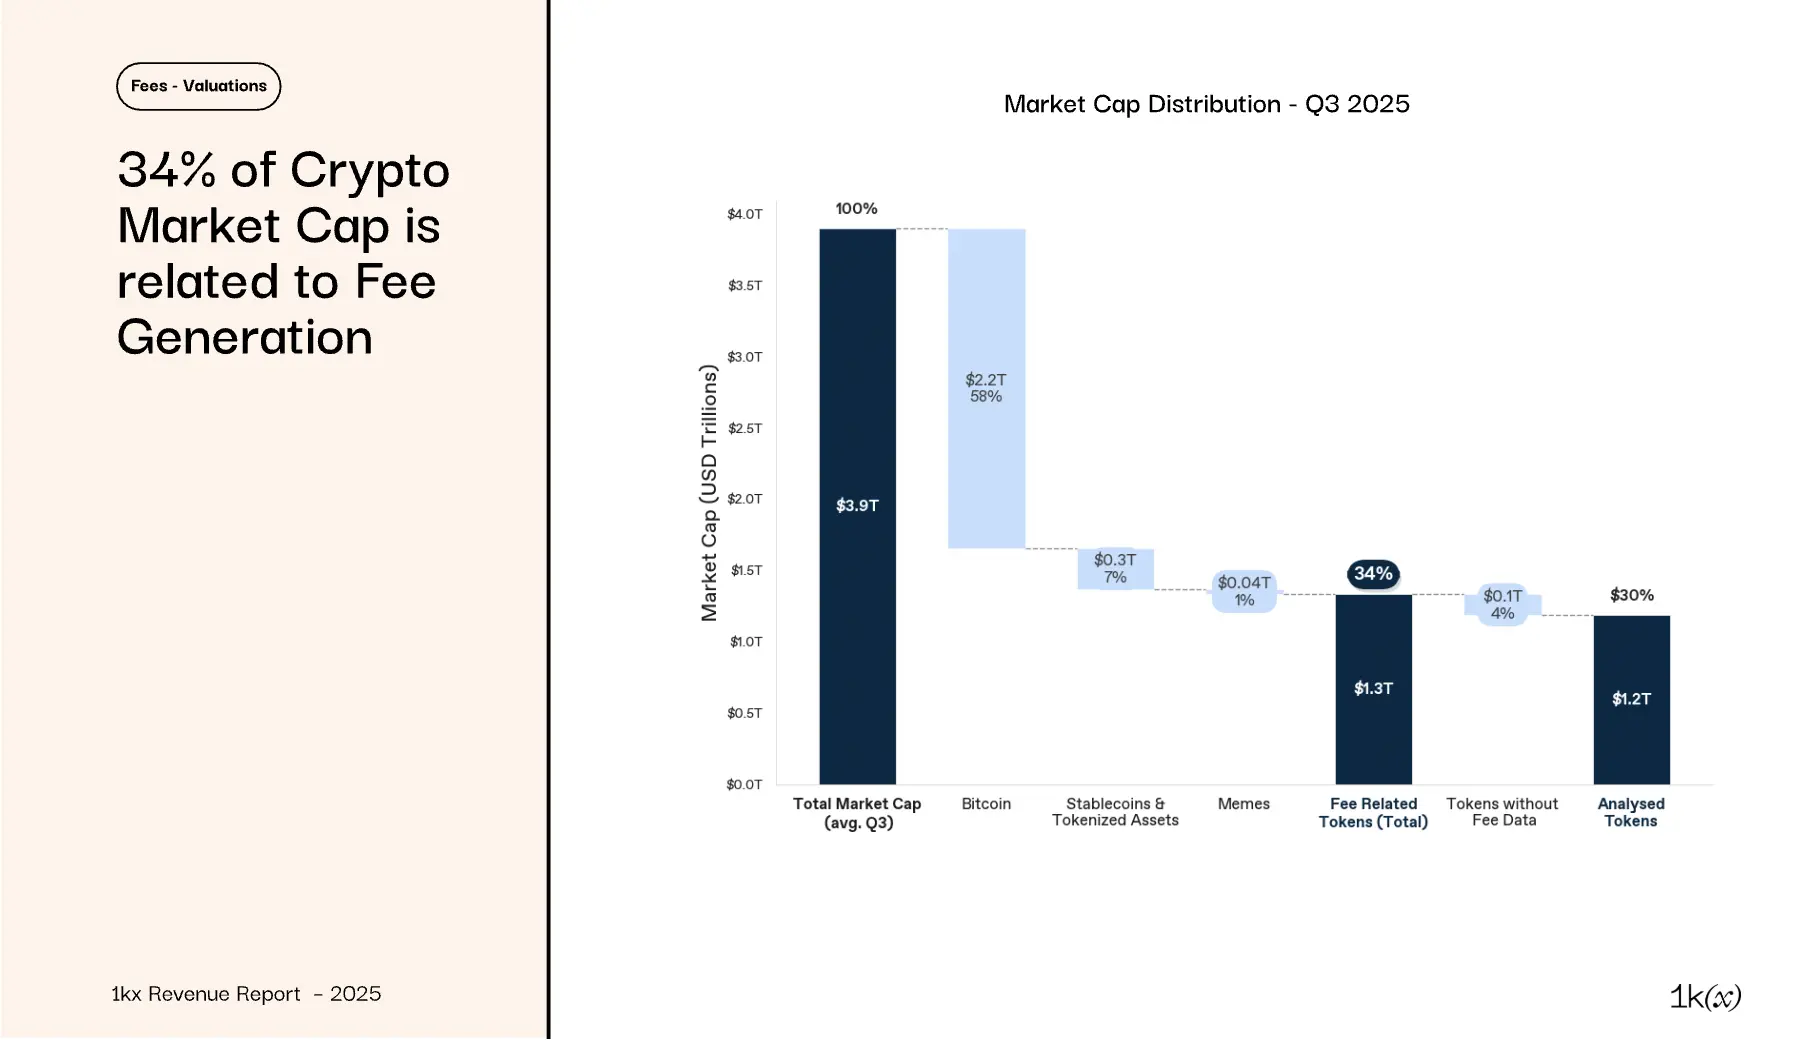
Not all tokens represent fee-generating protocols, thus they are excluded from the fee-valuation comparison. These exclusions account for 66% of the average market cap in Q3 2025:
- 58% Bitcoin: Viewed as "digital gold." While the Bitcoin blockchain generates fees, its impact on its value is negligible¹⁾
- 7% Stablecoins/tokenized assets: Mainly stablecoins; reserve earnings are not user-paid and do not belong to token holders
- 1% Meme coins²⁾: Driven by speculative trading, with no cash flow
- An additional 4% is excluded due to no fees or data
The result is $12 trillion / 30% of total market cap, which forms the basis for our analysis comparing fees and valuations.
Note: Some fee-generating protocols have no tokens, hence no valuation. These account for 24% of total fees in the first half of 2025, with ~60% contributed by Meteora, Phantom, Axiom, Photon, and Flashbots.
Fees as a source of income for miners securing Bitcoin may become important in the future, as the primary income source (mining rewards) declines exponentially, especially as meme coins (like Dogecoin) are included in the analysis due to their protocols generating transaction fees.
Tokenization, DePIN, wallets, and consumer sectors are high-growth areas
Where will the next wave of growth come from?
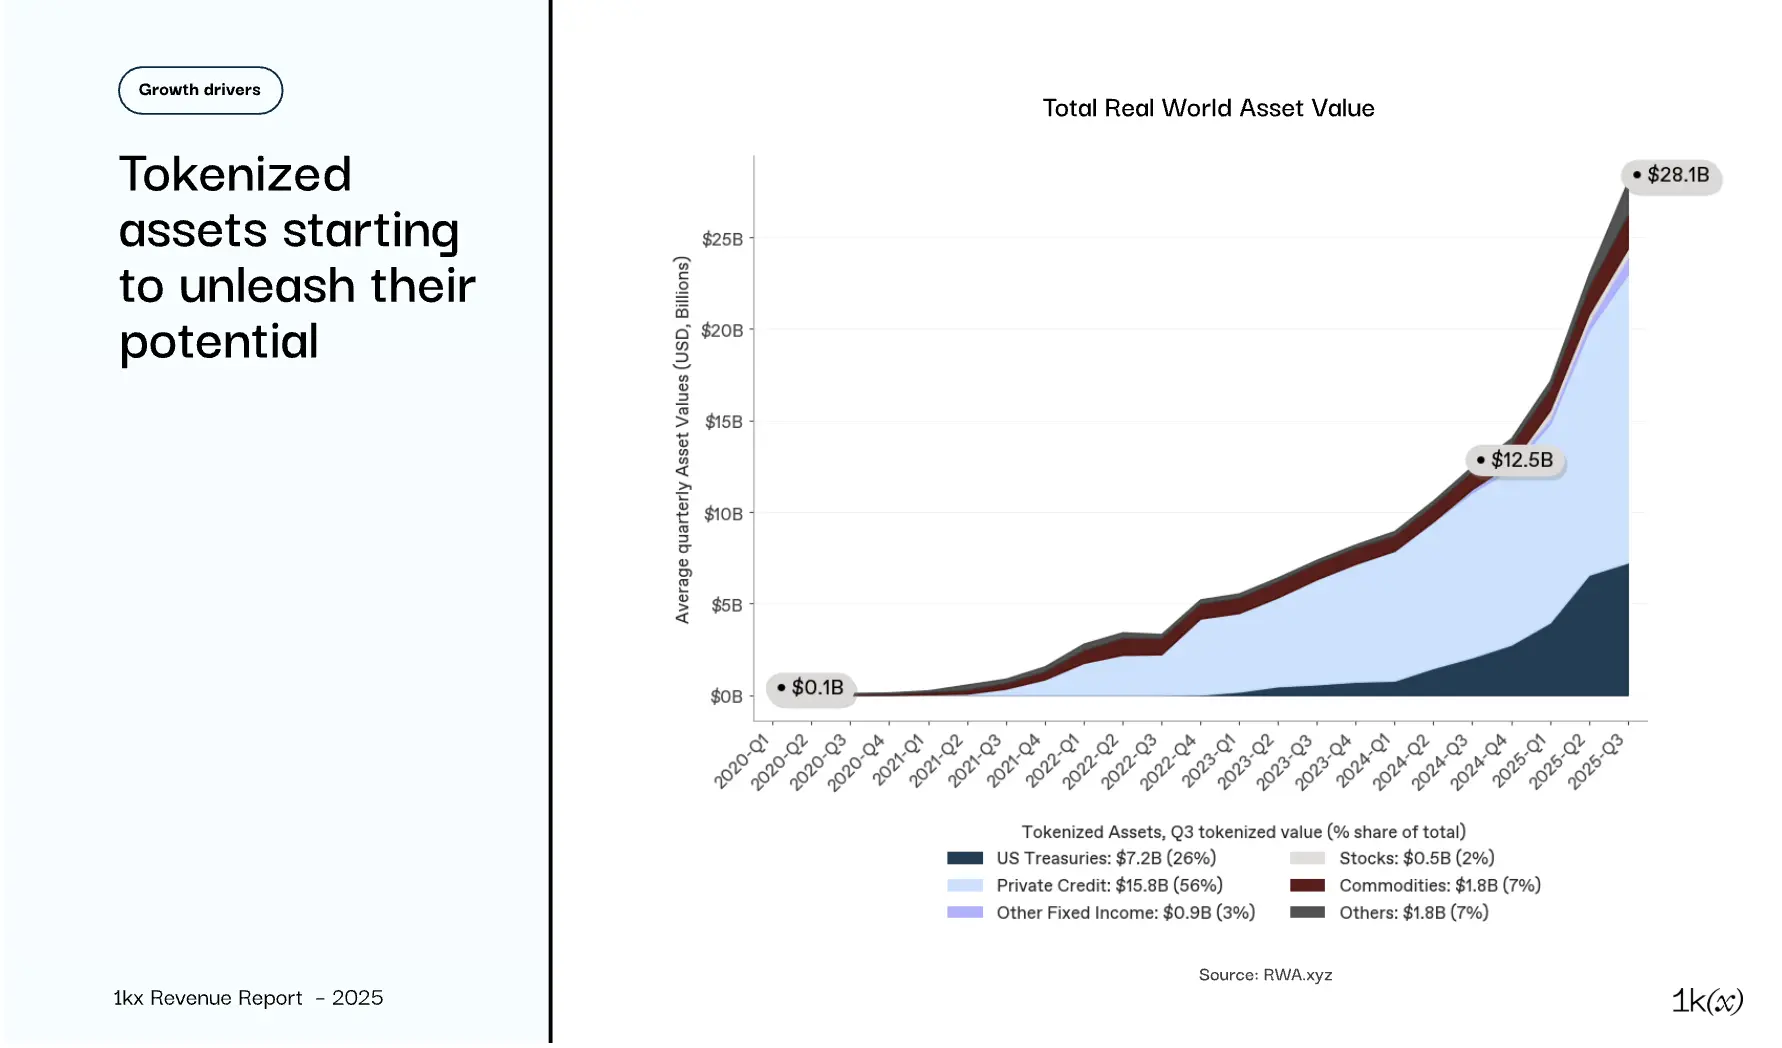
Real World Asset Tokenization (RWA) is the subfield with the least fees in DeFi, but:
- The on-chain value of RWA assets has doubled year-on-year, with a compound annual growth rate of 235% over the past four years
- On-chain fees are growing even faster: Q3 saw a 50-fold year-on-year increase, although the scale is small ($15 million)
- These fees are charged in the form of AUM management fees, transaction fees, or management fees
- Given favorable regulations (more asset classes), increasing RWA AUM²⁾, and more off-chain value "on-chain," fee growth is expected to continue
- Note: Some of the largest RWA protocols (like BlackRock's BUIDL) are not included in on-chain fees
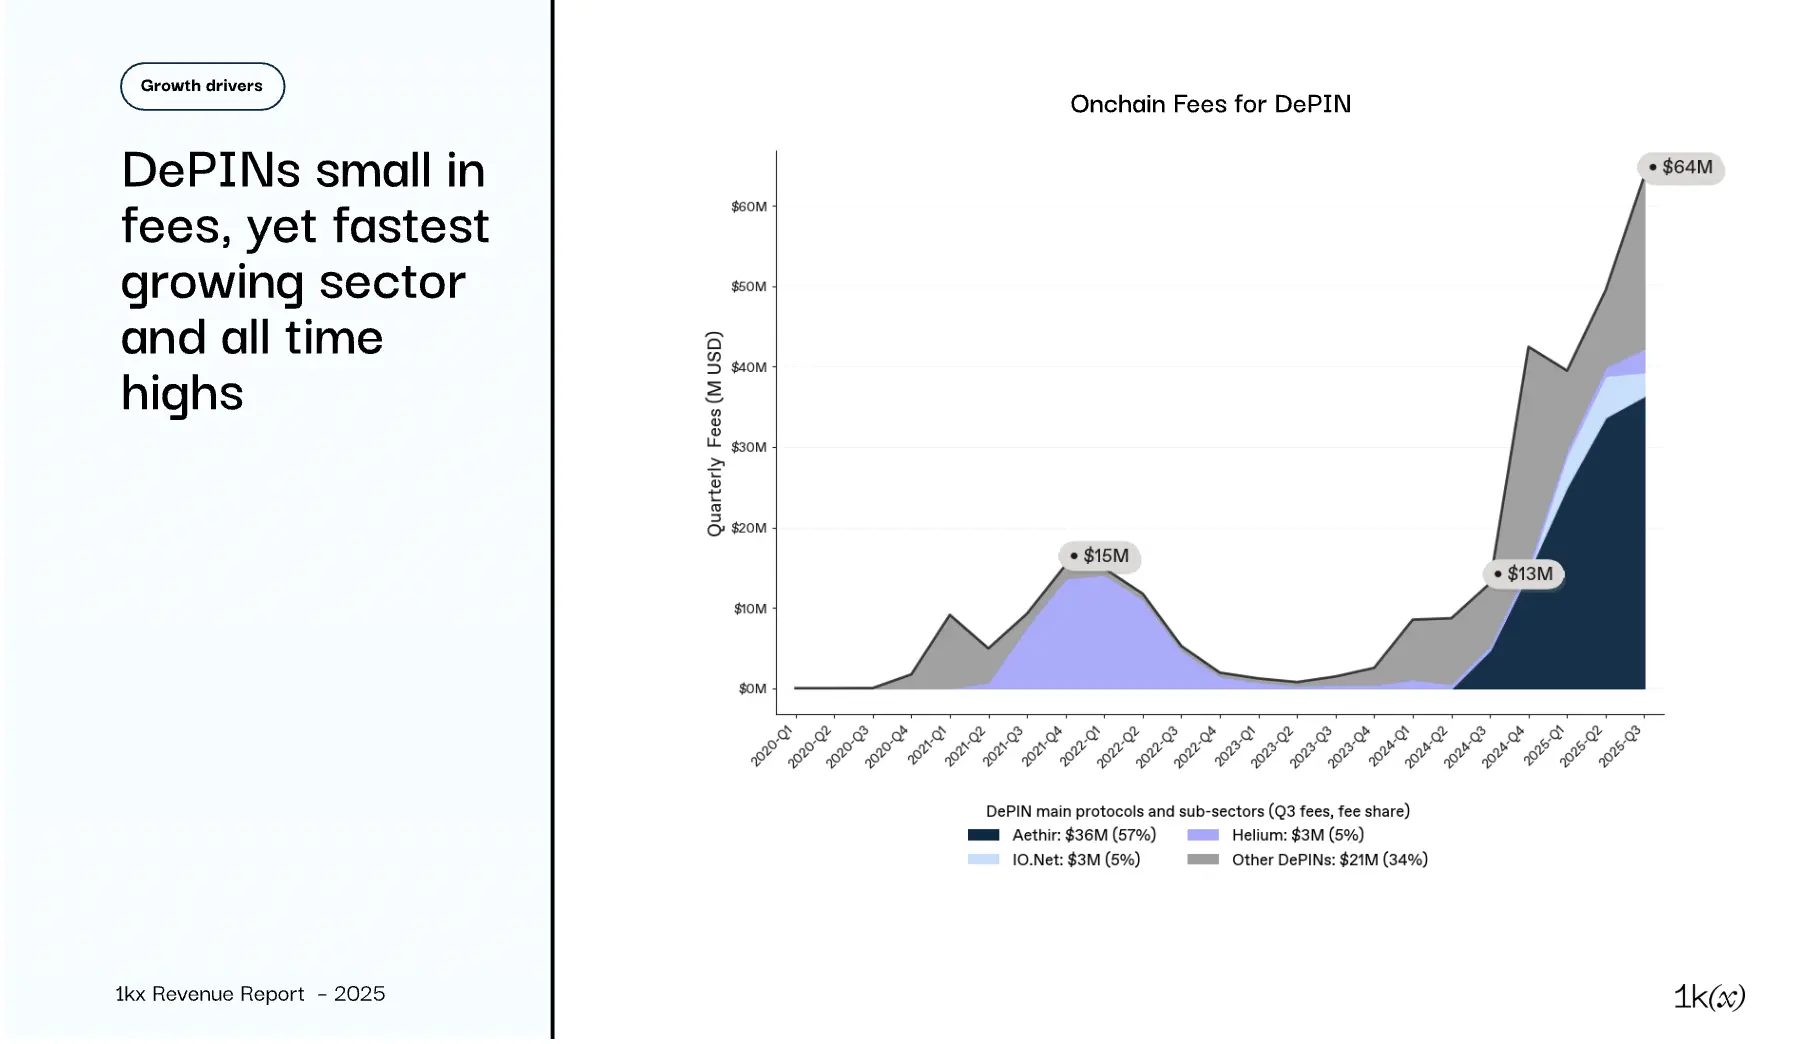
DePIN is a relatively young field, with significant monetization beginning last year, aside from early pioneers (like Helium, Akash, Arweave):
- Year-on-year fee growth of ~5 times, driven by Aethir and IO.Net's sustained growth
- Aethir provides the majority of GPU computing, but fees are based on buybacks
- Although Aethir and IO.Net saw a slowdown in growth in Q3, overall growth in the sector is evident, with more revenue expected to go on-chain in the coming quarters
- The World Economic Forum predicts that the valuation of the DePIN sector will reach $3.5 trillion by 2028 (~90 times that of 2025), indicating that the recent rapid growth will continue
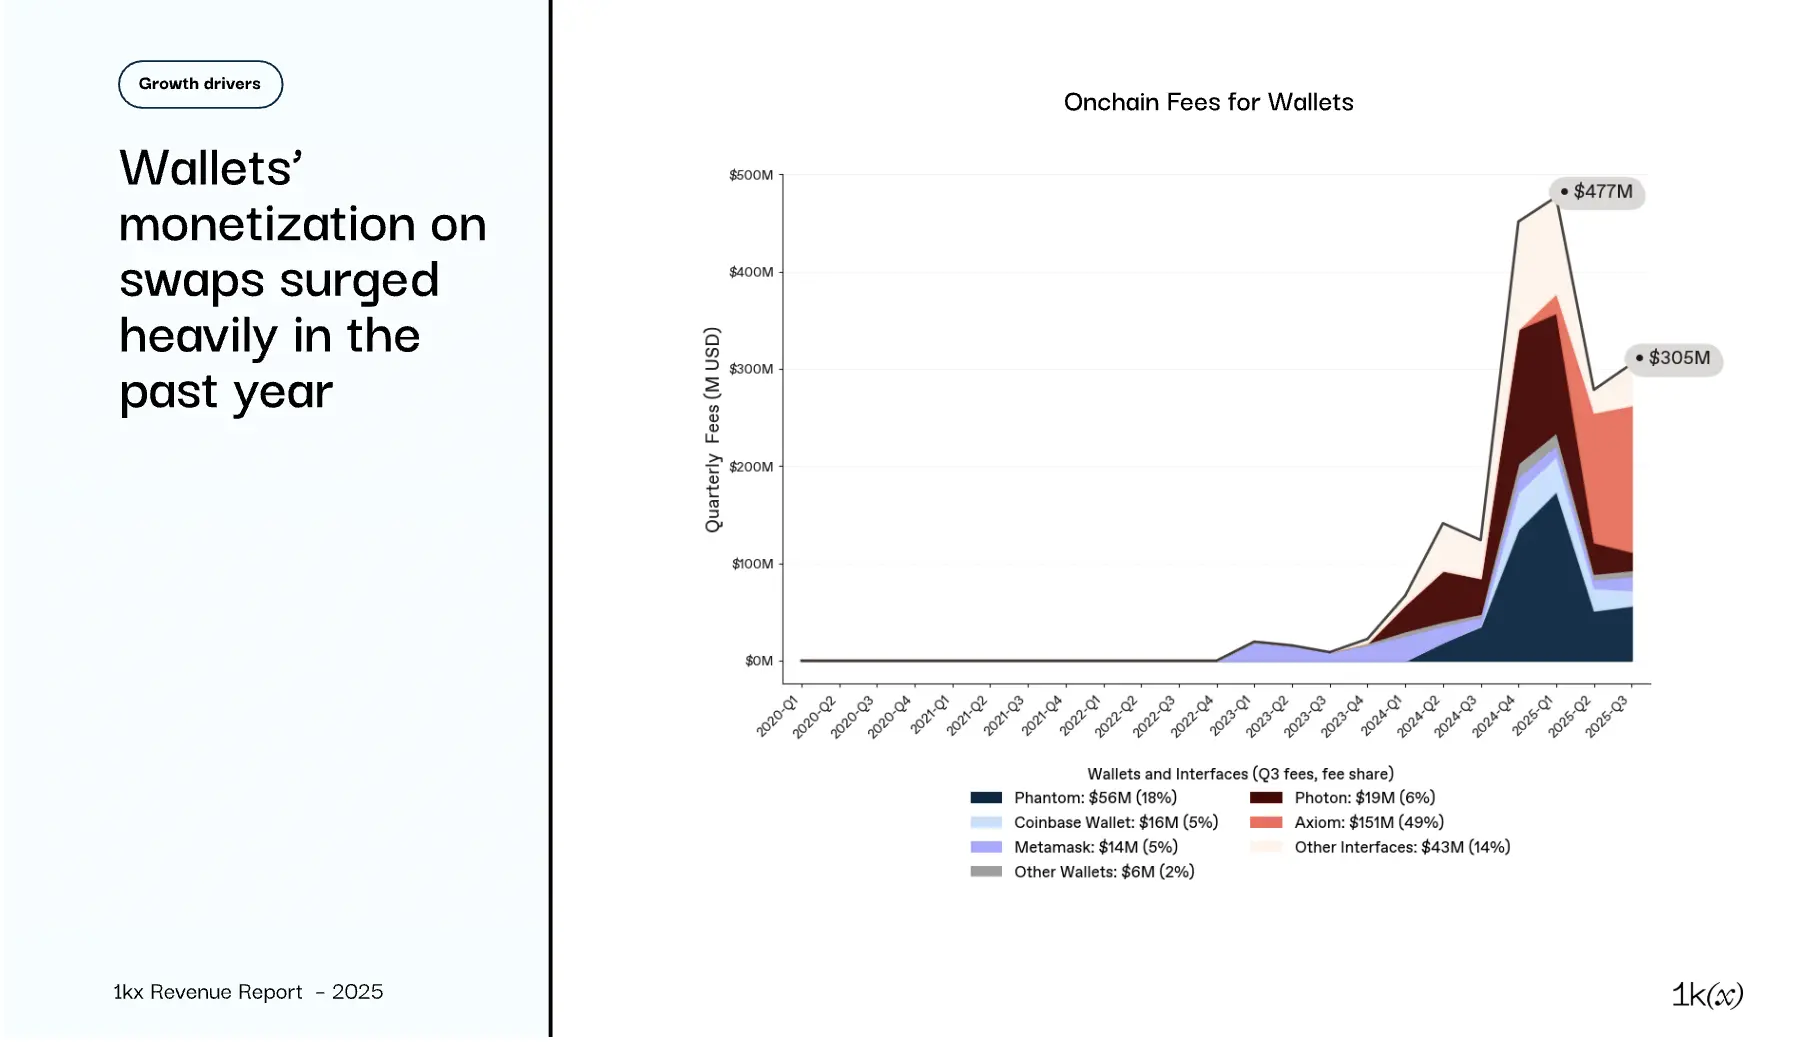
Wallets and trading interfaces/apps directly engage users, primarily monetizing through exchange fees:
- Phantom has significantly increased fees since Q4 2024 due to a surge in Solana activity
- Coinbase Wallet has monthly fee revenues of $5-15 million since December 2024, capturing a share of fees
- Metamask has lost market share since Phantom and Coinbase entered fee generation
- Interfaces that emerged in 2024, such as Photon, provide trader-friendly UX
- The market declined in Q2, with wallet fee revenues decreasing by ~60% quarter-on-quarter
Launchpads surged in the second half of 2024, with Pump.fun leading, generating approximately $250 million in on-chain fees in Q1 2025
- Other platforms (like Launchcoin on Believe, Meteora) began monetizing in Q2 2025, capturing market share
- Launchpads demonstrate that fees can scale quickly — but historical warnings: fees for games (Axie, Sandbox) and creator economies (Opensea, LooksRare) surged sharply in early 2021/2022 before also declining steeply
On-chain fees are expected to achieve 60% year-on-year growth in 2026, with all growth attributed to the application layer
Future trends in on-chain fees?
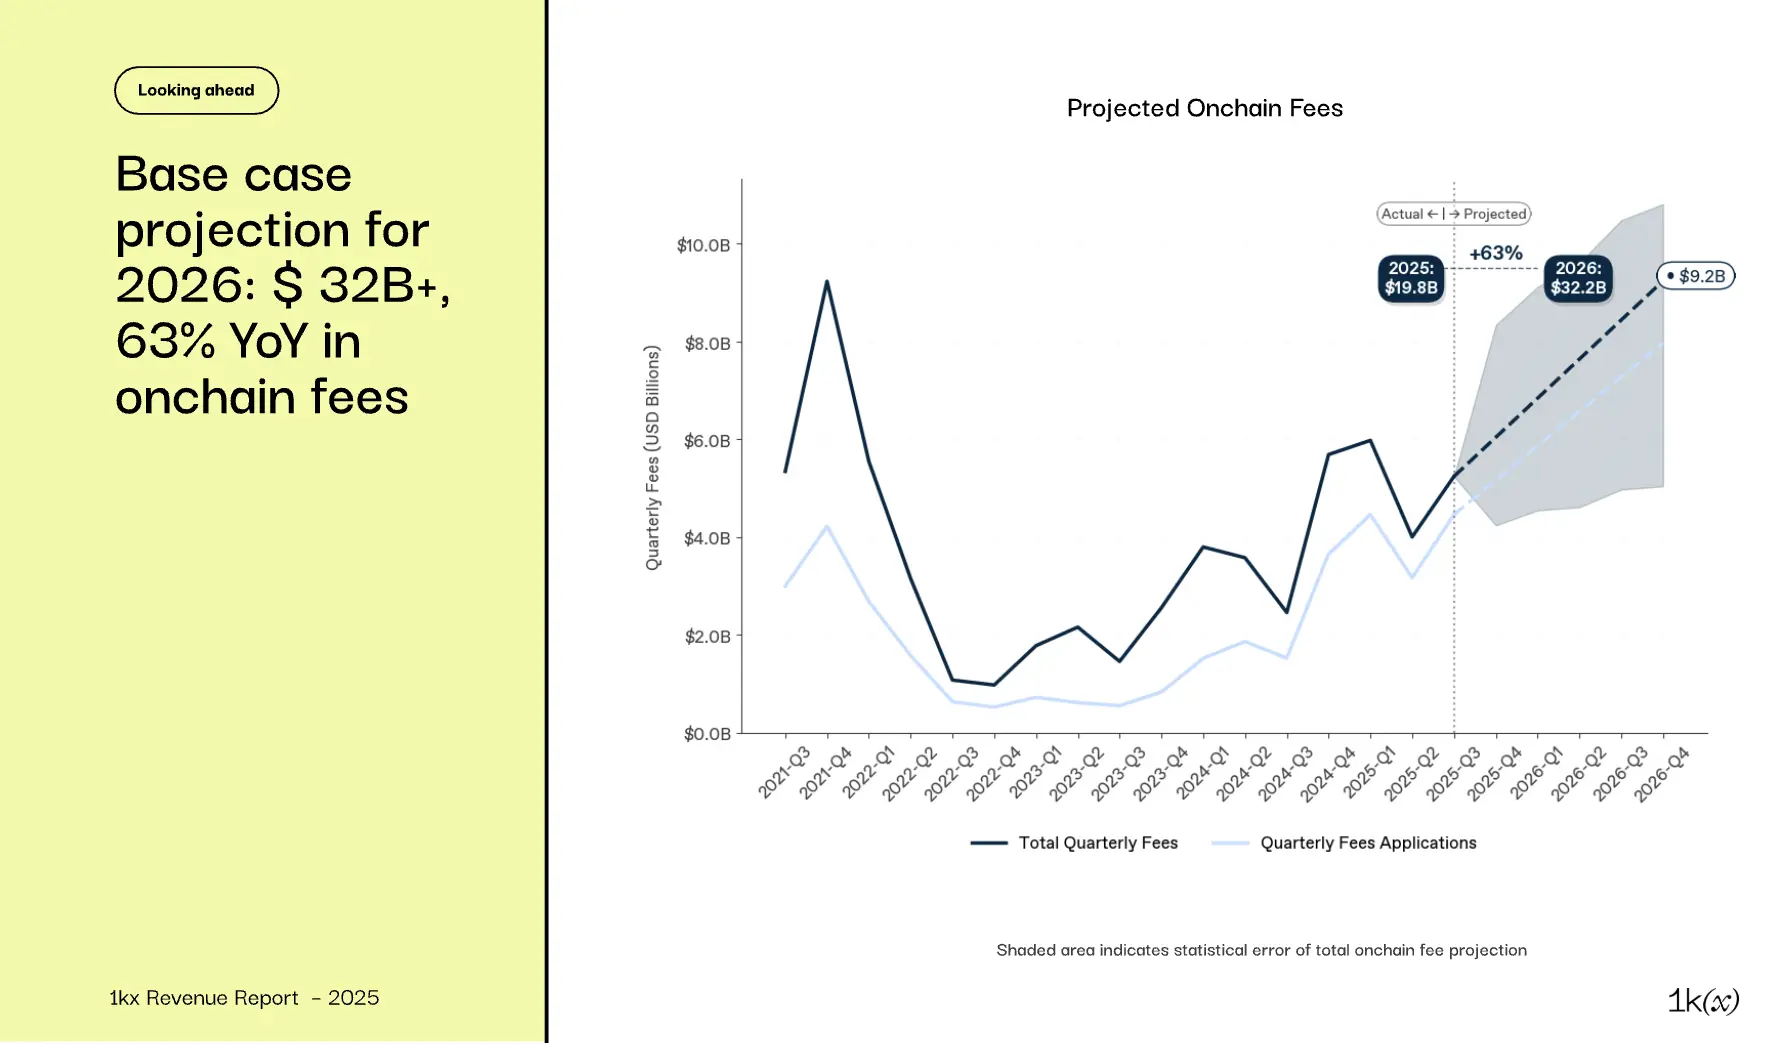
Baseline forecast: On-chain fees will exceed $32 billion in 2026, with a year-on-year growth of 63%, continuing the application-driven growth trajectory:
- Blockchain: Limited growth; efficiency improvements continue to offset higher activity; deviations are still market-driven (e.g., the "Meme Coin Frenzy" in 2024/2025)
- DeFi/Finance: Continued expansion (>50% year-on-year growth), although sensitive to asset prices, new subfields provide support
- Emerging fields:
- RWA: On-chain fees of $500 million in 2026 (expected to grow 10 times year-on-year), based on AUM growth forecasts
- DePIN: >$450 million, maintaining triple-digit growth
- Wallets: Growth slightly above DeFi (50%)
- Consumer: ~70% year-on-year growth, but with a two-way margin of error
- Middleware growth of 50%, as many protocols are about to start or increase monetization (e.g., Wallet Connect)
Application fees replicate the 2021 blockchain fee surge, but recent on-chain fee growth is entirely driven by applications, and this trend is expected to continue:
- Emerging fields like RWA, DePIN, wallets, and consumer applications saw triple-digit fee growth in the first half of 2025 (red line), with an expected further increase of ~70% in 2026
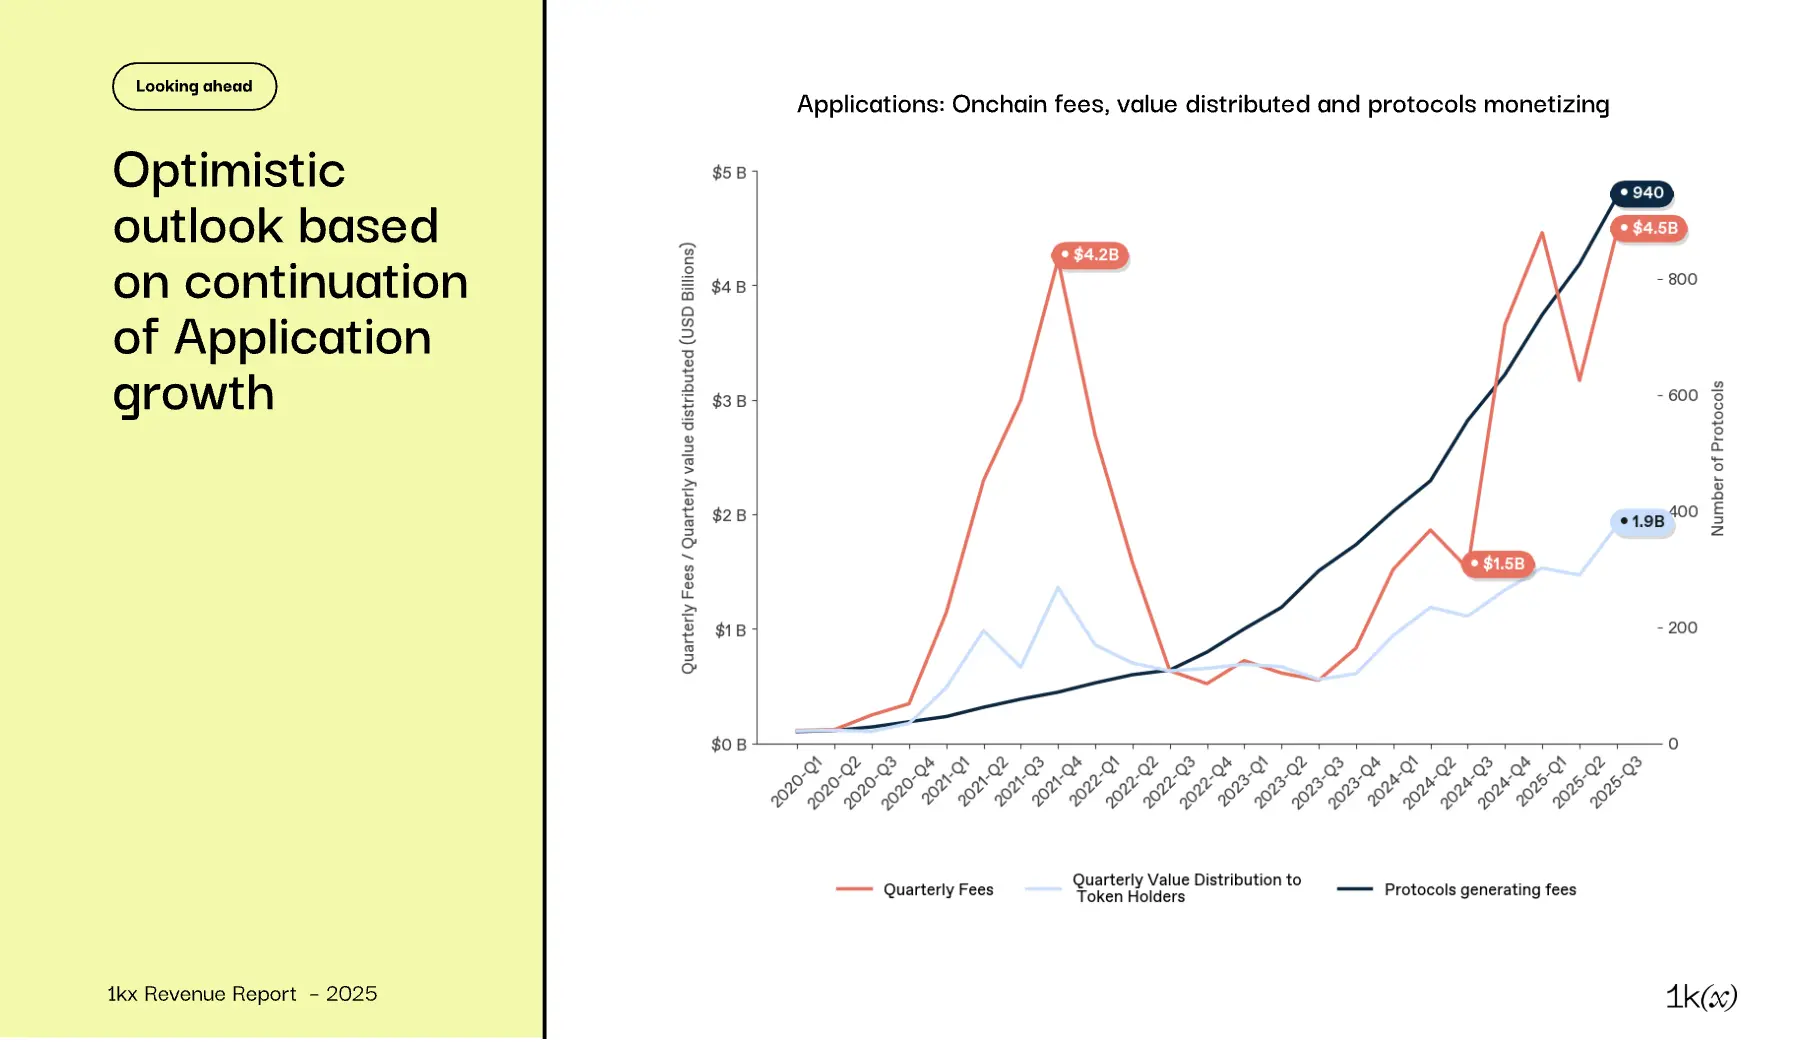
- The number of monetizing protocols in consumer and DePIN sectors has already increased in 2025 (dark line in the chart). This trend will extend to all application areas
- Almost all value allocated to token holders comes from applications (light blue line). Regulatory tailwinds will reinforce this trend
Regulatory environment undergoes a 180-degree shift
Regulators change their stance, signaling a loosening of digital asset regulations
- DeFi applications are clearer: MiCA, Genius Act
- Framework evolution (Clarity Act, SEC shifting from enforcement-first to rule-making-first)
- As regulators and elected officials become more familiar with blockchain technology, laws and regulations will become more adaptable. The new SEC chair has stated that crypto and tokenization are top priorities
The U.S. environment shows that mainstream adoption is ready
- Tokenized funds (BlackRock's BUIDL fund, tokenized through Securitize)
- Tokenized stocks (e.g., Galaxy's $GLXY, tokenized through Superstate)
- Robinhood announces the launch of an L2 specifically for RWA
- The Depository Trust & Clearing Corporation (DTCC) announces plans to tokenize its clearing activities
- Digital Asset Treasury Companies (DATs) are gaining popularity
Compliance remains a barrier to on-chain liquidity
The flow of on-chain value and fee generation is still affected by the unclear treatment under U.S. tax law. Examples of open questions include:
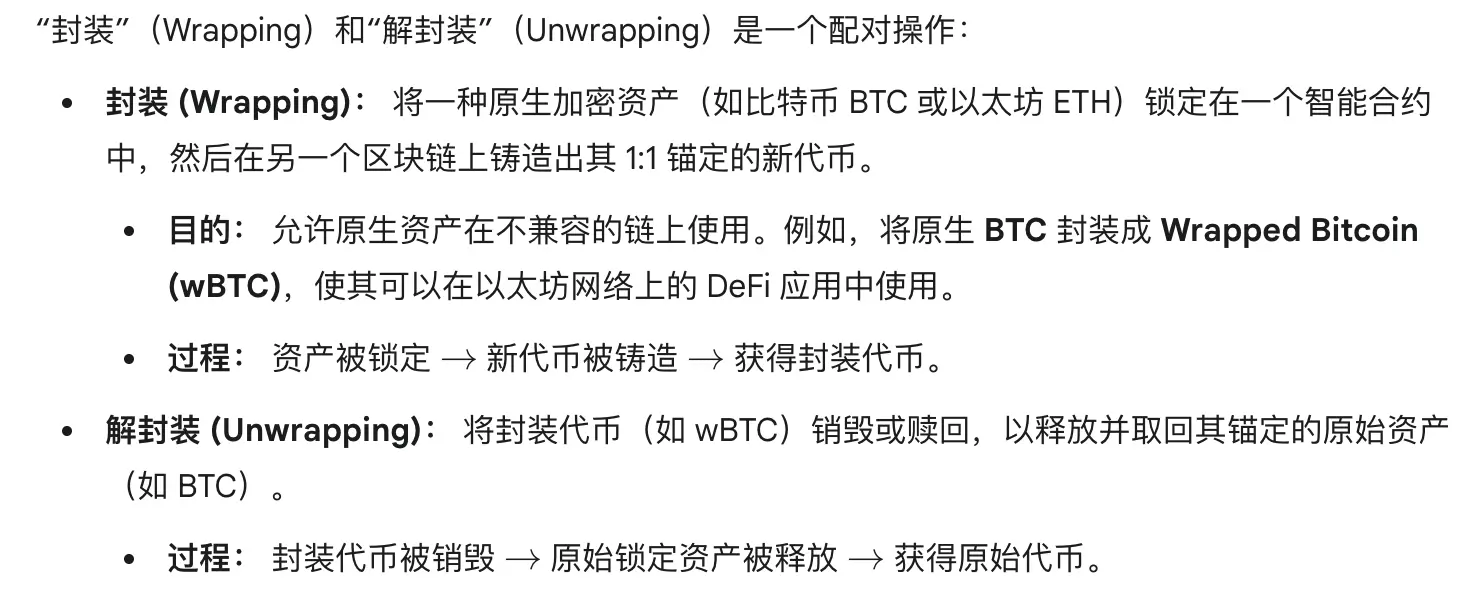
- Are wrapped tokens taxable?
- Is there a difference in tax treatment between base LST (stETH) and accumulated LST (wstETH)?
- When is staking reward income recognized — at the time of accrual or when received?
Conclusion and Outlook
Users paid $9.7 billion in on-chain fees in the first half of 2025, marking the second-highest record since the second half of 2021. At that time, fee generation was driven by billions of dollars in user incentives, related speculation, and a few high-cost PoW blockchains.
Today, fees are primarily generated by applications, mainly in financial use cases, but are rapidly expanding into DePIN, wallets, and consumer applications (each with year-on-year growth >200%).
Despite higher throughput, blockchain fees remain flat, as efficiency improvements reduce unit costs — this dynamic extends to DEX and other mature protocols. This enables applications to scale quickly and profitably.
As a result, the value allocated to token holders (such as buybacks and token burns) has reached an all-time high over the past three quarters.
The regulatory environment has also shifted, with recent legislation (like the Genius Act) supporting institutional participation in DeFi and further legitimizing value distribution to token holders expected.
Outlook: On-chain fees are projected to confirm a continued upward trend in on-chain monetization, with $32 billion+ / 63% year-on-year growth expected in 2026. The speed and scale of application expansion are unprecedented, with increased value distribution and regulatory clarity supporting broader investor participation. As shown by the relationship between application fees and valuations, the on-chain economy has entered a more mature stage, and fundamental fee metrics are worth close attention from investors.
Research Methodology
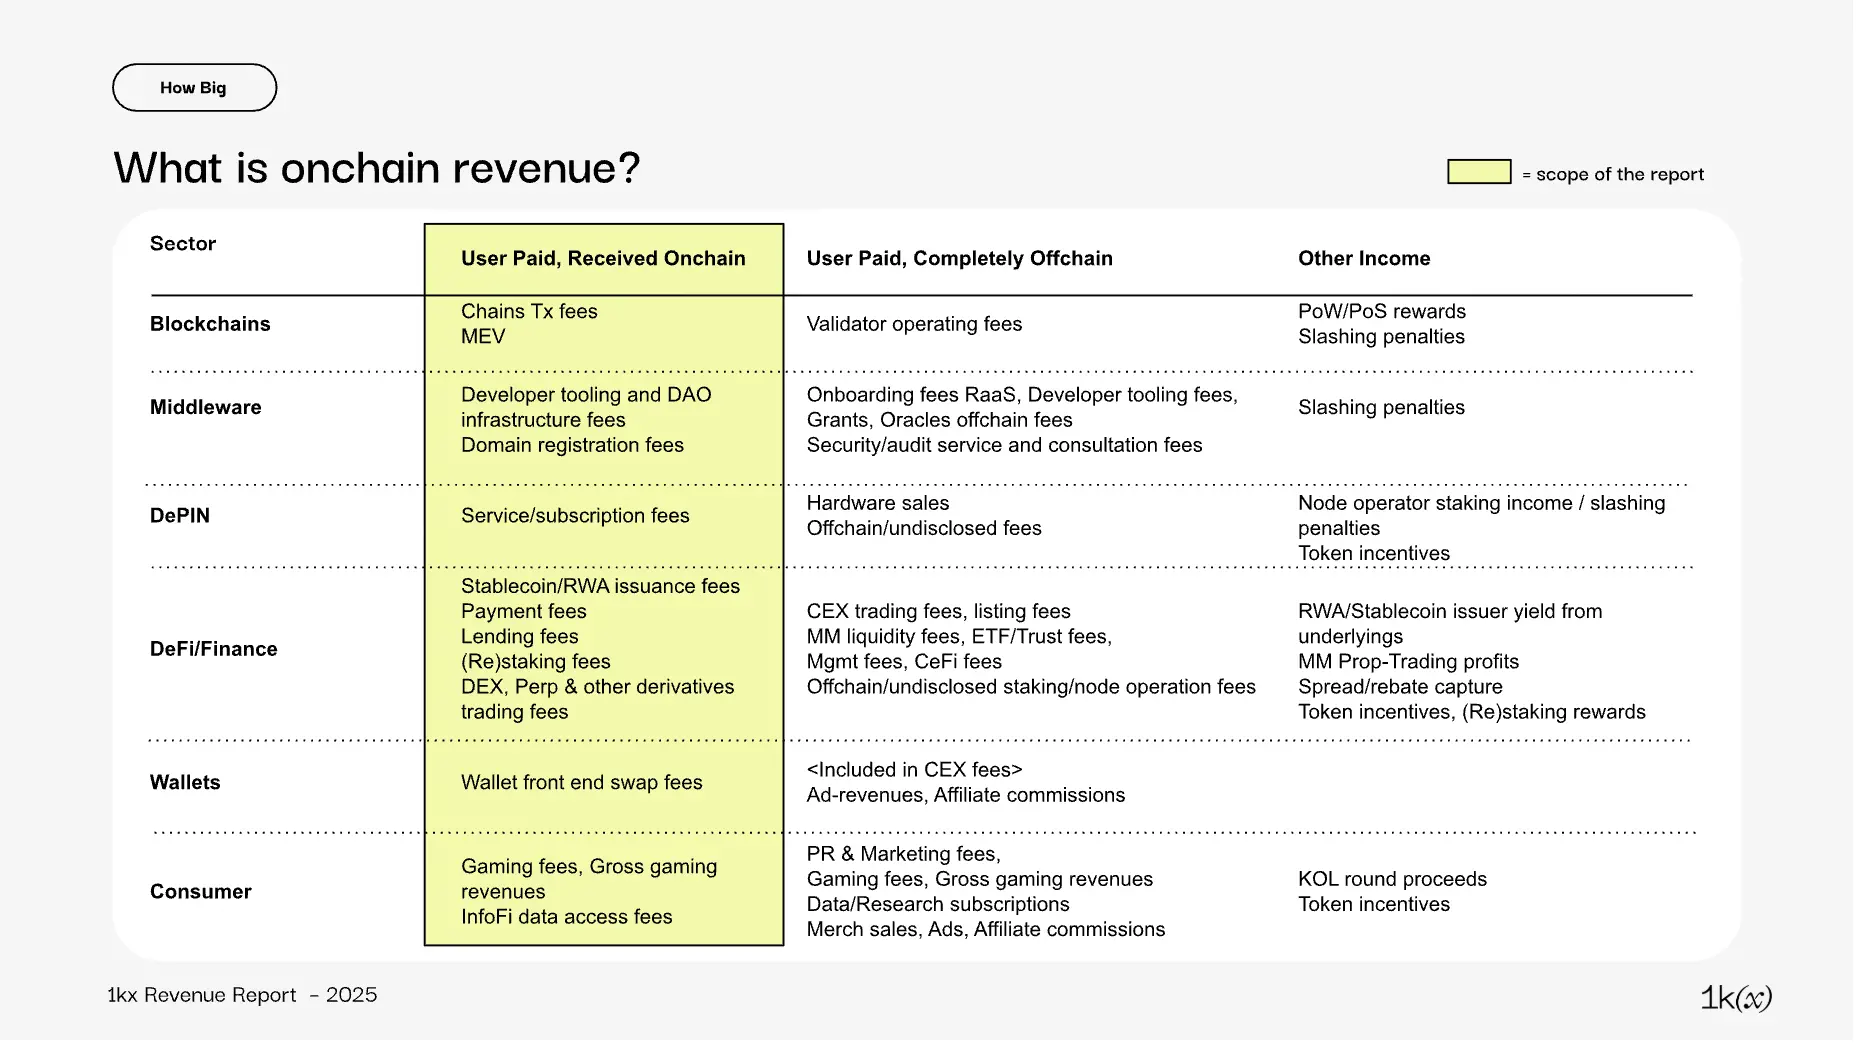
Scope: On-chain vs. Off-chain
This report primarily focuses on on-chain fees directly paid by users for services (such as transaction fees, trading fees). Therefore, it excludes:
- Off-chain fees with no transparent connection to on-chain activity (e.g., CEX trading fees, marketing, or consulting fees)
- Other revenues not directly paid by end-users related to the blockchain ecosystem (e.g., protocol rewards, staking yields, or interest income from reserve assets)
We focus on overall fee data, key trends, and underlying drivers. The value allocated to token holders or protocol treasuries is only briefly discussed. Profitability and cost structures are beyond the scope of this version and may be explored in future versions.
Protocol Classification and Definitions
Protocol classification references the frameworks of DeFiLlama, TokenTerminal, CoinGecko, and Messari, consolidated into six core areas:
- Blockchain (transaction settlement, such as L1 Bitcoin, L2 Base)
- Middleware (the infrastructure layer between blockchain and user-facing applications, such as Chainlink oracles)
- DePIN (networks providing decentralized physical infrastructure, such as storage, computing, or 5G coverage, like Helium)
- DeFi/Finance (providing financial services, such as Uniswap DEX, Aave lending markets)
- Wallets (user interfaces for managing digital assets, such as Metamask)
- Consumer (applications aimed at consumers, such as Axie-Infinity games or Opensea NFT markets)
In this report, "applications" refer to all non-blockchain categories, including middleware, DePIN, DeFi/Finance, wallets, and consumer sectors.
Data Sources
Data is sourced from analytical platforms like Dune, as well as aggregated data providers like TokenTerminal and DeFiLlama, tracking protocol-level financial metrics.
Our dataset covers 1,244 protocols, spanning from 2020 to Q3 2025 (inclusive). Protocol valuations are sourced from CoinGecko. While not the primary focus, we also provide high-level estimates and directional insights on off-chain fees and other revenues, using third-party reports and available data.
Terminology Explanation
Burn-Mint-Equilibrium: A self-balancing token model that continuously issues token rewards to contributors and burns tokens through user payments — economically similar to funding operations through equity issuance while offsetting dilution via share buybacks in a company.
CEX (Centralized Exchange): Such as Binance, Upbit — centralized businesses generate off-chain income, typically having balance sheets, management, and regulatory obligations — more akin to publicly listed financial institutions and traditional brokers or exchanges.
DePIN (Decentralized Physical Infrastructure Network): A physical economy network that uses blockchain to coordinate the deployment and management of physical or digital infrastructure provided by individuals or enterprises rather than a single corporate operator. Examples include: Helium (decentralized wireless and IoT networks), Render (distributed GPU computing), Filecoin (decentralized data storage), Aethir (cloud and edge computing infrastructure).
DEX (Decentralized Exchange): Such as Uniswap — a software-based market that monetizes through on-chain trading fees. CEXs hold customer assets and operate businesses like traditional stock exchanges; DEXs are the open-source code versions — no company, no custody, just software, charging fees each time a trader uses it.
Governance: The way decentralized networks make and enforce decisions: a shareholder-style system where token holders, rather than executives, vote to determine rules, fees, and resource allocation.
Meme Coin Launchpad: Platforms like Pump.fun automate the creation, listing, and initial liquidity of highly speculative community tokens based on jokes or cultural memes. Functionally, it is a fully on-chain, plug-and-play issuance platform — similar to retail IPOs or crowdfunding engines — charging fees through each issuance and transaction, rather than holding inventory or underwriting risk.
By monetizing retail speculation, similar to how brokers capture order flow revenue, launchpads make token creation a high-volume, low-margin business, processing thousands of issuances daily. Despite the fleeting nature of tokens, platforms like Pump.fun generate significant cash flow, with annual on-chain fees reaching hundreds of millions of dollars, benefiting from strong trading volumes and network effects.
Meme Coin Frenzy: Beginning in mid-2024 and continuing into early 2025, the crypto market experienced a dramatic surge in Meme tokens with no fundamental utility, based on jokes or cultural memes. Platforms like Pump.fun allow anyone to create and list Meme coins in minutes, especially on Solana, leading to an explosion of new issuances.
MEV (Maximal Extractable Value): The additional profit that validators (or block producers) can earn in a blockchain network by reordering, inserting, or excluding transactions before a block is finalized. Essentially, it is about extracting value from controlling the order of transactions — not changing the transactions themselves, but deciding when and in what order they occur. The closest traditional financial parallels include:
- High-frequency trading (HFT) latency arbitrage: Traders see orders milliseconds ahead of the market
- Broker-dealer internalization: Market makers internally execute customer orders, potentially reordering for profit
- Exchange specialist ledger control: Historically, specialists could match orders for their own benefit
The distinction: Validators in a blockchain have complete discretion over the order of transactions within a block, making these opportunities transparent (on-chain) and enforced by code.
Node Sales: Particularly a way to finance and allocate capacity in DePIN — investors purchase and operate nodes, earning network fees or tokens, similar to owning productive assets in a digital utility.
On-chain Fees: Fully recorded on the blockchain, identifiable by payers and receivers through wallets (e.g., fees paid by users to validators). See "Off-chain Fees" extended to buybacks.
Off-chain Fees: Occur outside the blockchain — such as credit card payments for DePIN services or in-game purchases. Some are later "on-chained" when protocols transfer fiat revenue or execute token buybacks, usually unverifiable, as it is unclear whether tokens are bought back from the market or from internal sources. We account for such income as on-chain fees unless explicitly non-market sources. Many businesses (especially CEXs and market makers) retain most of their income off-chain, with limited disclosure. Even if some holdings are in blockchain wallets, the lack of transparency effectively makes them off-chain. Some exchanges (like Binance, Gate, Bitget) link off-chain profits to on-chain token economics through buyback programs, but only token movements are visible, not the source of funds, making this mechanism still opaque and unverifiable.
Staking: The process of "locking" a certain amount of cryptocurrency to support the operation of a blockchain network, typically in proof-of-stake (PoS) systems. The rewards are periodic payouts, similar to earning interest or dividends, paid in the same cryptocurrency. Staking can be viewed as a mix of dividend stocks and performance bonds:
- Like holding stocks for dividends, you hold tokens and get paid for contributing to the system
- Like providing collateral or margin, if you or your validator fail to fulfill obligations, the stake can be forfeited
To some extent, it is also similar to bank term deposits — capital is locked for a certain period, earning yield compensation.
Tax Tokens: Blockchain tokens whose smart contracts automatically charge fees ("taxes") on each transaction involving that token. Fees are directly deducted and routed to a predefined wallet when transferred on-chain. They can be seen as securities with embedded automated transaction taxation — unlike in crypto, there are no clearinghouses or transfer agents executing deductions; the token code is built-in.
Token Burn: Permanently removing tokens from circulation by sending them to an inaccessible ("burn") address. Economically similar to the cancellation of shares after a stock buyback in traditional finance, reducing total supply, which may increase the value of remaining tokens if demand remains constant or grows.
Token Rewards/Incentives: Units of blockchain-native cryptocurrency (or other digital tokens) granted to participants for contributing to the network or interacting with the protocol. They take the form of incentive compensation, paid not in cash but in the protocol's own assets. Typically awarded to: validators/miners (securing the network, such as adding blocks, validating transactions), liquidity providers (providing assets to decentralized exchanges or lending pools), users/community members (adopting or promoting the platform, such as early user airdrops). The goal is to: kickstart new network activity (similar to startups offering equity options), reward ongoing contributions to maintain operations, and align incentives between the protocol and stakeholders. Token rewards can be viewed as a mix of: stock options or equity grants (entitling rights to network growth), physical dividends (non-cash payments, where the company/protocol issues more of its own shares/tokens), and loyalty program points (earned through participation, redeemable within the ecosystem (here, "points" are often tradable on public markets)).
Value Allocated to Token Holders: Reflects the net value attributable to token holders, similar to dividends or buybacks in traditional finance. Consistent with holder income from DeFiLlama, it represents the share of protocol revenue allocated to holders — typically through buybacks, burns, or rewards (often limited to active holders, such as stakers or governance participants).
It also adjusts for dilution, as some holder income accompanies new token emissions, potentially leading to negative net value. Since such dynamics are common in blockchain, early protocols, or designs (like Burn-Mint-Equilibrium), we only report positive net allocations when aggregating across protocols, consistent with how capital returns are handled in corporate finance.
免责声明:本文章仅代表作者个人观点,不代表本平台的立场和观点。本文章仅供信息分享,不构成对任何人的任何投资建议。用户与作者之间的任何争议,与本平台无关。如网页中刊载的文章或图片涉及侵权,请提供相关的权利证明和身份证明发送邮件到support@aicoin.com,本平台相关工作人员将会进行核查。