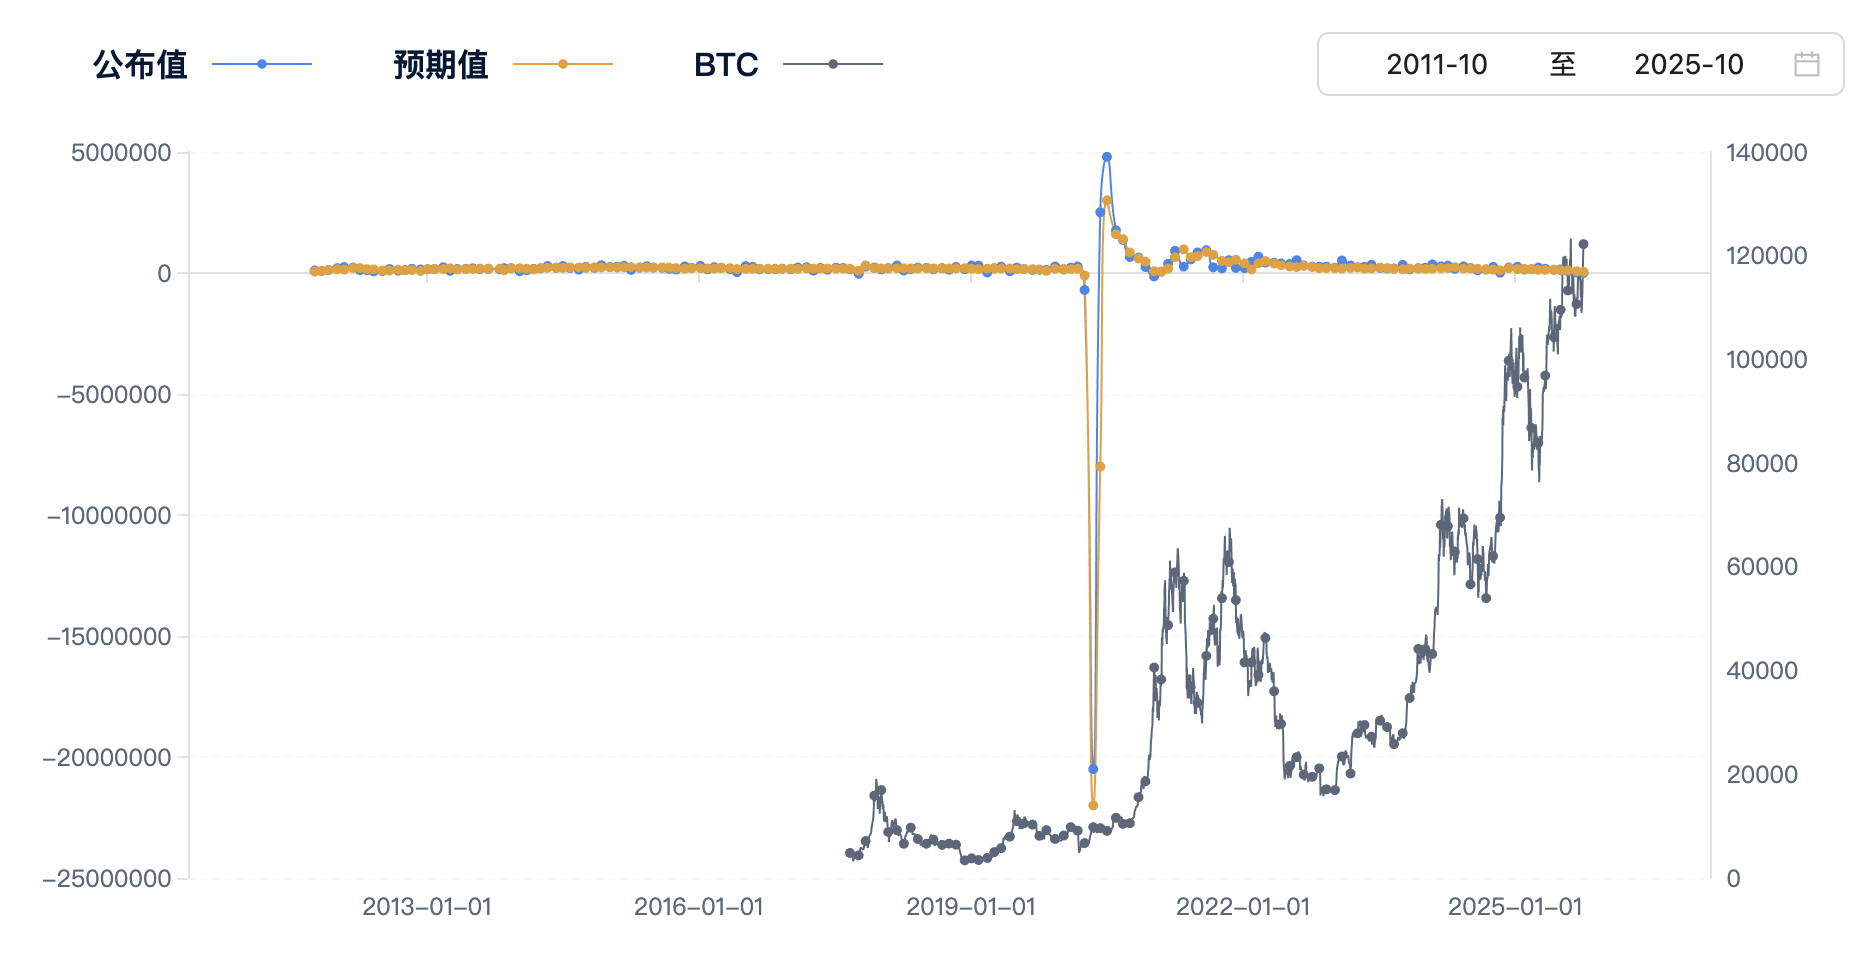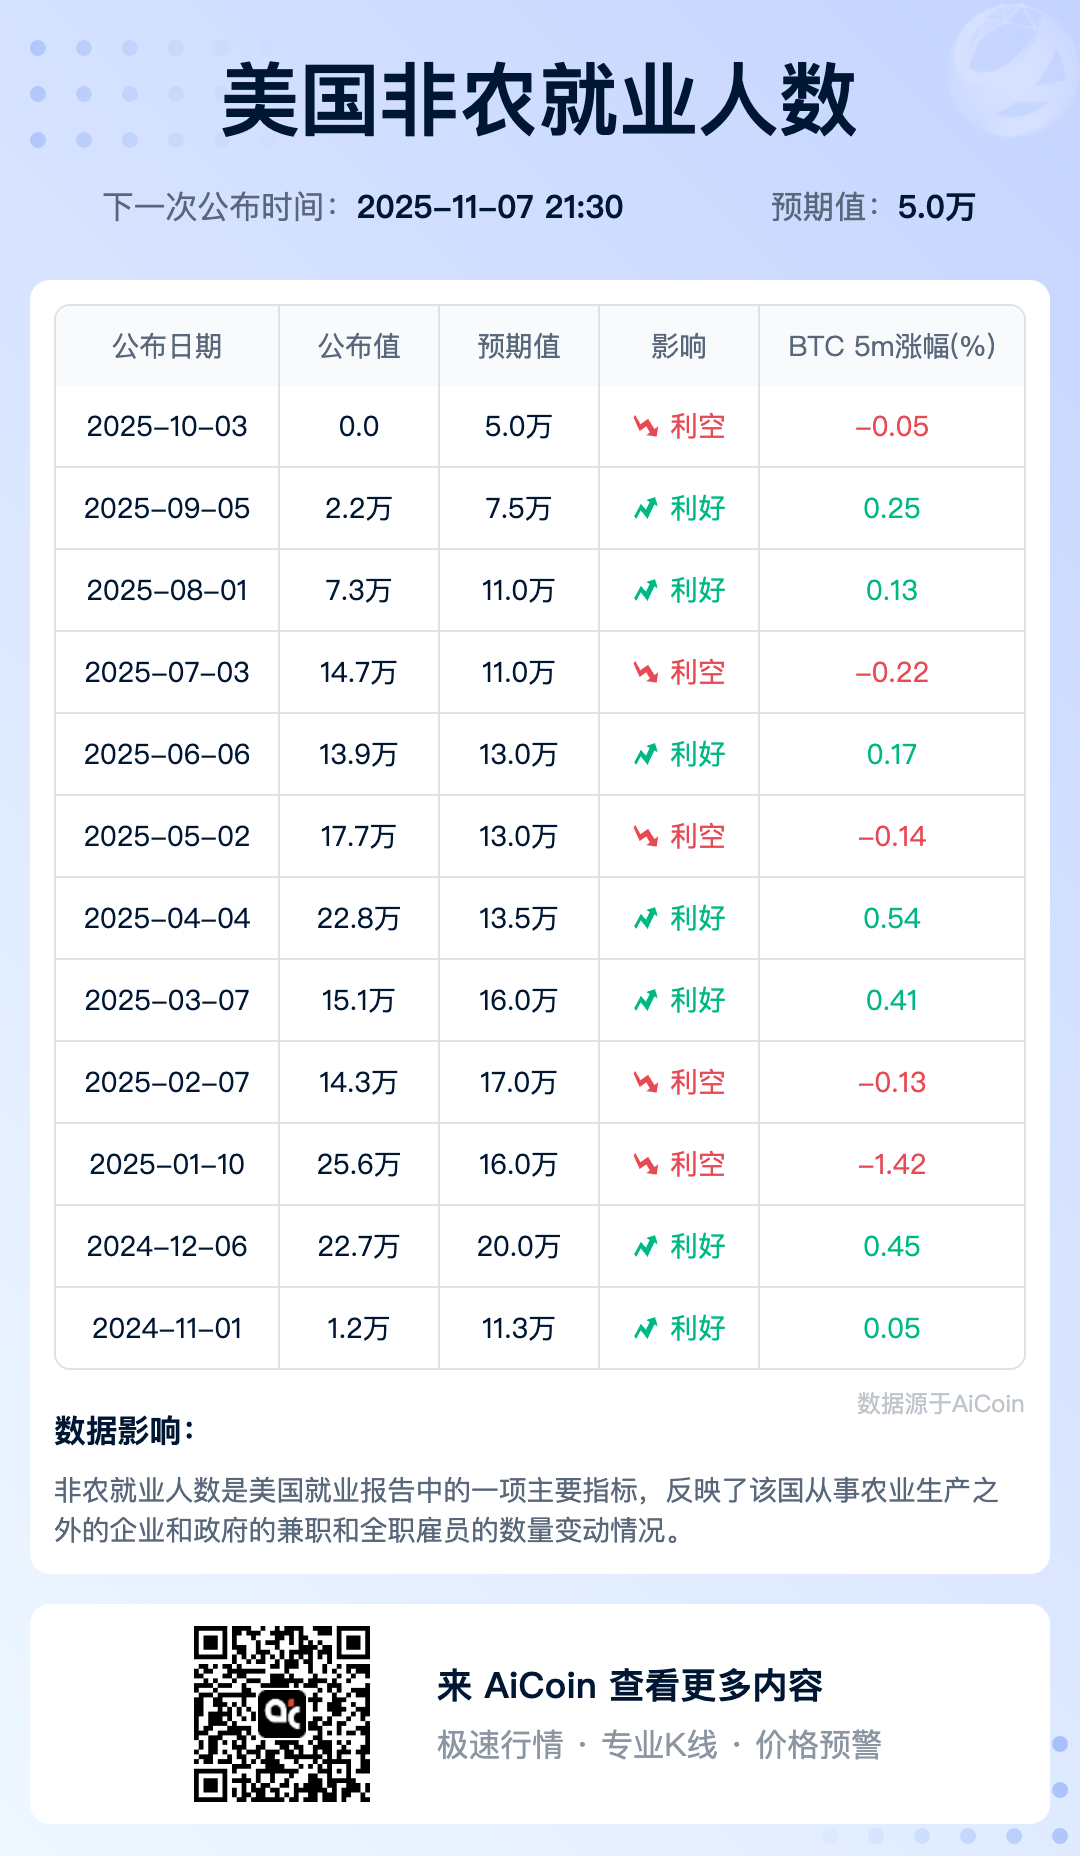
Understanding How Non-farm Data (NFP) Disturbs the Crypto Market: A Story About "Water"
Do you often see in the news "Non-farm data released, market fluctuates wildly," but feel confused? Why can a report about U.S. employment cause the prices of Bitcoin and Ethereum you hold to fluctuate like a roller coaster? In fact, there is a very intuitive logic behind this. We can imagine global capital as "water," and the entire financial world as a huge "reservoir system." Once you understand this system, you can see how non-farm data creates waves in the crypto market from across the ocean.
Chapter 1: Understanding Our "Global Capital Reservoir System"
First, let's draw a map:
1. Water: The globally investable money (capital). Its nature is to flow from places with low returns to places with high returns.
2. Main Reservoir: This is the safest and largest body of water, corresponding to the U.S. dollar and U.S. Treasury bonds. When global economic uncertainty arises, money flows here for shelter. The "water level" (return rate) here is relatively stable, serving as the benchmark for all investments.
3. Small Ponds: These are high-risk, high-potential return investment areas, such as tech stocks, emerging markets, and our main character—the crypto market. The water level (price) here changes dramatically, potentially skyrocketing overnight or drying up quickly.
4. The Administrator: The U.S. Federal Reserve (The Fed). Its job is to maintain system stability, with two core goals: promote employment and control inflation.
5. The Dam's Sluice Gate: The administrator's most critical tool—interest rates. By adjusting interest rates, the administrator can control the attractiveness of the "main reservoir."
Chapter 2: The Key "Thermometer"—Non-farm Data (NFP)
On the first Friday of every month, the U.S. releases an "employment report," known as non-farm data (NFP). It counts the number of new jobs added, excluding agriculture, and is regarded as the most timely "health check" of the U.S. economy. In our analogy, the NFP is the core thermometer inserted next to the "main reservoir."
High reading (e.g., 300,000 new jobs): The economy is "overheating," companies are hiring extensively, and wages may rise quickly.
Low reading (e.g., new jobs far below expectations): The economy is "overcooling," with recession risks.
The "administrator," the Federal Reserve, is very concerned about this thermometer. Because an overheating economy can lead to "reservoir evaporation"—that is, inflation, making money less valuable. This is something the Fed cannot tolerate.
Chapter 3: The Complete Transmission Chain—From Data to Price
Now, let's connect the various links and see how "water" flows.
Scenario 1: Strong Non-farm Data (Economy Overheating)
1. Thermometer Alarm: NFP data far exceeds expectations, especially with rapid wage growth.
2. Administrator Action: The Fed worries about uncontrolled inflation (evaporation) and decides to take "hawkish" action—"raise the dam's sluice gate," i.e., increase interest rates.
3. Water Flow Reversal: After the rate hike, putting money in the "main reservoir" (buying U.S. Treasuries, depositing in banks) becomes very attractive (risk-free return rate increases). Thus, global "water" begins to withdraw from various high-risk "small ponds" (like the crypto market) and flows back to the safe "main reservoir."
4. Water Level Change: The water in the crypto market "small pond" is significantly drawn out, leading to a drop in water level, i.e., asset prices fall.
Scenario 2: Weak Non-farm Data (Economy Overcooling)
1. Thermometer Cooling: NFP data is poor, and unemployment rises.
2. Administrator Action: The Fed worries about economic recession and turns to "dovish"—"lower the dam's sluice gate," i.e., cut interest rates or signal a rate cut.
3. Water Flooding: After the rate cut, the return rate of the "main reservoir" becomes extremely low. Money, seeking higher returns, is forced to overflow and rush into various "small ponds."
4. Water Level Change: A large influx of capital into the crypto market increases buying pressure, pushing the "water level" up, i.e., asset prices rise.
Chapter 4: The Complexity of Reality: Why Sometimes It Can Be "Abnormal"?
The usual logic is:
Good Data → Rate Hike Expectations → Negative for Crypto Market;
Bad Data → Rate Cut Expectations → Positive for Crypto Market.
But the market is not always that simple, as mentioned in the second link: sometimes non-farm data is good, yet Bitcoin rises instead.
There may be deeper reasons behind this:
1. The "Quality" of Data: The market will scrutinize the details of the data. If job growth is concentrated in a few sectors (like government temp jobs), while the real economy sectors are shrinking, the market may doubt the true health of the economy, thus weakening the urgency for a rate hike.
2. Long-term Narrative: If the market firmly believes that the Fed will eventually cut rates (for example, due to excessive government debt pressure), then a single month's good data may not be able to overturn long-term easing expectations.
3. The Changing Role of Bitcoin: More and more institutional investors view Bitcoin as "digital gold," used to hedge against U.S. dollar credit risk. When the market doubts the credibility of economic structure or policy, regardless of whether the data is good or bad, Bitcoin may attract capital inflows due to its "safe-haven asset" properties.
Conclusion
Now, you have mastered the core framework for analyzing the impact of non-farm data: Non-farm data → Influences Fed rate hike/cut expectations → Changes global capital flow → Ultimately determines the price trend of the crypto market.
Next time you see non-farm data released, you need not panic. Just ask yourself three questions:
Is this data "hot" or "cold"?
Is the Fed more likely to "tighten" or "loosen" next?
Will money prefer to stay in the "main reservoir" or flow to "small ponds"?
By clarifying these points, you can make a basic judgment about market trends, growing from a novice swayed by price fluctuations into a rational investor who understands the underlying logic.
Click the web page to view data sources:
https://www.aicoin.com/zh-Hans/data/npe
(This article's data comes from public market information and does not constitute investment advice. The market has risks; decisions should be made cautiously.)

Join the community for more insider news
Official Telegram community: t.me/aicoincn
AiCoin Chinese Twitter: https://x.com/AiCoinzh
Group chat - Wealth Group:
https://www.aicoin.com/link/chat?cid=10013
免责声明:本文章仅代表作者个人观点,不代表本平台的立场和观点。本文章仅供信息分享,不构成对任何人的任何投资建议。用户与作者之间的任何争议,与本平台无关。如网页中刊载的文章或图片涉及侵权,请提供相关的权利证明和身份证明发送邮件到support@aicoin.com,本平台相关工作人员将会进行核查。


