Yesterday we mentioned the need to be cautious of a continuous downward trend. Today, we see a drop of two points, and our expectations from yesterday have been realized. Currently, the market has broken key levels, and we will continue to look bearish. However, the decline will not be smooth and may be accompanied by fluctuations, so everyone must manage their positions well. Meanwhile, our short positions are also profitable.

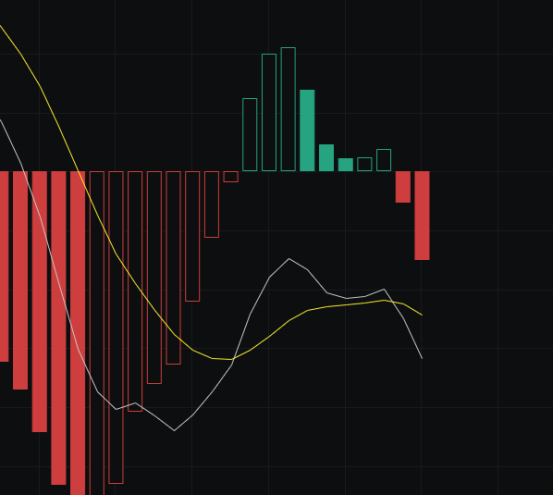
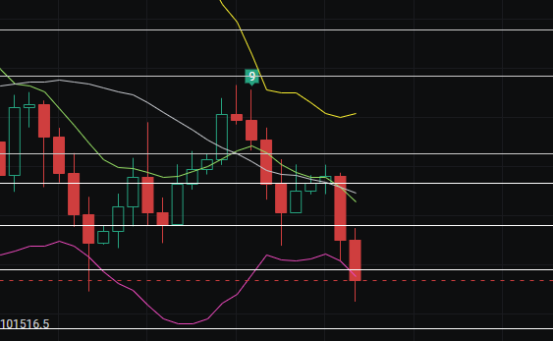
From the MACD perspective, we noted yesterday that the selling volume was insufficient for a sustained decline. To maintain the downward trend, we need to see continued drops today. Currently, the market is indeed declining, which aligns with our expectations.
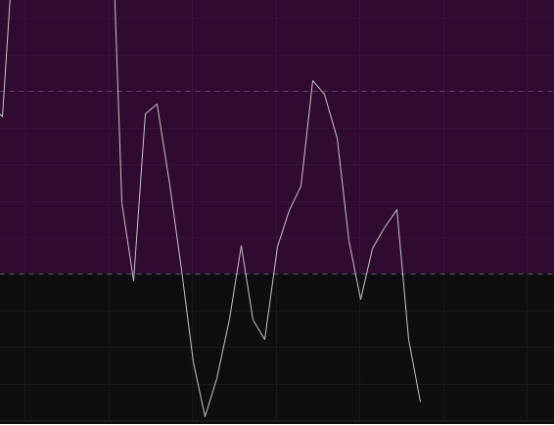
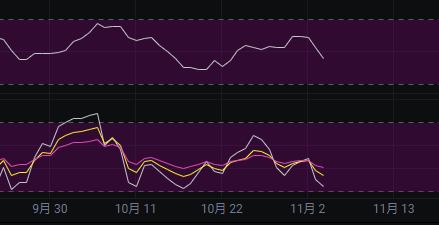
Looking at the CCI, it has moved far from the zero line and is unlikely to return to it in the short term, so we will continue to maintain a bearish mindset here.
From the OBV perspective, we also mentioned yesterday that the outflow was not significant enough. To maintain a bearish outlook, we need to see continuous declines today. Currently, the OBV is showing a continuous outflow as we speculated yesterday, with the market closing in the red.
Regarding the KDJ, during the last wave of decline, we said the KDJ should aim for 20, but it stopped at 30. This time, it has reached around 24, which fulfills our target for the KDJ. The next step is to see whether the KDJ will stop falling near 20 or continue to decline.
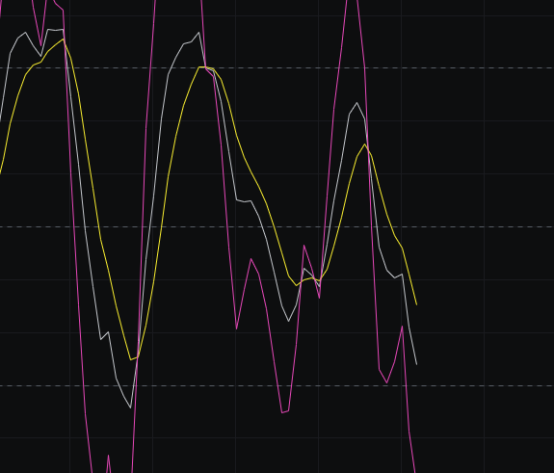
From the MFI and RSI perspectives, we mentioned yesterday that we needed to see a continuous trend for both indicators to synchronize. Currently, after two consecutive days of decline, both indicators have indeed synchronized, so we will continue to look bearish.
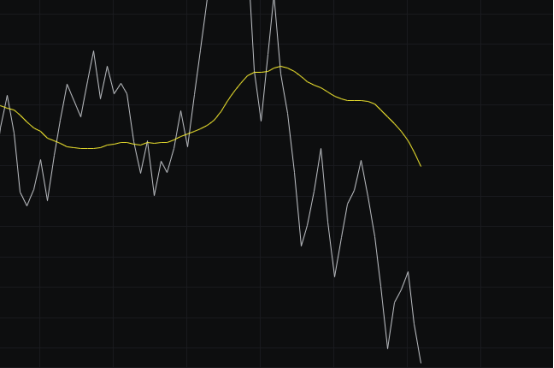
Looking at the moving averages, the 30-day average continues to press down. We previously mentioned watching for the 120-day average to turn downward, and there are signs of that now. Although the downward pressure is not obvious, it has at least started. As long as we continue to see bearish candles, the 120-day average will confirm the downward pressure.
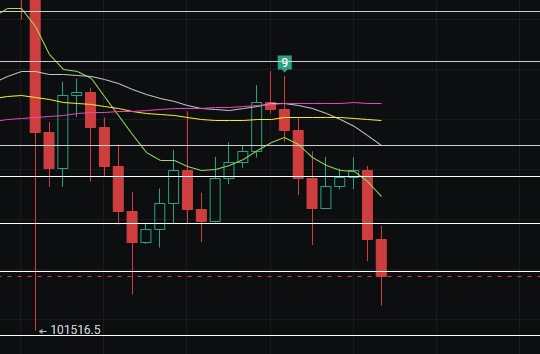
From the Bollinger Bands perspective, we noted yesterday that the bands were operating within a narrow range. To end this narrow range, the price needed to hit the lower band. Today, the price has reached the lower band, and the Bollinger Bands have opened up, officially ending the narrow trend, which is within our expected range.
In summary: The market movements over the past few days align with our expectations. Currently, the price has broken key levels, so we will continue to look bearish. Today's resistance is seen at 106,000-107,500, and support is at 101,500-100,000.
免责声明:本文章仅代表作者个人观点,不代表本平台的立场和观点。本文章仅供信息分享,不构成对任何人的任何投资建议。用户与作者之间的任何争议,与本平台无关。如网页中刊载的文章或图片涉及侵权,请提供相关的权利证明和身份证明发送邮件到support@aicoin.com,本平台相关工作人员将会进行核查。