Author: SoSoValue Community Researcher ET (Agarwood Capital)
1. Introduction
While investors are still searching for emotional and technical explanations for Bitcoin's decline, the real answer has quietly been written into the ledgers of the U.S. financial system: U.S. dollar liquidity is undergoing a structural tightening. This is specifically manifested in:
- The Treasury's TGA account balance is nearing $1 trillion, significantly absorbing market liquidity;
- Short-term funding market pressures have surged, with the SOFR–FDTR spread widening to +30bp at one point;
- The Federal Reserve has been forced to restart temporary repurchase operations (Overnight Repo), injecting nearly $30 billion in liquidity into the market—this is the first occurrence since the repo crisis in 2019.
This liquidity "vacuum" is not coincidental; it is fundamentally caused by the government shutdown. The Treasury has preemptively "sucked up funds" amid budget deadlock and potential government shutdown risks, locking cash into the TGA account through extensive bond issuance, directly withdrawing reserves from the banking system. The available "market dollars" are decreasing, putting pressure on risk assets—Bitcoin has become the earliest and most sensitive victim.
However, the script is not entirely pessimistic. Historical experience shows that every time the Treasury replenishes its inventory and liquidity is extremely tight, it often signals the approach of a reversal.
As of November 5, the number of days the U.S. government has been shut down has reached a historical peak, with pressures on finance, the economy, and people's livelihoods sharply accumulating. SNAP food assistance is restricted, some airport security checks and federal air traffic control services have been temporarily suspended, and public and business confidence is declining. Against this backdrop, there are signs of easing in the bipartisan standoff, especially as U.S. stocks have recently corrected from their highs, which will help accelerate the resolution of the government shutdown issue.
The market expects that the Senate may push for a compromise plan before the Thanksgiving recess on November 15, ending the government shutdown. At that time, the Treasury will restart spending, and the TGA balance is expected to decline from its high, liquidity will return, and risk appetite will rebound. Bitcoin may be in the "final drop" phase of this adjustment—at the intersection of fiscal spending recovery and the onset of future interest rate cuts, a new liquidity cycle will also restart.
2. BTC Facing U.S. Dollar Liquidity Shock
As a non-yielding asset, BTC is very sensitive to liquidity, and tight U.S. dollar liquidity often puts downward pressure on BTC. This is one of the reasons for BTC's notable weakness since mid-October, especially against the backdrop of the Nasdaq reaching historical highs.
As shown in Figure 1, as of October 31:
- The SOFR–FDTR spread turned positive, peaking at +30bp → The true cost of interbank funds is higher than the upper limit of the policy interest rate, indicating that banks are borrowing at a higher cost, reflecting tight liquidity;
- RRP balances have risen to $50.3 billion → The market is once again seeking collateral liquidity from the Fed;
Figure 1: SOFR–FDTR Spread and RRP Balance
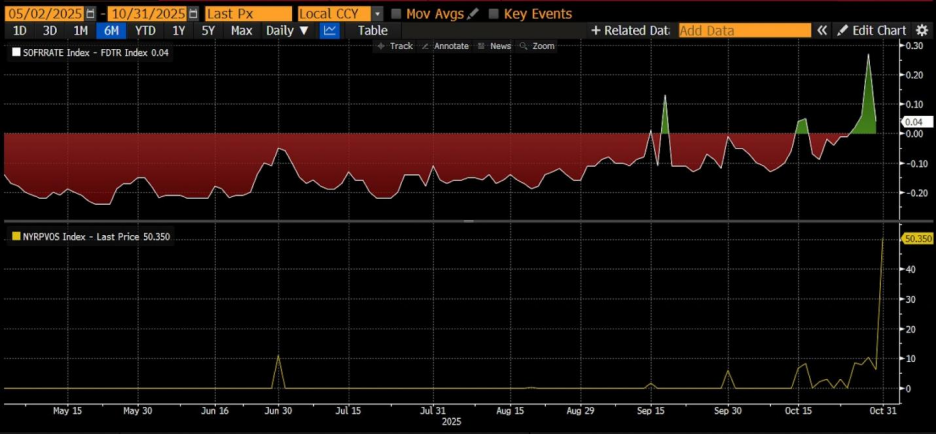
This indicates that there are clear signs of tension in the U.S. short-term funding market, forcing the Federal Reserve to restart temporary repurchase operations (Overnight Repo Operations), injecting nearly $30 billion in liquidity into the market on October 31.
This is the first occurrence of such operations since the 2019 repo crisis, marking a shift of liquidity shortage from a temporary phenomenon to a structural issue.
Overall, while macro monetary supply (M2) remains loose, the safety cushion of reserves in the banking system is being rapidly depleted, and the upward trend in market borrowing rates indicates that liquidity pressure is no longer just an expectation but a current reality.
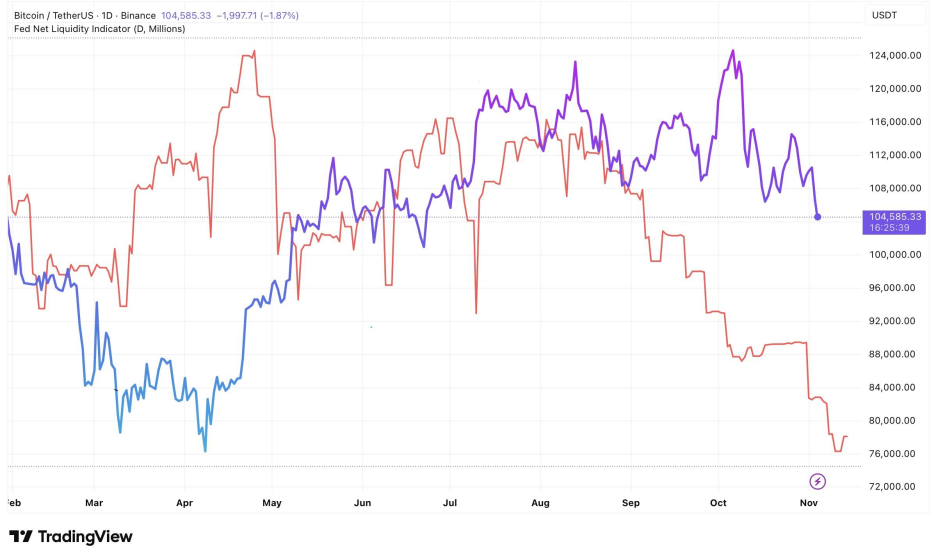
Therefore, subsequent observations of liquidity conditions are an important reference for judging BTC price trends.
Figure 2: BTC Price and Federal Reserve Liquidity
3. Breakdown of U.S. Dollar Liquidity
U.S. dollar liquidity = Bank Reserves + Currency in Circulation = Total Size of the Federal Reserve's Balance Sheet − ON RRP (Overnight Reverse Repo) − Treasury's TGA Account
This is the core framework for observing the "disposable dollar balance in the U.S. financial system." It reveals:
Total U.S. dollar liquidity = The Federal Reserve's "supply side" - The Treasury and money market's "absorption side."
The specific components are as follows:
Components
Description
Impact on Liquidity
Bank Reserves (Reserves)
The deposit balance of commercial banks at the Federal Reserve, the most direct liquidity within the system.
Increase → Liquidity loosens
Currency in Circulation
Cash held by businesses and individuals.
Generally stable growth, with small short-term fluctuations
ON RRP (Overnight Reverse Repo)
A short-term tool where money market funds "lend" money to the Federal Reserve, effectively "absorbing" liquidity.
Increase → Liquidity tightens
TGA (Treasury General Account)
The Treasury's main account at the Federal Reserve for government revenue and expenditure. An increase in TGA means the Treasury is "absorbing" market liquidity.
Increase → Liquidity tightens
1. Logical Relationship
This formula essentially describes the flow of funds between the Federal Reserve, the Treasury, and the money market:
Federal Reserve expands balance sheet → Increases reserves and cash → Liquidity increases, such as during QE (Quantitative Easing) when the Federal Reserve purchases assets to increase bank reserves.
TGA rises → Treasury issues bonds to absorb funds → Liquidity decreases when the government increases bond issuance and tax revenue flows into TGA, market funds are "sucked away."
ON RRP rises → Money market funds deposit idle cash into the Fed → Liquidity decreases, equivalent to money funds "parking" market funds at the Fed, no longer circulating in the banking system.
Therefore:
Liquidity ↑ = Fed Assets ↑ + TGA ↓ + RRP ↓
2. Practical Application
This indicator is key to observing the liquidity cycle of risk assets:
When TGA + RRP both decline → Bank reserves surge → U.S. dollar liquidity loosens → Typically accompanied by rising risk assets (stock market, Bitcoin).
When TGA is replenished and RRP rises → Liquidity is withdrawn → Risk assets come under pressure.
Specific examples:
In the second half of 2023: After the debt ceiling was lifted, TGA was replenished → Liquidity briefly tightened → U.S. stocks and crypto assets experienced volatility.
In early 2024: RRP rapidly declines, funds flow back to banks → Reserves rise → Market risk appetite increases.
3. Extended Observation: Connection with the Market
Indicator
Correlation
Description
S&P 500 / NASDAQ
Positive correlation
Liquidity loosening drives valuation expansion
Bitcoin BTC
Highly positively correlated
Risk appetite rises when liquidity is loose
U.S. Dollar Index DXY
Negative correlation
When liquidity loosens, dollar supply increases, and the index weakens
U.S. Treasury Yield
Depends on the phase
QE phase suppresses yields; QT phase raises yields
4. Conclusion
This formula essentially represents the liquidity balance equation of the entire U.S. dollar system.
The Federal Reserve determines the "total supply."
TGA and ON RRP are two "liquidity valves" that determine how much money can flow into the financial market.
Therefore, when analyzing the trends of risk assets, it is more important to observe the changes in RRP + TGA than to look solely at the Federal Reserve's balance sheet, as they are the true drivers of short-term U.S. dollar liquidity.
4. Recent Reasons for Liquidity Tightening—TGA Continues to Absorb Funds
Figure 3: Changes in the U.S. Treasury's TGA Account Balance
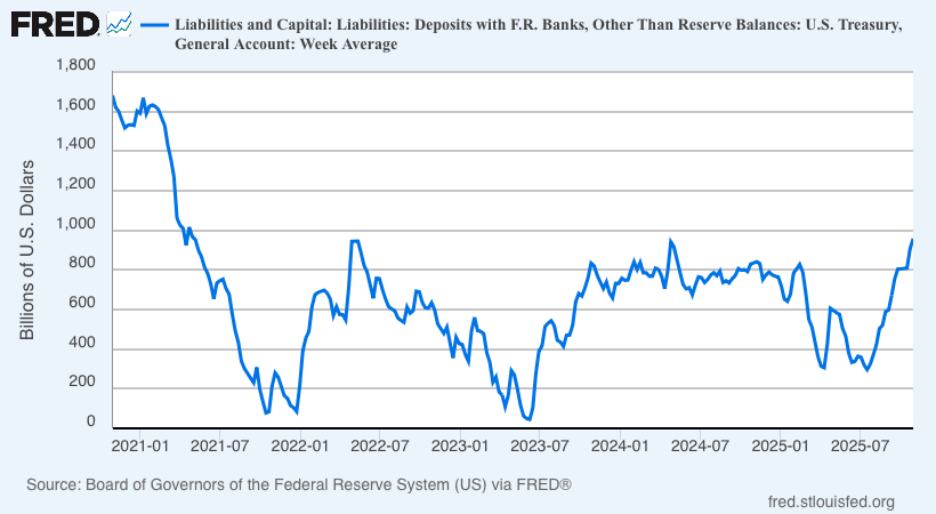
1. Indicator Interpretation
The above figure shows the balance of the U.S. Treasury's main account at the Federal Reserve, the TGA (Treasury General Account). The horizontal axis represents time (2021–2025), and the vertical axis represents the amount (in billions of dollars). This line reflects the Treasury's absorption or release of liquidity and is an important adjustment valve for U.S. dollar liquidity. Below is a complete professional interpretation combining recent government shutdown risks and fiscal operations.
The fluctuations of this line represent the Treasury "absorbing funds from the market (TGA rising)" or "releasing funds to the market (TGA declining)."
TGA rising → Government absorbs market liquidity (bank reserves decrease)
TGA declining → Government releases market liquidity (bank reserves increase)
Therefore:
TGA ≈ An inverse indicator of market dollar liquidity
When TGA rises, market funds tighten; when TGA declines, market funds loosen.
Combining time and events: The liquidity rhythm from 2021 to 2025
Time Period
TGA Change Characteristics
Background Events and Liquidity Impact
2021 Q1–Q3
Continued decline (from 1.6 trillion to 0.2 trillion)
The Biden administration pushed for large-scale fiscal stimulus, high Treasury spending, and TGA consumption; U.S. dollar liquidity was extremely loose, driving up the stock and crypto markets.
First half of 2022
TGA rapidly rose to ~800 billion
The Treasury replenished inventory to address ceiling risks; at the same time, the Fed initiated QT, tightening liquidity, leading to weakness in U.S. stocks and crypto markets.
First half of 2023
TGA plummeted to ~100 billion
The U.S. debt ceiling crisis led the Treasury to suspend bond issuance and use cash for expenditures; liquidity was temporarily released significantly (bank reserves increased), and Bitcoin rose from 16K to 30K.
After summer 2023
TGA significantly replenished (from 100 billion to over 700 billion)
After the debt limit agreement, a large amount of bond issuance rebuilt TGA, absorbing liquidity; during the same period, U.S. stocks fluctuated, and bond market yields rose.
Throughout 2024
Moderate fluctuations between 400 and 800 billion
Budget negotiations are repeated, with some shutdown threats; the Treasury adopts "dynamic inventory management," affecting short-term interest rates and liquidity.
From early 2025 to now
Rapid rise (approaching 1 trillion again)
The government is making preventive reserves for new fiscal year spending and potential shutdowns; TGA replenishment tightens liquidity again.
2. Structural Linkage with "Government Shutdown"
Before the shutdown: The Treasury raises TGA for emergency preparedness
When the congressional budget deadlock approaches and shutdown risks rise, the Treasury will preemptively issue bonds to raise funds, increasing the TGA balance to ensure there is still cash for essential expenditures during the government shutdown.
During this phase, the market will experience short-term liquidity tightening and rising short-term interest rates.
During the shutdown: Expenditures paused, bond issuance limited
During the shutdown, some government payments are paused, and the TGA level remains flat or slightly declines in the short term. However, due to the lack of new Treasury bond supply in the market, demand from money market funds surges towards ON RRP.
This creates a "structural liquidity mismatch": overall neutral but tight on the short end.
After the shutdown ends: Replenishment of funds, resumption of salaries → TGA plummets.
After the government resumes spending, the TGA will decline, and liquidity will be instantly released. Bank reserves will rise, and pressure in the repo market will ease, often leading to a rebound in risk assets during this phase.
For example, after the debt ceiling was lifted in 2023, BTC surged in the short term, and the Nasdaq rebounded.
5. The Federal Reserve in Action: Liquidity Injection
Figure 4: Federal Reserve ON RPs (Overnight Reverse Repo)

1. Indicator Interpretation
Source: FRED (New York Fed)
Latest data (October 31, 2025): $29.4 billion
Reference comparison: The peak in September 2019 was $49.75 billion.
This indicator represents the Federal Reserve providing overnight cash to primary dealers through temporary repurchase operations (collateralized by U.S. Treasuries), serving as a direct liquidity injection method.
This tool has been out of use for a long time since the pandemic, and its reactivation carries significant policy signal implications.
2. Three Key Observations
Policy Background: The Federal Reserve's action is a response to the "real shortage" in the short-term funding market. Although QT is set to stop, the continuous decline in reserves has intensified borrowing pressures. The restart of ON RPs signifies: "The Federal Reserve is shifting from passive balance sheet reduction to active liquidity management."
Scale Characteristics: While $29.4 billion is lower than the crisis level of 2019, its symbolic significance is strong, indicating that the liquidity gap has surpassed the Fed's observation threshold. If the scale of operations continues to rise in the next two weeks, it can be seen as a "quasi-policy shift."
Market Mechanism:
Banks and money market funds are forced to raise financing rates due to reserve shortages;
The Federal Reserve releases liquidity through repos, temporarily lowering the SOFR and repo spread;
If this behavior continues, it will create a "mini QE effect."
3. Historical Comparison: 2019 vs. 2025
Indicator
2019 Repo Crisis
October 2025 Event
Triggering Factors
Treasury settlements + RRP exhaustion
Treasury settlements + QT leading to reserve depletion
SOFR–FDTR Spread
+30bp
+30bp
Fed Repo Scale
$49.7 billion
$29.4 billion
Policy Response
Term Repo + QE restart
ON Repo + Observing
Outcome
Reserve rebuilding + QE4 initiation
Pending observation, or gradual liquidity replenishment
6. Conclusion
The current TGA account is close to $1 trillion, which is the main reason for recent liquidity tightness. As the government reopens and spending restarts, the TGA will decline, and U.S. dollar liquidity will recover, providing support for risk assets like BTC;
Before the government reopens, the Federal Reserve will continue to release liquidity through repos, temporarily lowering the SOFR and repo spread to alleviate market liquidity tightness;
Prediction websites are betting real money on mid-November, specifically between November 10 and November 15, with institutions like Goldman Sachs expecting the government to reopen within two weeks;
Therefore, BTC is likely undergoing a "final drop," as the government reopening and future interest rate cuts are certain, although the timing may have uncertainties.
免责声明:本文章仅代表作者个人观点,不代表本平台的立场和观点。本文章仅供信息分享,不构成对任何人的任何投资建议。用户与作者之间的任何争议,与本平台无关。如网页中刊载的文章或图片涉及侵权,请提供相关的权利证明和身份证明发送邮件到support@aicoin.com,本平台相关工作人员将会进行核查。