Written by: Tuo Luo Finance
At the beginning of November, the market released negative signals.
In recent days, the global financial market, including cryptocurrencies, has experienced a bloodbath. On November 5, U.S. stocks faced a "Black Tuesday," leading to a sharp decline in Asian stock markets, with the South Korean KOSPI index even triggering a circuit breaker. Cryptocurrencies were not spared either, with Bitcoin briefly falling below $100,000 yesterday, and ETH touching $3,000.
This sudden plunge has occurred more than once in recent months, and even with today's market recovery, one cannot help but wonder if the market has reached the boundary between bull and bear.
Tracing back to the root cause, the decline is still related to liquidity. But the question is, how long will it continue to fall? And to what extent?
Let's return to the biggest external event: the U.S. government shutdown. As of the time of writing, the U.S. government shutdown has lasted for 37 days, breaking the previous record of 35 days from late 2018 to early 2019, making it the longest government shutdown in U.S. history.
While shutdowns are a common tactic in the power struggle between the two parties, a shutdown lasting this long has had an indelible impact on the market. The shutdown directly leads to delays in government salaries and contract payments, making it difficult for government employees to receive income, and regulatory agencies are operating at "low cost." This not only means that regulatory matters are stalled, but the negative effects continue to spread to major areas of public life such as transportation, travel, healthcare, and public health, paralyzing public services and transmitting through cash flow to the macro consumption market, impacting the retail market. Notably, the Supplemental Nutrition Assistance Program, which provides food stamps to impoverished Americans, has been suspended for the first time during this shutdown, adversely affecting social stability in the U.S.
On the other hand, the shutdown serves as a political signal; the power struggle between the two parties intensifies, increasing uncertainty in policy execution. The shutdown also means a blockade of economic data, and the lack of information can amplify emotional signals, leading to increased volatility while capital tends to seek safety, further causing fluctuations in risk markets.
More critically, the shutdown means that the U.S. Treasury cannot inject liquidity into the market, but rather siphons it away. The Treasury General Account (TGA) of U.S. stocks is a concentrated reflection of government revenue and expenditure, where the government collects taxes and debt sales, and then allocates funds to the market through the TGA. This entire process is a crucial vehicle for maintaining market liquidity. The shutdown interrupts this cycle, causing the government to continuously absorb revenue but only for internal maintenance, making it difficult to release funds to the external market, ultimately becoming a "liquidity dam." Data shows that as of last Friday, the balance of the Treasury General Account (TGA) has surpassed $1 trillion for the first time, reaching a nearly five-year high since April 2021, indicating that the Treasury has siphoned off over $700 billion in cash from the market in the past three months, with more than $140 billion siphoned off during the 37 days of the shutdown. In other words, the effect of the shutdown can be described as a "de facto interest rate hike."
The exhaustion of liquidity can also be reflected in market signals. The Secured Overnight Financing Rate (SOFR) is the cost for financial institutions to break down overnight funds using Treasury bonds as collateral, typically close to the Federal Reserve's excess reserves. In the past month, although this rate has decreased due to interest rate cuts, the basis between it and the Federal Reserve's excess reserves has continued to widen. On October 31, SOFR surged 18 basis points to 4.22%, with the basis reaching 32 basis points at one point, the highest since March 2020, reflecting that the actual borrowing costs in the market have risen instead of falling.

Additionally, the Federal Reserve's reserves have fallen to $2.85 trillion, while the usage of the Federal Reserve's Standing Repo Facility (SRF), established to address short-term liquidity pressures, reached a historical high of $50.35 billion last Friday, signaling ongoing liquidity tightness.
In this context, the global financial market is on edge, with any slight change in information leading to significant volatility. Just seven days ago, Powell displayed a hawkish stance, stating that "further cuts to the policy rate at the December meeting are not a foregone conclusion," which made the market even more vigilant. After the Senate's 14th rejection of the Republican-led temporary funding bill on November 5, the global market faced a bloodbath.
Turning to the cryptocurrency market, the liquidity issue becomes even more complex and prominent. Macroeconomic issues bring systemic impacts, but for risk assets, there are also relative pricing issues. Looking at the financial market growth this year, the assertion that trading cryptocurrencies is less profitable than trading stocks and gold is not unfounded. If we take the price on January 1 as a baseline, as of now, Bitcoin has grown by 9.6%, ETH by 2.7%, while the S&P 500 has grown by 15.55%, and the Nasdaq index has risen by 21.88%. Gold has seen a massive increase this year, with international gold prices rising by about 50%. In comparison, trading cryptocurrencies has become the category with the lowest returns. From a fundamental perspective, while cryptocurrencies have benefited from regulatory advantages, they are difficult to sustain, whereas the stock market still has the AI sector providing support, and gold has surged due to its safe-haven role. From an allocation perspective, it is understandable that liquidity flows into the stock market and gold, but this has also led to a further loss of liquidity in the cryptocurrency market.
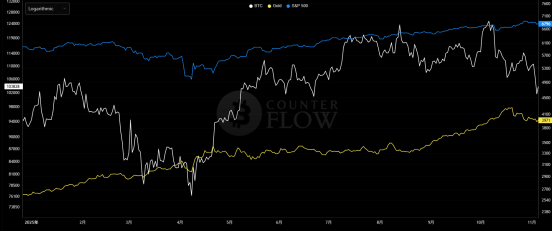
This year's price trends of the S&P 500, gold, and Bitcoin, source: Counterflow
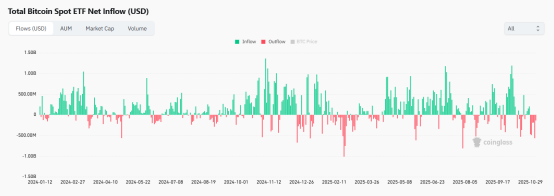
From the ETF perspective, institutional outflow intentions are quite strong. Bitcoin spot ETFs have seen continuous outflows for five days since October 29, with a total outflow amount reaching $1.914 billion, while Ethereum spot ETFs showed similar performance, with $719 million flowing out over five days. Meanwhile, the DAT sector is clearly retreating; after Strategy released its earnings report, analysts from three investment banks—Cantor Fitzgerald, TD Cowen, and Maxim Group—lowered their target prices for the stock, bringing its average target price to the lowest level since May this year. Companies outside the top tier of DAT are also feeling the chill, with even some listed companies selling off coins to recover funds.
Worse still, the "10.11" crash nearly drained all liquidity from retail investors in the cryptocurrency market, exacerbating the already insufficient liquidity. The liquidation data also confirms this point; yesterday, all major currencies fell below warning lines, but the 24-hour liquidation volume was only $1.7 billion, indicating the weakness of liquidity in the secondary market. In light of this situation, even some veteran players in the blockchain space are not immune. According to data from JA_Maartunn, from October 5 to November 4, holders who had held their coins for over 155 days collectively net sold about 405,000 BTC, accounting for 2% of the circulating supply.
With the market sluggish, internal conditions are also unstable. On November 3, the well-established protocol Balancer was hacked, resulting in losses exceeding $128 million. As a DEX that has been running alongside Uniswap for five years, encountering code issues is undoubtedly a significant blow to industry confidence.
With multiple factors at play, a decline is inevitable, but more important than the reasons for the decline is when the market will rise again.
Among the aforementioned reasons, the core trigger remains the U.S. government shutdown. Therefore, when the U.S. government resumes operations and the market performance post-resumption will become the focus of analysis. The current point of contention between the two parties in the U.S. revolves around the Affordable Care Act, which was passed by Obama in 2010. In recent years, the Republican Party has made multiple attempts to repeal or amend the act. By the end of this year, the enhanced subsidies under the Affordable Care Act will expire, meaning that some Americans will see a significant increase in their premiums. Democrats insist on including additional provisions regarding healthcare budgets in the temporary budget bill, while Republicans insist on ending the government "shutdown" before negotiating healthcare budgets. Despite their firm public stances, in light of such a prolonged shutdown, the Washington Post has reported that about a dozen Senate Democrats are considering voting to end this dispute.
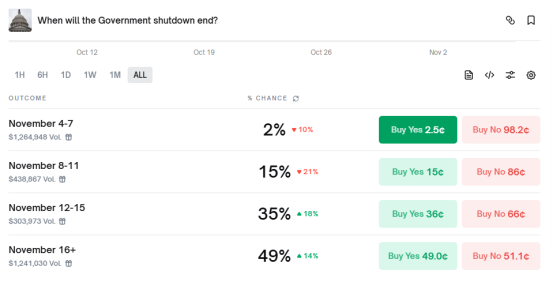
From the prediction market perspective, regarding when the U.S. government will end the shutdown, there is about a 50% probability that it will be after November 16. Institutional predictions are similar, with the next two weeks being a critical period. Goldman Sachs predicts that the government shutdown is most likely to end in the second week of November, noting that the salaries of air traffic controllers and airport security personnel will be interrupted on October 28 and November 10, and the Federal Aviation Administration has stated that unless the shutdown ends by this Friday, it will begin to cut air traffic by 10% at 40 airports starting Friday. This factor was also the reason for the end of the last shutdown. Another institution, Citigroup, has also expressed confidence that the government shutdown will end within the next two weeks.
Of course, the existing information does not guarantee that the shutdown will end within two weeks, but considering the stability of the U.S. economy and society, the expected closure time cannot be too long.
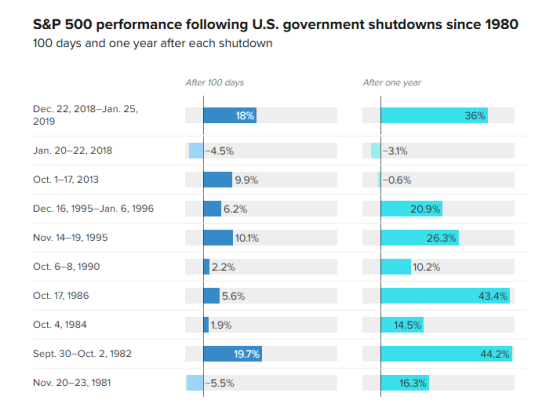
What will happen after the shutdown ends? So far, the U.S. government has experienced 22 shutdowns, three of which were longer and had a greater impact: the 21-day shutdown during the Clinton administration in 1995-1996, the 16-day shutdown in 2013 due to healthcare reform disputes, and the 35-day shutdown from 2018-2019 due to border wall funding disagreements. If we take history as a guide, in these three shutdowns, the risk markets significantly rose after the shutdown ended. One month after the 1995-1996 shutdown ended, the S&P 500 grew by 4%, and three months later it increased by 6.2%. In 2013, it rose by 0.1% one month later and grew by 7.4% three months later, while after the 2018-2019 shutdown ended, it rose by 4.9% one month later and increased by 18% three months later.
The reasons for the rise are twofold: first, the market's expectations improve after the shutdown ends, and second, for the sake of economic recovery, the government often takes strong liquidity easing measures. For example, during the liquidity crisis in 2019, the Federal Reserve quickly injected liquidity into the market through the New York Fed and subsequently announced the resumption of balance sheet expansion. The current situation is similar; it is also important to note that the U.S. stock market is still in a strong cycle, so there is a high probability of a rebound after the government shutdown ends, which will also lead to a rise in the cryptocurrency market.
Despite the positive outlook, in the face of the current volatile market, institutions and traders find it difficult to reach a consensus. Optimists like Bitwise Chief Investment Officer Matt Hougan believe that the bottom for Bitcoin prices is about to appear, and that it will come sooner than expected, with Bitcoin still having a chance to reach new highs this year, potentially rising to the range of $125,000 to $130,000. BitMEX founder Arthur Hayes shares a similar view, stating that after the U.S. Treasury and the Federal Reserve increase liquidity, the market will rebound strongly.
On the other hand, pessimists believe that the market's "bottom" will continue to decline. Fairlead Strategies founder Katie Stockton believes that after breaking below the 200-day moving average, the next downside target for cryptocurrencies is $94,200; 10x Research CEO Markus Thielen also mentioned that if Bitcoin falls below $107,000, it will drop below $100,000.
From today's market performance, major currencies have shown some recovery, with Bitcoin rising to $103,422, Ethereum rising to $3,392, and SOL and BNB slightly increasing.
免责声明:本文章仅代表作者个人观点,不代表本平台的立场和观点。本文章仅供信息分享,不构成对任何人的任何投资建议。用户与作者之间的任何争议,与本平台无关。如网页中刊载的文章或图片涉及侵权,请提供相关的权利证明和身份证明发送邮件到support@aicoin.com,本平台相关工作人员将会进行核查。