Many people think "the decline is about to end"? In fact, it may have just begun.
Many believe that the recent weekly decline in Bitcoin will stabilize like the previous two instances:
It will drop a bit, then stabilize, and continue towards the expected year-end market, even reaching 150,000.
But I previously mentioned a key point:
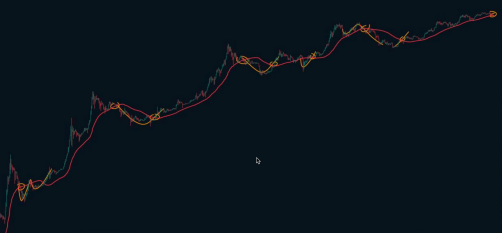
The 50-week moving average has officially broken down.
In the weekly structure, the 50-week moving average has always been a very important "bull-bear dividing line":
This does not mean "the decline is about to end," but rather that the weekly bearish trend has just started.
Unless it can regain the 50-week moving average in the future, from a cyclical perspective, this looks more like the early stages of a decline, rather than the end.
From a long-term cycle perspective: every major correction starts with a break below the 50-week moving average.
Let's take a look at the full perspective of the 50-week moving average; its feedback has been very stable over the past decade.

Since 2012, almost every major bull-bear switch or cyclical correction has a common characteristic:
First, it breaks below the 50-week moving average, then enters a long-term adjustment.
In the last bear market: it broke below the 50-week moving average.
In earlier cyclical corrections: it also first broke below the 50-week moving average.
Even during phase corrections within a major bull market, it will first break down.
Therefore, now that it has just broken down, to say "this is the bottom, we can buy the dip,"
from a cyclical perspective, the evidence is not sufficient.
Looking at the daily chart: Don't predict the bottom, it's safer to follow the structure.
Back to the daily level,
During this decline, don't guess where the bottom is.
Our task is not to guess the bottom, but to trade according to the structure.
Yesterday I mentioned:
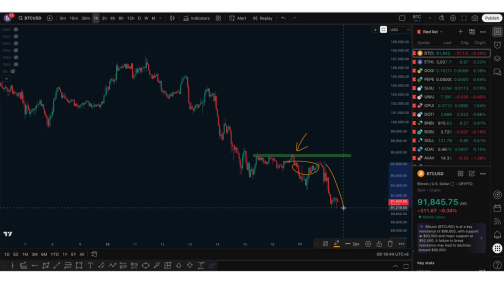
The first resistance level on the hourly chart is at 97,000.
This is where two highs formed over the weekend.
So, 97,000 is an effective defense point for short-term bears.

Currently, the drop from 96,000 to 91,000, this nearly 5,000-point decline, is based on this structure.
Although the recent fluctuations seem small, the downward space has not yet been fully released.
Intraday operations: Don't chase shorts, wait for a rebound to come.
Currently, I do not recommend chasing shorts intraday.
The reason is simple:
Your stop-loss point must be set at 97,000.
But the current price is too far from 97,000.
The stop-loss space would be too large to control risk.
So a more stable approach is:
Wait for a rebound to occur, and when it rebounds near the resistance level, look for opportunities to short.
And the short-term stop-loss point remains at: 97,000.
As long as it does not break this level, the hourly structure remains bearish.
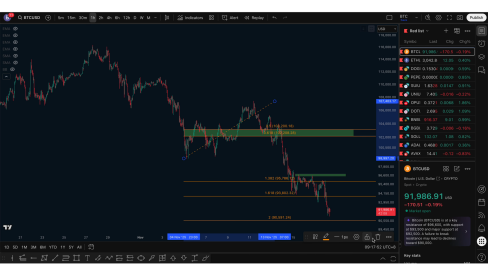
The more critical pressure zone on the 4-hour level: 102,000–103,000.
Yesterday I also mentioned that the key resistance level on the 4-hour chart is:
102,000–103,000.
This is a very important range because:

This is the low point of the previous extremely low market.
It is also the midpoint of the adjustment segment.
At the same time, it is also the current position of the 50-week moving average.
So currently, there are two key pressures above:
First: 97,000.
Second: 102,000–103,000.
We must first break through 97,000 to have a chance to see 102,000–103,000.
And without breaking through, do not consider going long.
Even if the price forms a bullish structure below in the future, it must break the first resistance to continue looking for a rebound.
Many people say the daily chart shows a "5-wave decline," and a rebound will go to 105,000–111,000?
I think the difficulty is very high.
If the daily chart shows a 5-wave decline, once it hits the bottom, the rebound will go to 105,000–111,000.
But why do I think this possibility is very low?
Because the 111,000 level is too high.
Once it rebounds to that level, the entire bearish structure will be completely destroyed.
It is basically equivalent to returning to a bullish trend.
But the current overall structure has already deteriorated, and does not support such a strong reversal market.
This level of strong reversal requires a very large buying power to intervene, and currently, there are no signs of this.
Follow me, join the community, and let's improve together. The article is published with a delay and is for reference only.

免责声明:本文章仅代表作者个人观点,不代表本平台的立场和观点。本文章仅供信息分享,不构成对任何人的任何投资建议。用户与作者之间的任何争议,与本平台无关。如网页中刊载的文章或图片涉及侵权,请提供相关的权利证明和身份证明发送邮件到support@aicoin.com,本平台相关工作人员将会进行核查。


