Qinglan Crypto Class is starting! BTC from four cycles + news perspective, guiding you to step in sync with the crypto market rhythm
Multi-cycle technical analysis: Rebound meets resistance, tug-of-war between bulls and bears
Let’s overlay the charts of the four cycles, and the story becomes clear.
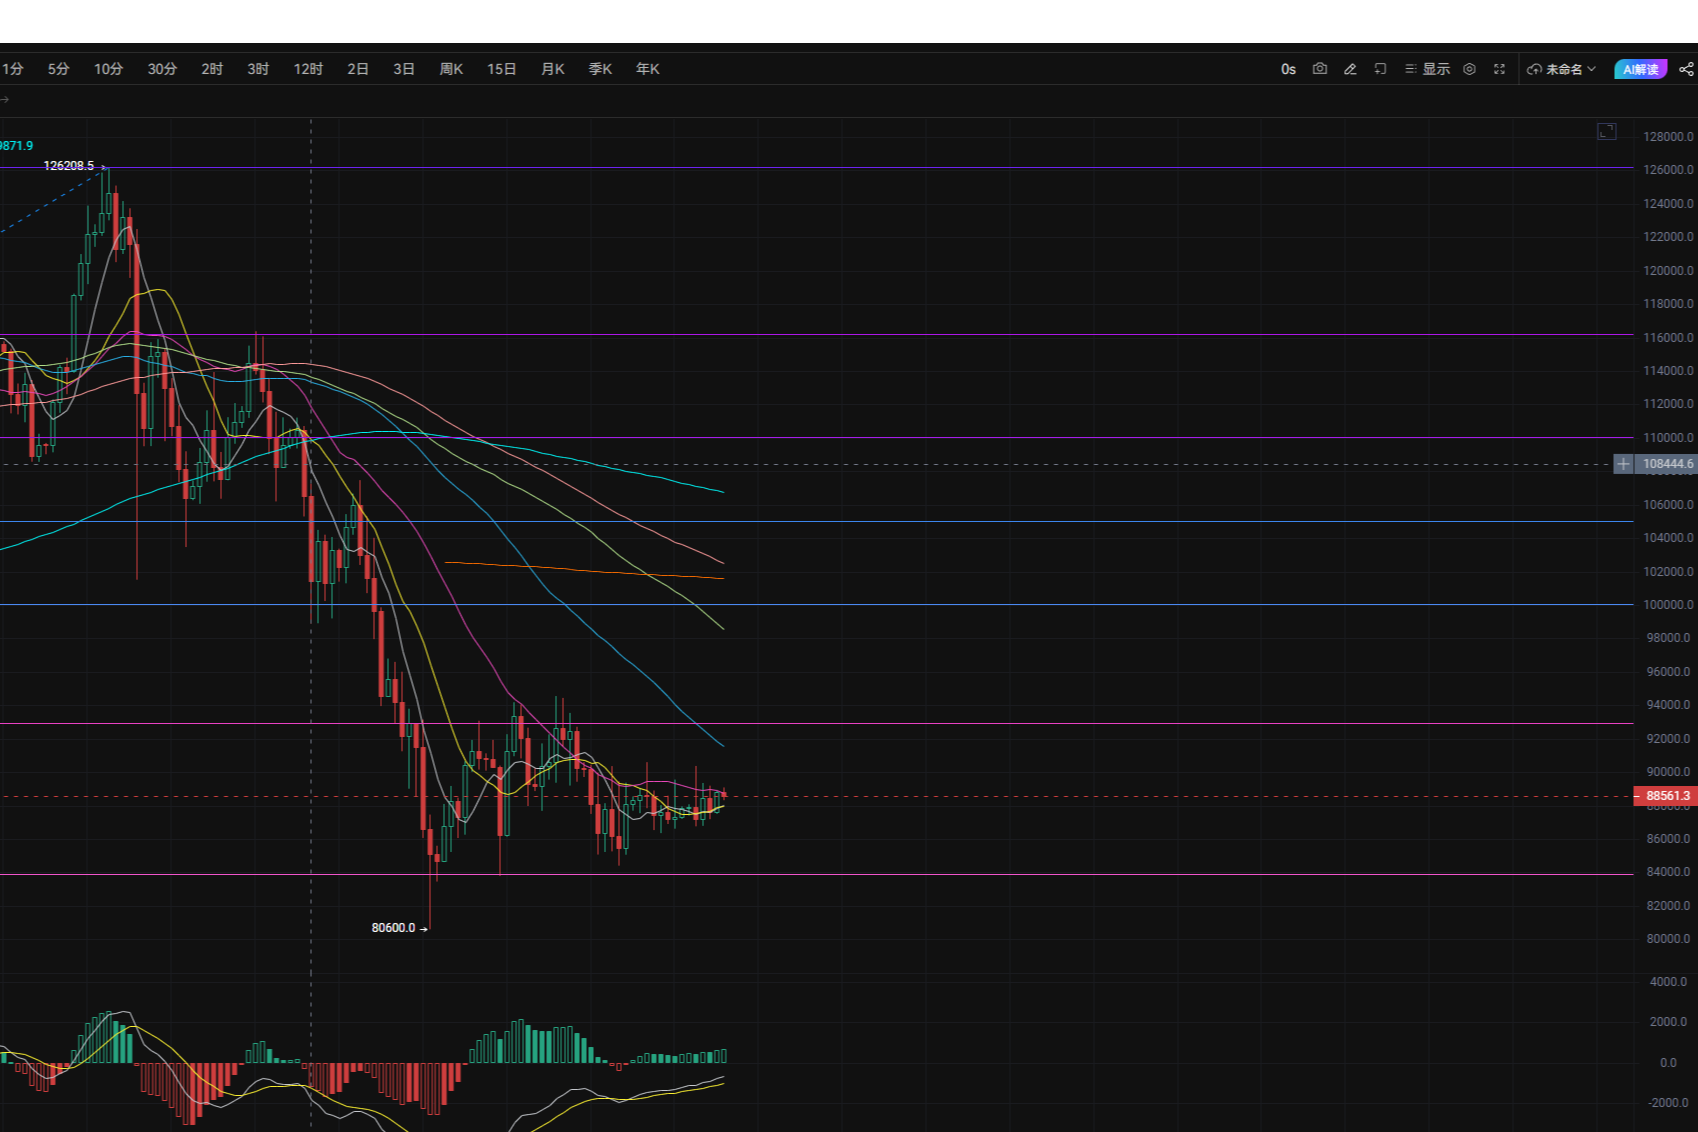
Daily chart (long-term trend): The overall direction is still in a bearish arrangement. Prices are being pressured by major moving averages like MA20 and MA10, forming a typical bearish pattern. Although the green bars in MACD are shortening, indicating a weakening of bearish strength, the fast and slow lines are still below the water (below the zero axis), and no trend reversal signal has appeared yet. Currently, prices are oscillating in the 88000-89000 range, which can be seen as an attempt to build a bottom, but it is still too early to talk about a reversal. The key resistance level is in the 90000-91000 area, which has been tested multiple times without success; strong support below is in the 86000-87000 range, which is the lower boundary of the recent oscillation range.
4-hour chart (mid-term rhythm): Here we can see some positive changes. After gaining support near 87000, prices began a rebound and broke above the MA20 moving average. MACD formed a golden cross below the zero axis, and the red bars turned green, which is a short-term bullish signal. However, prices clearly encountered resistance near 89000-89200, showing signs of a pullback after a spike. This indicates that the rebound momentum is weakening, and both bulls and bears are fiercely contesting this position. The key resistance at the 4-hour level is near 89200, with support in the 87800-88000 range.
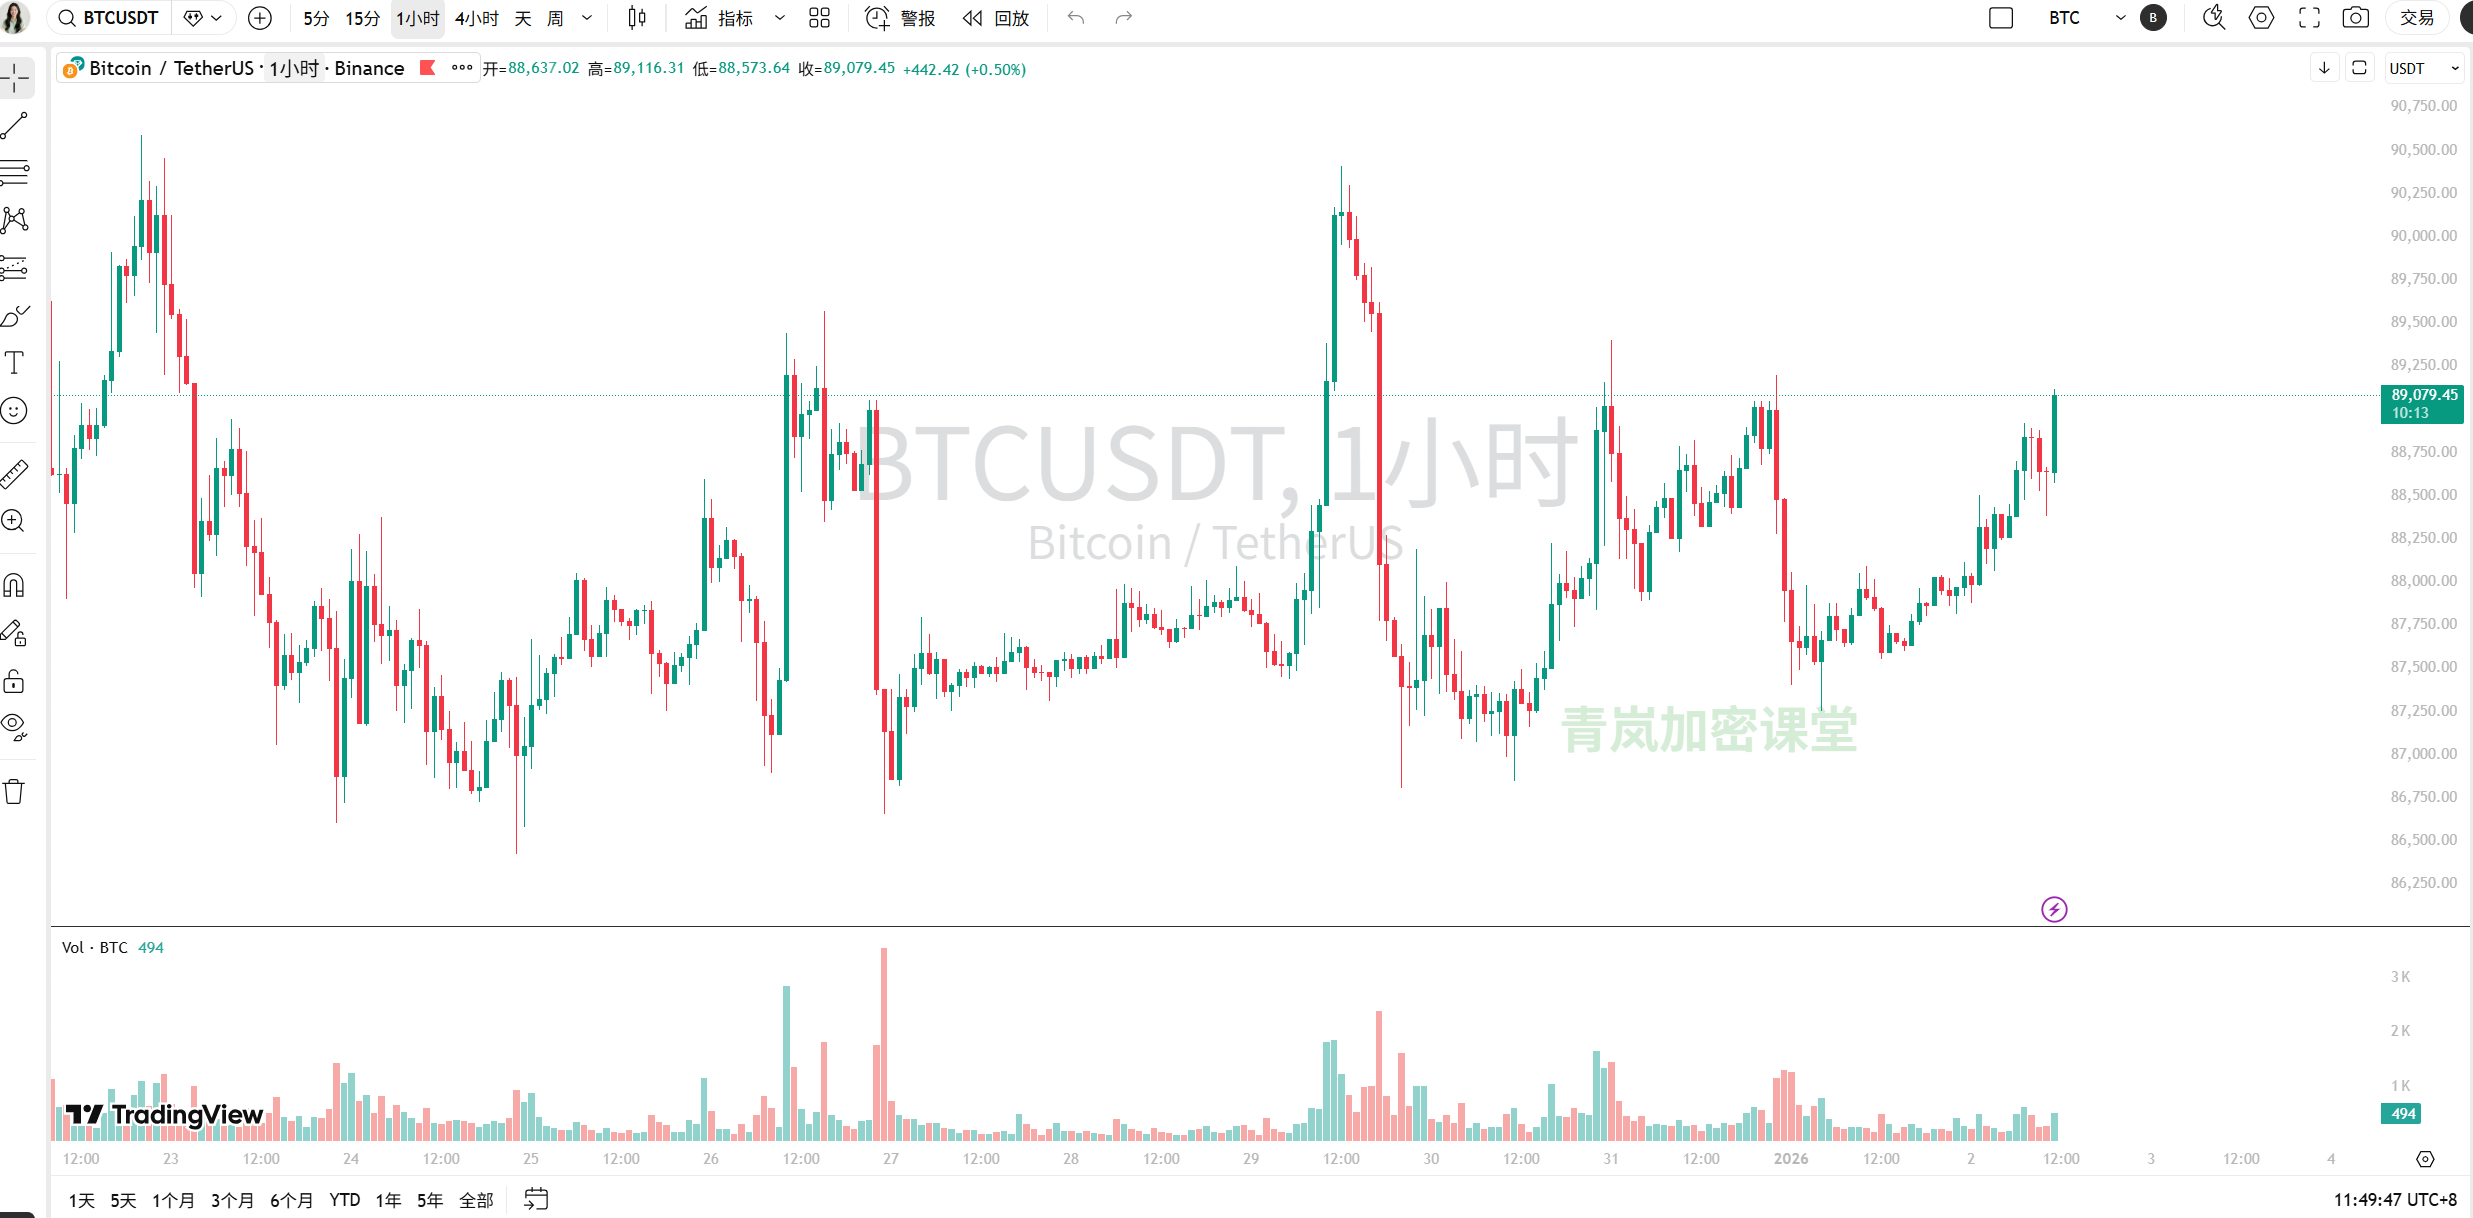
1-hour chart (short-term fluctuations): This clearly depicts the surge early this morning and the subsequent oscillation. Prices surged from around 87600 to over 89100 in one go, but then failed to stabilize, currently consolidating at a high level. The MA5, MA10, and MA20 moving averages are in a bullish arrangement but have started to flatten out. The fast and slow lines of MACD show signs of convergence at a high level, with red bars beginning to appear, indicating that short-term upward momentum is exhausted and there is a need for a pullback. The support at the 1-hour level is first at 88300, then at 87800.
15-minute chart (ultra-short-term direction): This is a typical case of "high-level consolidation, direction unclear." Prices are oscillating back and forth in the narrow range of 88600-89100, with shrinking trading volume. RSI is hovering between 50-70, neither overheated nor weak. This pattern usually indicates that energy is being accumulated for the next directional choice, and we need to wait for it to break out of this small range.
News perspective: Warm winds and hidden worries coexist
In terms of news, it can be described as a tale of two extremes: Warm winds: Tether purchased 8888 BTC on New Year's Eve, and MicroStrategy received an "buy" rating from institutions, indicating large capital's recognition of Bitcoin's long-term value and "bottom-fishing" behavior. Meanwhile, the Federal Reserve is likely to maintain interest rates in January, temporarily stabilizing the macro liquidity environment. Hidden worries: Internal market funds are "moving house," with data showing funds flowing out of BTC and ETH ETFs and shifting towards SOL, XRP, etc., indicating that market risk appetite has not fully warmed up but is undergoing structural rotation. More concerning is that analysts warn of a "death cross" forming between Bitcoin's 10-week and 50-week moving averages, historically indicating a potential for deep pullback risk. Additionally, over 200 million dollars were liquidated in the market within 24 hours, with nearly 70% of long positions, indicating that leveraged bulls were washed out during the rebound, and market sentiment remains fragile.
Comprehensive prediction and trading ideas
Combining technical analysis and news, my judgment is: short-term rebound momentum is weakening, entering a high-level oscillation phase, mid-term still building a bottom in the large range of 87000-90000, and the long-term downtrend has not yet reversed.
For short-term traders: It is not advisable to chase highs at the moment. You can pay attention to the strong resistance area of 89200-89500; if prices cannot break through with volume, consider lightly shorting, with a stop-loss above 90000, targeting 88300 and 87800. Conversely, if prices stabilize after a pullback to the 87800-88000 support area and show a bullish candlestick pattern (like a hammer or bullish engulfing), you can lightly go long, with a stop-loss below 87500, targeting 89000. For mid-term strategists: Now is not the time for large-scale bottom fishing. A more prudent strategy is to wait. Either wait for prices to effectively break and stabilize above the 90000-91000 resistance area, confirming a strengthening mid-term trend; or wait for prices to pull back again or even break below the 86000-87000 support area, showing stabilization signals after panic selling, and then build positions in batches. Key points to remember: Strong resistance: 89200 -> 90000 -> 91000 Core oscillation area: 87800 - 89200 Strong support: 87800 -> 87000 -> 86000
For more quantitative breakdowns of how real-time news affects market sentiment, it has been updated in my Qinglan Crypto Class, qinglan.org. Finally, Sister Qinglan leaves you with a trading quote: "The market never lacks opportunities; what it lacks is the patience to wait for opportunities and the courage to seize them. In a directionless oscillating market, preserving capital is more important than making profits."
Alright, that concludes today's analysis. Let’s stay vigilant and respond flexibly to market changes!
免责声明:本文章仅代表作者个人观点,不代表本平台的立场和观点。本文章仅供信息分享,不构成对任何人的任何投资建议。用户与作者之间的任何争议,与本平台无关。如网页中刊载的文章或图片涉及侵权,请提供相关的权利证明和身份证明发送邮件到support@aicoin.com,本平台相关工作人员将会进行核查。