Odaily specially invited market analyst Cody Feng, a master's degree holder in financial statistics from Columbia University, has focused on quantitative trading in the U.S. stock market since college and has gradually expanded to digital assets such as Bitcoin. He has built a systematic quantitative trading model and risk control system through practical experience; he possesses keen data insights into market fluctuations and is committed to continuous in-depth research in the professional trading field, pursuing stable returns. He will delve into changes in BTC technology, macroeconomics, and capital flow weekly, reviewing and demonstrating practical strategies, and previewing significant recent events for reference.

Core Summary of the Weekly Trading Report:
• Strategy Execution (Short-term) Effect Verification: Last week's trading strictly followed the established strategy, successfully completing a short-term operation (1x leverage) with a cumulative return of 3.4%.
• Core Viewpoint (Short-term) Verification: The core viewpoint proposed last week that "Bitcoin may maintain a fluctuation range of $84,000 to $94,500" has been accurately confirmed by the market. In the past week, the price reached a high of $94,789 and a low of $89,311, closely aligning with the given resistance level of $94,500 and support level of $89,500, strongly validating our assessment of the key points.
The following will review the market prediction, strategy execution, and specific trading process in detail.
I. Market Review: (01.05~01.11)
1. Review of Last Week's Short-term Operations:
We strictly followed the trading signals generated by our self-constructed "Arbitrage Trading" and "Momentum Quantification" models (see the red and green block signals in Figure 1), and combined them with precise market trend predictions to successfully complete a short-term operation, achieving a cumulative return of 3.4%. The specific trading details and review are as follows:
① Trading Details Summary: (No Leverage)

② Short-term Trading Review:
• Trading (Profit 3.4%): This operation perfectly executed the "Short Sell at Resistance" strategy: First, when the price surged towards the key resistance level of $94,500, it resonated with the top signal (green dot) from the Arbitrage Trading model, prompting us to decisively enter and establish a 30% short position; second, after the price retraced to the target support area and triggered the bottom signal (red dot) from the model, we closed the position to lock in profits.
- Review of Last Week's Trend Prediction and Operational Strategy:
① Last week, it was clearly pointed out: Focus on observing the gains and losses in the $84,000 to $94,500 area. Before effectively breaking through the upper and lower bounds of this range, the price will maintain a fluctuating pattern.
② Review of Core Points: The first resistance is seen in the $93,000 to $94,500 area, and the first support is in the $89,500 to $91,000 area.
② Review of Operational Strategy:
• Medium-term Strategy: If the market maintains a fluctuation in the $84,000 to $94,500 range, continue to hold about 65% of the medium-term position (short).
• Short-term Strategy: If the price remains in the $84,000 to $94,500 range, execute operations according to Plan A:
• Opening Position: When the price rebounds to the $93,000 to $94,500 area and shows resistance signals, establish a 30% short position.
• Risk Control: Set the stop-loss for the short position above $95,500.
• Reducing Position: When the price drops to the $86,000 to $86,500 area and shows stabilization signals, gradually close part of the short position.
• Closing Position: When the price drops to around $84,000 and shows stabilization signals, close all positions to take profits. 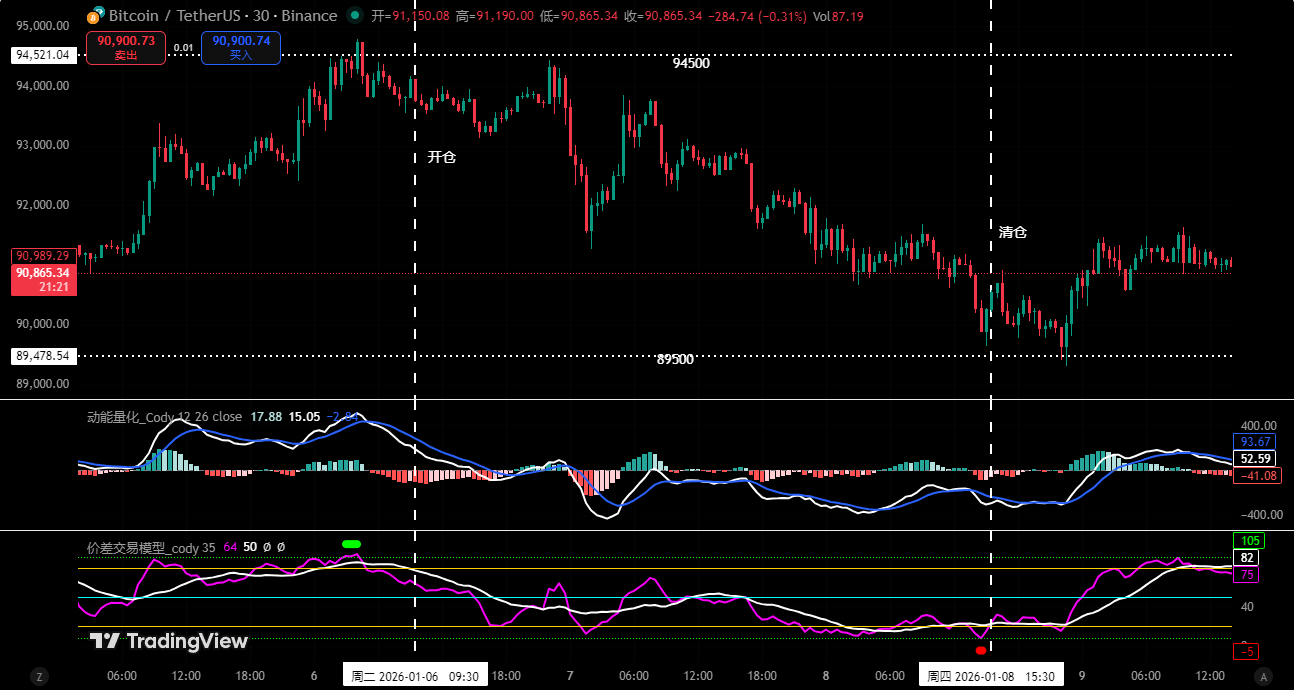
Figure 1
II. Trend Model Judgment: Future Bitcoin Trends and How to Enter
Combining market operations, the author conducts an in-depth analysis of Bitcoin's trend structure based on a self-constructed trading system from multiple models and dimensions.
- As shown in (Figure 2), from the weekly chart analysis:
• Momentum Quantification Model: Technical indicators show that the momentum line is converging below the zero axis, while the negative energy bars continue to shrink, indicating a slowdown in the rate of decline. However, the current signal has not confirmed that a trend reversal has occurred.
The momentum quantification model indicates: Price Decline Index: High
• Sentiment Quantification Model: The blue sentiment line value is 52.61, with zero intensity; the yellow sentiment line value is 20.76, with zero intensity, and the peak value is 0.
The sentiment quantification model indicates: Price Pressure and Support Index: Neutral
• Digital Monitoring Model: The price has been below the bullish-bearish (yellow-blue line) boundary for 8 weeks. Last week, bulls again attempted to challenge this line but retreated after encountering resistance from bears. This failed attempt indicates that bears still control the market.
The digital monitoring model indicates: No monitoring (top-bottom) digital signals have appeared; the weekly K-line closed with an upper shadow line, with a decline of about 0.57%.
The above data indicates: Bitcoin's weekly chart has entered a bearish trend, and caution is needed for fluctuation adjustment risks. 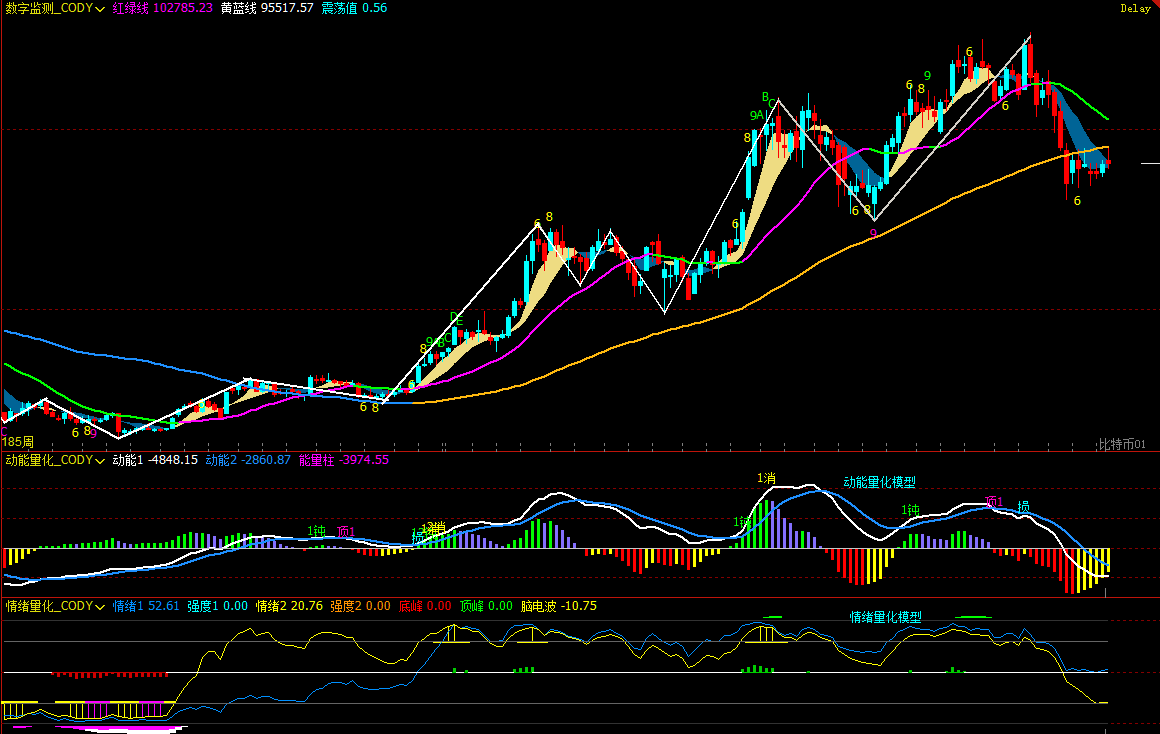
Figure 2
- As shown in (Figure 3), from the daily chart analysis:
• Momentum Quantification Model: Last week showed an overall "rise then fall" trend. In the first half of the week, the momentum line crossed above the zero axis, and the positive energy bars continued to expand; however, in the latter half, the momentum line began to converge, and the energy bars significantly shrank, indicating weakened buying momentum.
The momentum quantification model indicates: The daily level is in a Bull-Bear Tug-of-War Stage, focus on the gains and losses around the zero axis.
• Sentiment Quantification Model: After last week's Sunday close, the blue sentiment line value is 28, with zero intensity; the yellow sentiment line value is 62, with zero intensity.
The sentiment quantification model indicates: Pressure and Support Index: Neutral
The above data suggests: The daily level is at a critical juncture between bulls and bears, and the trend direction needs further confirmation. 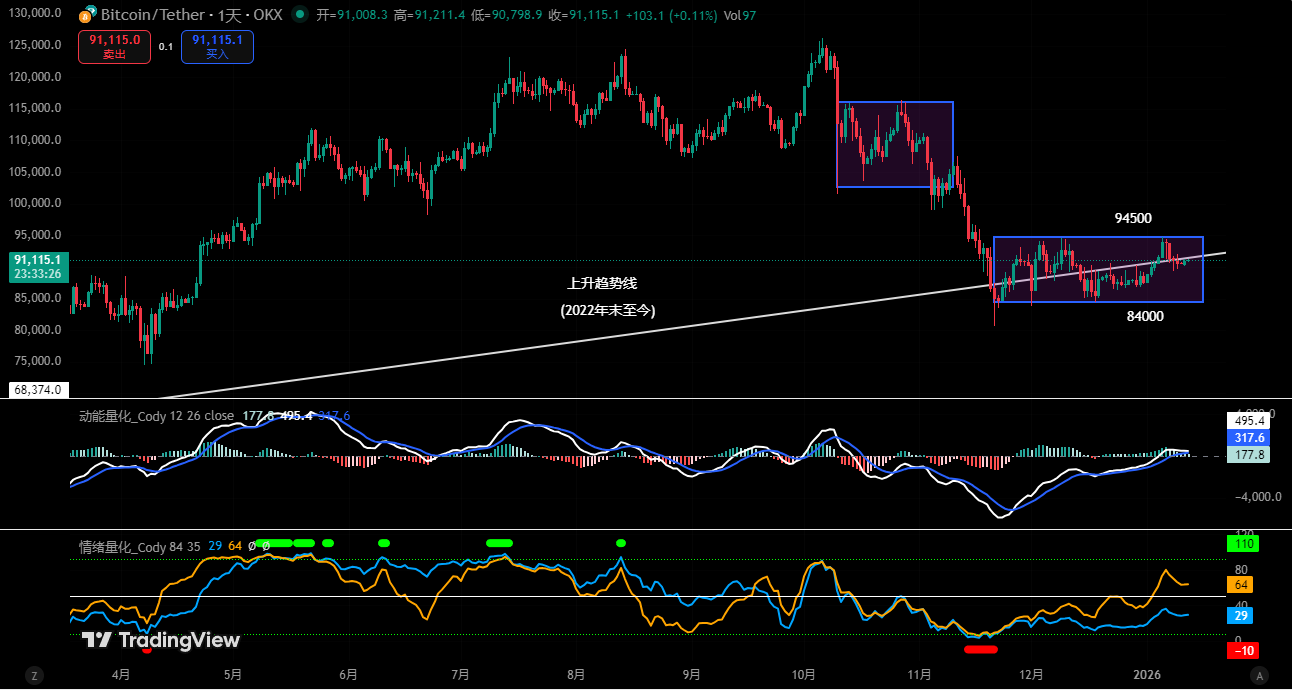
Figure 3
III. Market Forecast for This Week: (01.12~01.18)
- Core Viewpoints for This Week:
• Bitcoin is expected to continue fluctuating in the $84,000 to $94,500 range, but close attention should be paid to the bull-bear battle at both ends of the range.
• Downward Break: If it effectively breaks below $84,000, the trend will turn downward, with the primary testing target at $80,000.
• Upward Break: If it can strongly hold above $94,500, it is likely to initiate a more substantial technical rebound.
- Core Resistance Levels:
• First Resistance Area: $92,000 to $93,000
• Second Resistance Area: $94,500 to $95,000
• Important Resistance Level: Near $97,500 to $99,500.
- Core Support Levels:
• First Support Level: $89,500 to $91,000
• Second Support Level: $86,000 to $86,500
• Third Support Level: $83,500 to $84,500
• Important Support Level: Near $80,000.
IV. Operational Strategy for This Week (Excluding Sudden News Impact): (01.12~01.18)
- Medium-term Strategy:
• If the price has not effectively broken through $94,500, continue to maintain about 65% of the medium-term position (short).
• If the price successfully breaks through and holds above $94,500, close all medium-term positions (short) and hold cash for observation.
Short-term Strategy: Utilize 30% of the position, set stop-loss points, and look for "Arbitrage" opportunities based on support and resistance levels (using 30 minutes as the operating cycle).
To dynamically respond to market changes and combine real-time model signals, we have formulated three short-term operational plans: A/B/C:
• Plan A: If the price maintains a fluctuation in the $84,000 to $94,500 range:
• Opening Position: Based on core resistance levels (see this week's market forecast), when it rebounds to the $93,000 to $94,500 area and combines with the hourly model top signal, establish a 30% short position.
• Risk Control: Set the initial stop-loss for the short position about 1.5% above the cost price (i.e., 1.015 * cost price).
• Closing Position: When it drops near the core support level and combines with model signals, gradually close positions to take profits.
• Plan B: If the price effectively breaks below the $84,000 support:
• Opening Position: If it effectively breaks below the core support level, establish a 30% short position.
• Risk Control: Set the initial stop-loss for the short position about 1.5% above the cost price (i.e., 1.015 * cost price).
• Closing Position: When it drops near $80,000 and combines with model signals, gradually close positions to take profits.
• Plan C: If it successfully breaks through and holds above the $94,500 resistance:
• Opening Position: If it successfully breaks through the core resistance level and combines with model signals, establish a 30% long position.
• Risk Control: Set the initial stop-loss for the long position about 1.5% below the cost price (i.e., 0.985 * cost price).
• Closing Position: When it rebounds near $97,500 and combines with model signals, gradually close positions to take profits.
V. Macro and Liquidity Weekly Observation: (01.12~01.18)
1. FOMC Officials' Intensive Speeches: An Important Window for Policy Expectation Recalibration
This week, the Federal Reserve system will welcome a rare window of intensive speeches from officials. Several Federal Reserve chairs and governors with different annual voting rights will focus on expressing their views on the economic outlook, inflation trends, and policy stance, providing key information for the market to assess the future monetary policy path.
From the perspective of the speaking lineup, it includes both permanent FOMC voting members and rotating voting members for the years 2026-2028, covering information dimensions related to short-term policy orientation and mid-term decision frameworks, which have significant guiding implications for the structure of interest rate expectations.
Key Events Include:
Tuesday: 2027 FOMC voting member and Atlanta Fed President Bostic speaks;
2027 FOMC voting member and Richmond Fed President Barkin speaks;
FOMC permanent voting member and New York Fed President Williams speaks;
2028 FOMC voting member and St. Louis Fed President Bullard speaks;
Wednesday: Richmond Fed President Barkin speaks again;
2026 FOMC voting member and Philadelphia Fed President Harker speaks on economic outlook;
Fed Governor Waller speaks in public;
Thursday: 2026 FOMC voting member and Minneapolis Fed President Kashkari speaks, while 2027 FOMC voting member and Atlanta Fed President Bostic speaks again;
The Fed releases the Beige Book on economic conditions;
FOMC permanent voting member and New York Fed President Williams delivers opening remarks at an event;
Bostic speaks again on economic and policy issues;
Friday: Richmond Fed President Barkin speaks on regional economic outlook.
II. Market Focus: Will Policy Turning Point Signals Be Released Early?
Against the backdrop of marginal inflation decline and signs of cooling in the job market, the core focus of the market is whether officials continue to emphasize the necessity of "maintaining restrictive policies for a longer time" or begin to provide clearer forward guidance for the next phase of policy shift.
It should be noted that officials' speeches more influence the expectation structure rather than the short-term direction, and their effects are usually reflected in the mid-term adjustments of the interest rate curve, the U.S. dollar index, and the valuation systems of risk assets.
III. Potential Impact on Risk Assets and the Crypto Market
If multiple officials maintain a cautious stance, emphasizing that the inflation path remains uncertain, it may suppress risk appetite in the short term;
However, if the speeches gradually acknowledge the trend of economic slowdown and weaken the necessity for further tightening of policies, it would help to reprice mid-term easing expectations.
For cryptocurrencies like Bitcoin, the core impact of Fed officials' statements lies in liquidity expectations and changes in discount rates, with effects leaning towards the mid-term, making it more suitable as a macro pricing reference rather than a short-term trading signal.
VI. Special Reminders:
When Opening a Position: Immediately set the initial stop-loss level.
When Profit Reaches 1%: Move the stop-loss level to the opening cost price (breakeven point) to ensure capital safety.
When Profit Reaches 2%: Move the stop-loss level to the position of 1% profit.
Continuous Tracking: After that, for every additional 1% profit, move the stop-loss level up by 1% to dynamically protect and lock in existing profits.
(Note: The above 1% profit trigger threshold can be flexibly adjusted by investors based on their own risk preferences and the volatility of the asset.)
Financial markets are ever-changing, and all market analyses and trading strategies need to be dynamically adjusted. All viewpoints, analytical models, and operational strategies mentioned in this article stem from personal technical analysis and are for personal trading logs only, not constituting any investment advice or operational basis. The market carries risks; invest cautiously and DYOR.
免责声明:本文章仅代表作者个人观点,不代表本平台的立场和观点。本文章仅供信息分享,不构成对任何人的任何投资建议。用户与作者之间的任何争议,与本平台无关。如网页中刊载的文章或图片涉及侵权,请提供相关的权利证明和身份证明发送邮件到support@aicoin.com,本平台相关工作人员将会进行核查。