Qinglan Crypto Class is now open! BTC's four cycles + dual perspectives on news, guiding you to step in sync with the crypto market rhythm
Long-term trend (daily chart): Bullish pattern solidified, but beware of short-term overheating. The daily chart is very clear; since the end of December, the price has been oscillating upward from around $85,000, and is currently firmly above all major moving averages (MA5, MA10, MA20), which is a textbook bullish arrangement. The MACD has continued to rise after a golden cross above the zero line, with strong red bars (momentum) remaining, and the RSI is around 70, indicating that the market is strong but close to the overbought area. On the news front, cooling inflation, whales returning to the spot market to buy, and traditional financial institutions like DZ Bank in Germany entering the market all provide fundamental support for a long-term bull market. However, the rainbow chart shows that we have entered the "liquidation sell-off" zone, which, while a mid-term buy signal, also reminds us that prices have moved away from the "cheap" range, and caution is needed when chasing highs.
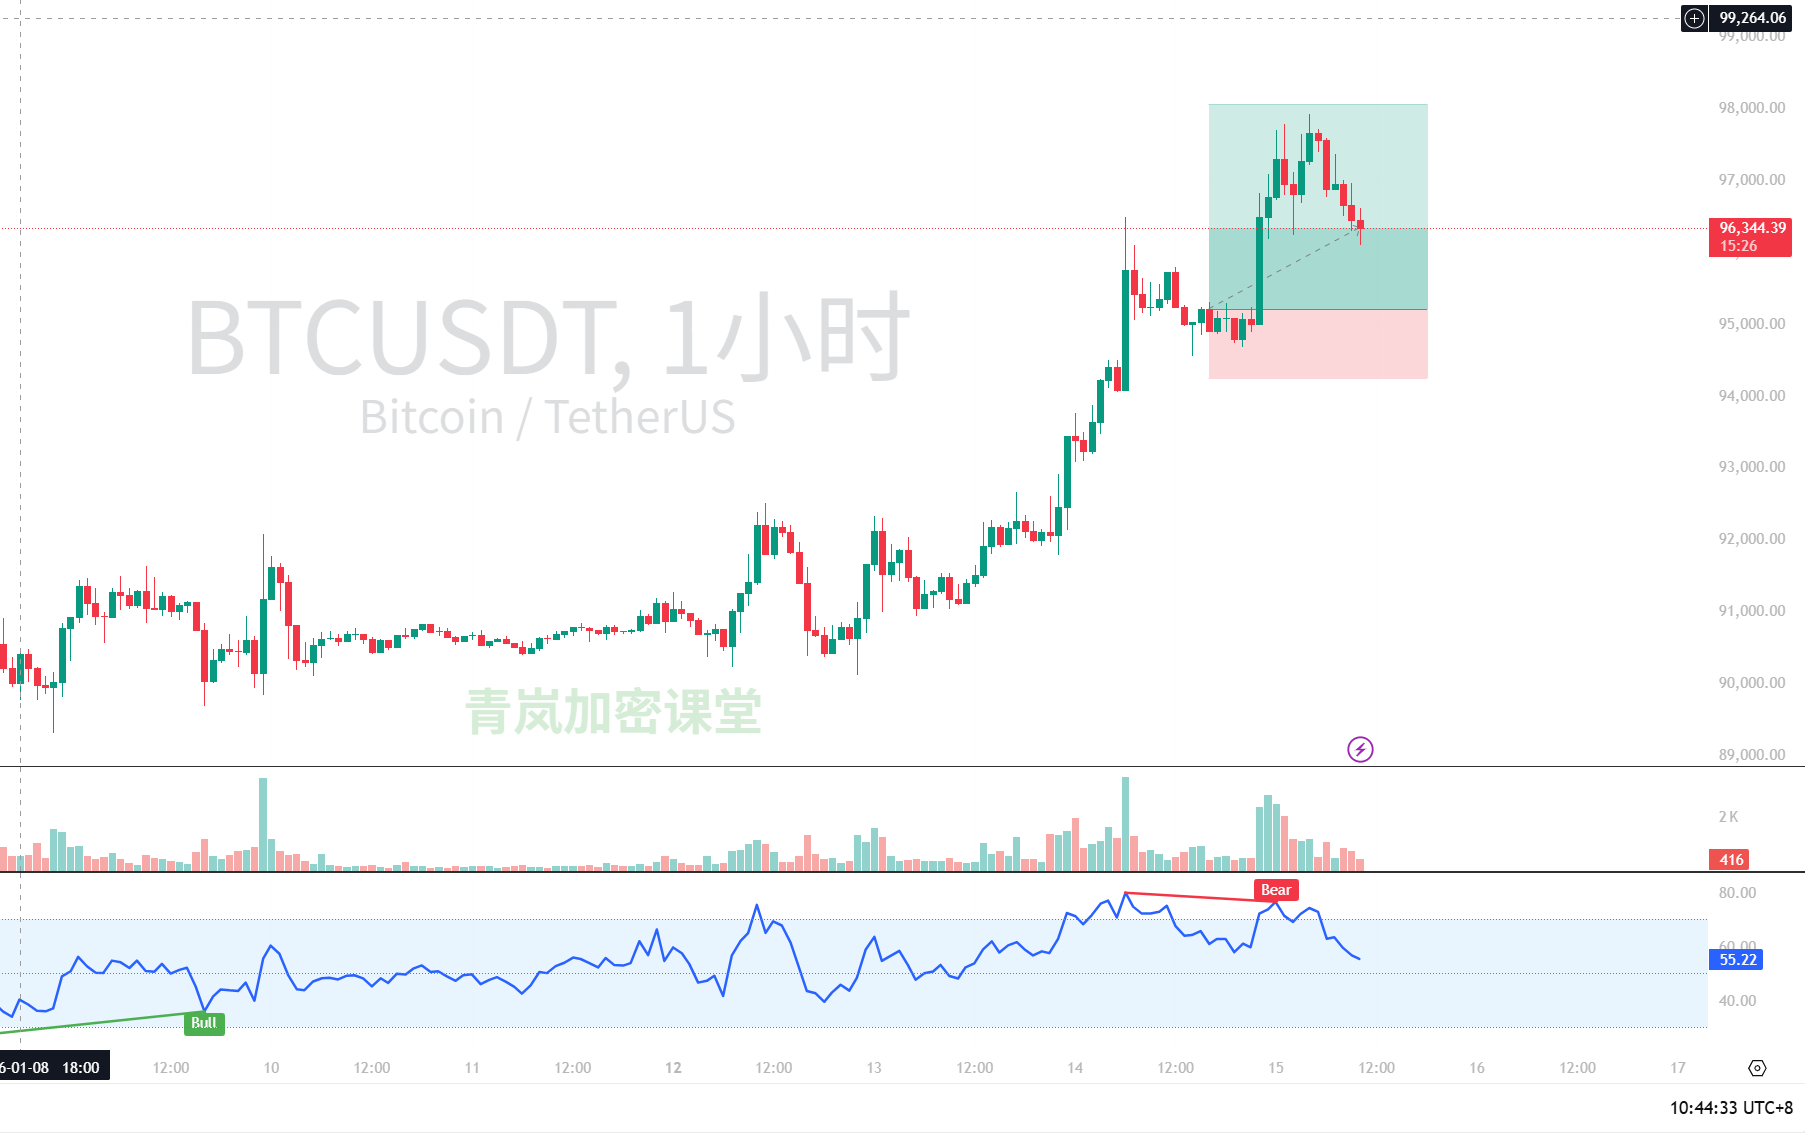
Mid-term rhythm (4-hour chart): High-level oscillation, building a new platform. The 4-hour chart shows that after a strong surge on January 14, breaking through $97,000, the price did not continue to push towards the $100,000 mark but instead oscillated at a high level between $96,000 and $98,000. The MA moving averages are also in a bullish arrangement, but the MACD's fast and slow lines (DIF/DEA) show signs of flattening and convergence at high levels, with red bars beginning to shorten, indicating that the upward momentum is waning and time is needed to digest profit-taking or accumulate new strength. This position is critical, as it is both a consolidation after a breakout and may form a short-term top.
Short-term speculation (1-hour & 15-minute charts): Pullback pressure emerges, focus on key support. Short-term charts better reflect the current speculation. On the 1-hour chart, after reaching a high, the price has pulled back, and the MACD has formed a death cross at a high level, with green bars turning into red and continuously lengthening, which is a clear short-term adjustment signal. The 15-minute chart shows more detail; after the early morning high, it has formed a small-scale oscillating downward channel, with the RSI repeatedly dipping into the 40 area, indicating that bears are trying to exert force. Combined with the news, Coinbase's sudden withdrawal of support for the crypto bill has triggered short-term uncertainty in regulation, which may be an emotional factor triggering profit-taking.
Key levels and predictions:
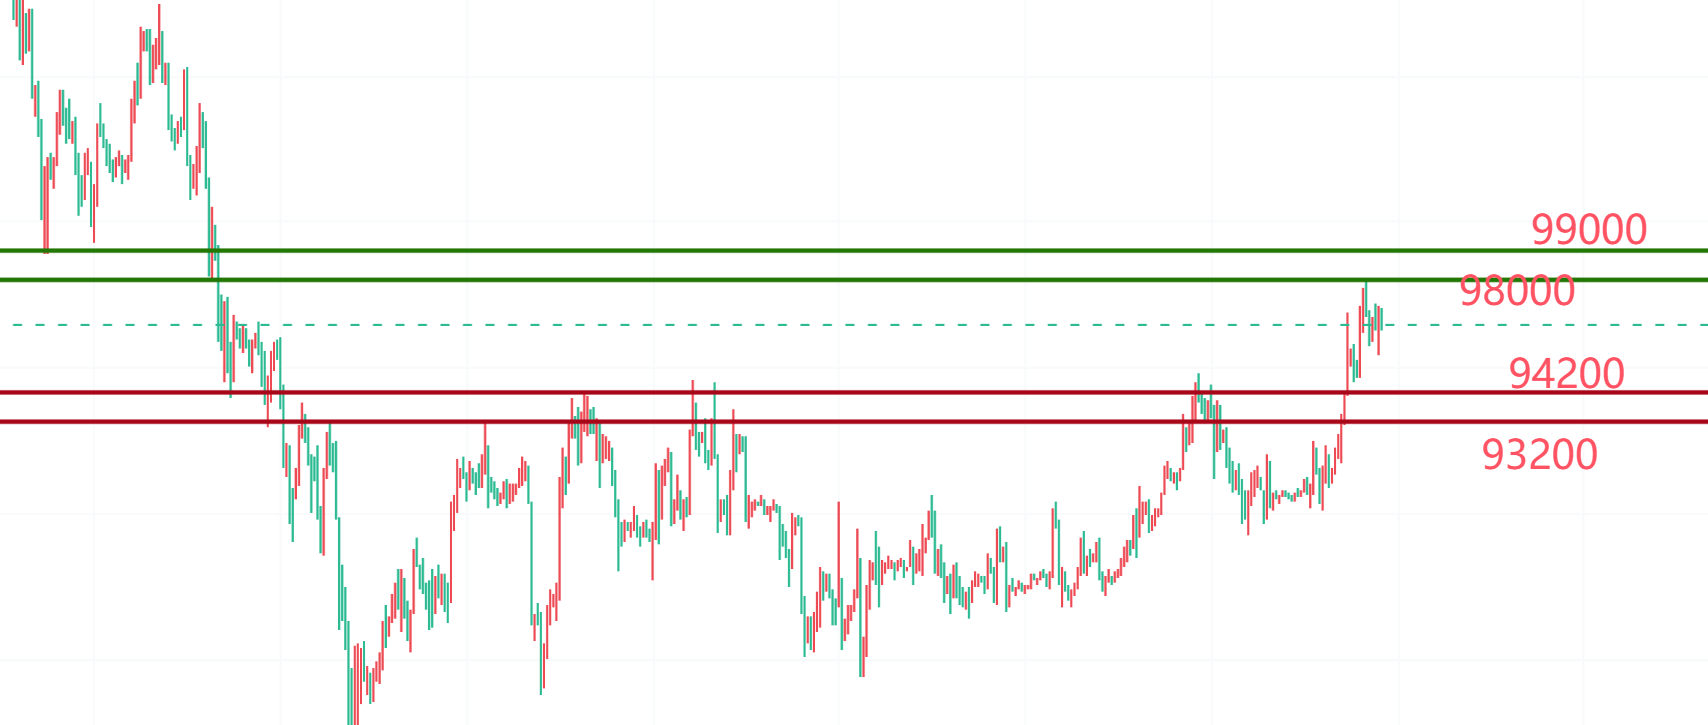
Core support level: First is $96,000 (near the recent oscillation platform's lower edge and the 4-hour MA10), which is an important defense line for bulls. Stronger support is in the $95,000-$95,200 area (previous breakout level and daily MA5).
Core resistance level: Undoubtedly $98,000 and the psychological barrier of $100,000. Only by stabilizing above $98,000 can the door to $100,000 be opened.
Possible formations: Currently, there are signs of forming an "ascending wedge" or "rectangle consolidation" at high levels. If it breaks below $96,000 and rebounds weakly, it may form a "double top" prototype, increasing the depth of the pullback.
Comprehensive prediction and trading ideas: The current market is in the "short-term high-level oscillation adjustment within a long-term bullish trend" phase. The overall direction remains upward, but the conditions for a direct push to $100,000 are not mature; a pullback or sideways trading is needed.
For spot holders: Hold your base position steady, don't exit easily. You can use $96,000 as a short-term strength dividing line; hold above it and consider reducing some profit-taking positions if it effectively breaks below, and then replenish at stronger support levels (around $95,000).
For short-term traders: Focus on range oscillation strategies. You can buy low and sell high between $96,000 and $98,000. A more prudent approach is to wait for a directional choice: if it breaks upward and stabilizes above $98,000, you can lightly chase long positions; if it breaks downward below $96,000 and the rebound confirms weakness, consider shorting, targeting the $95,200-$95,000 area.
For those looking to open new positions: Avoid chasing highs at the current level. Patiently wait for a pullback to the $95,000-$95,500 support area, and enter in batches after a stabilization signal appears (such as a MACD bottom divergence on the 15-minute chart, long lower shadows, etc.), which is safer.
For more quantitative breakdowns of how real-time news affects market sentiment, updates are available on my Qinglan Crypto Class, qinglan.org
Finally, I’ll leave you with a trading quote that Qinglan often mentions: "The trend is your friend, but price is not. Don’t come rushing in during the euphoria, and don’t turn away in panic." Stay calm, follow the rules, and we can thrive in the market for the long haul. That's all for today's analysis; see you in the market!
免责声明:本文章仅代表作者个人观点,不代表本平台的立场和观点。本文章仅供信息分享,不构成对任何人的任何投资建议。用户与作者之间的任何争议,与本平台无关。如网页中刊载的文章或图片涉及侵权,请提供相关的权利证明和身份证明发送邮件到support@aicoin.com,本平台相关工作人员将会进行核查。