Coin Circle Liying: 3.16 BTC 2-Hour Cycle Deep Analysis: Bollinger Bands "Golden Convergence" + MACD Bottom Divergence, the Last Signal Before the Big Market Starts?
Hello, fellow warriors in the coin circle, I am Liying! Today, I will take you through the surface of candlesticks, dissecting the wealth code of BTC in the 2-hour cycle. The Bollinger Bands have narrowed to the critical value, initial signs of MACD bottom divergence, and unusual trading volumes conceal the intentions of the main players. Whether you are a short-term sniper or a medium-term planner, this analysis can help you accurately capture trend turning points!
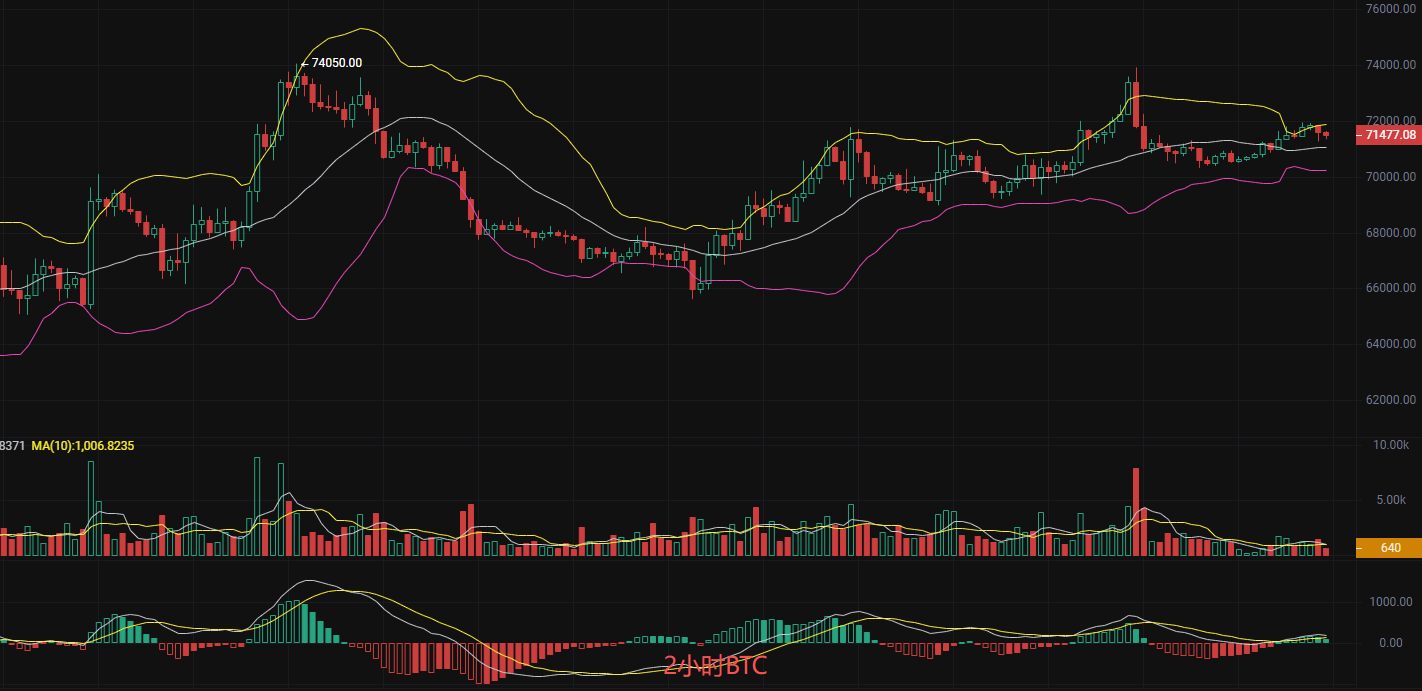
Currently, the 2-hour Bollinger Bands exhibit an extreme convergence pattern: upper band 71914, middle band 71080, lower band 70246 with a very small gap, indicating that short-term bullish and bearish forces are evenly matched, and the market has entered a quiet period where all traders are waiting for directional decision. At the low point of 62510, the Bollinger Bands also experienced extreme contraction, followed by an upper band breakout leading to a surge from 62510 to 74050, a rise of over 18%. After reaching the high point of 74050, the Bollinger Bands narrowed again, and the price retraced to the 68000 range, completing the cycle of contraction-expansion-contraction.
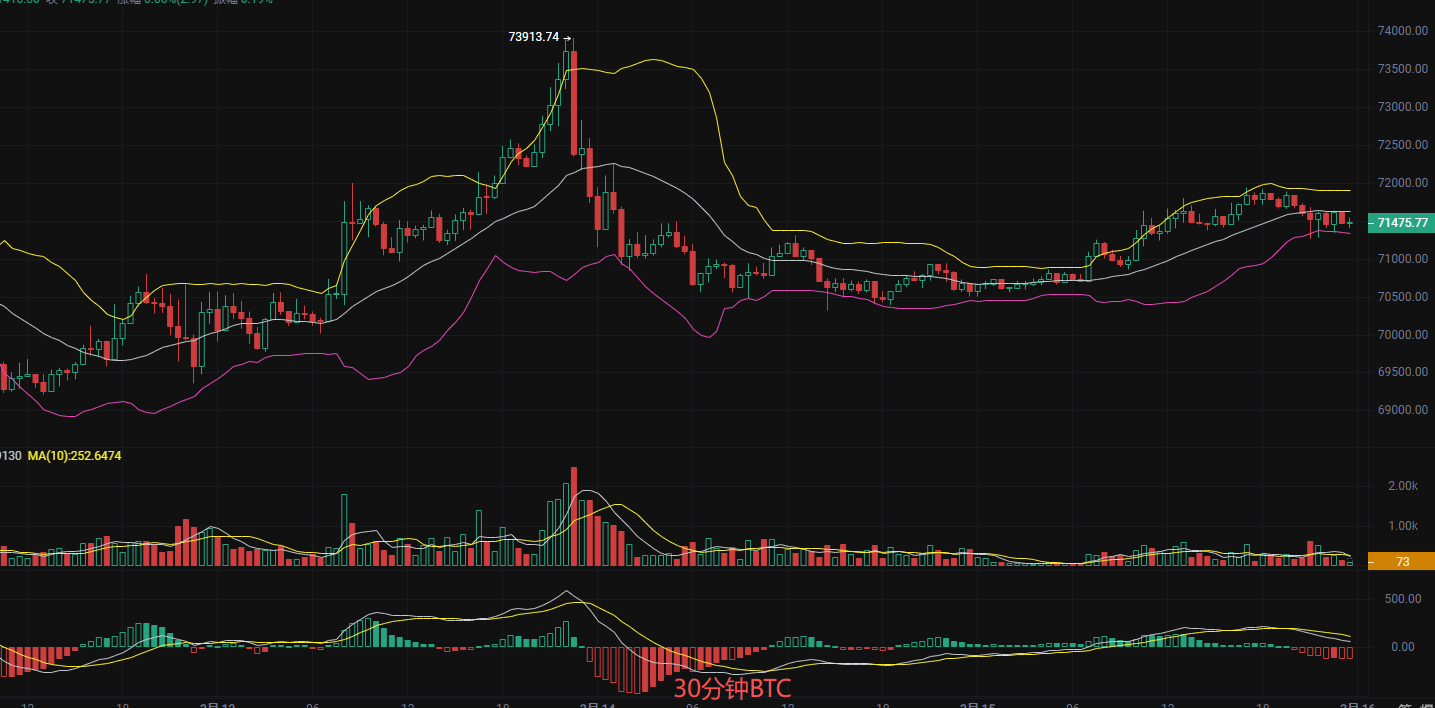
Therefore, Liying believes our current opportunity can focus on the Bollinger Bands narrowing again. If the price breaks upward past the upper band 71914, it is very likely to start a new round of upward momentum targeting the previous high of 74050 or even higher; if it breaks downward past the lower band 70246, it may continue to test support at 68000 or even 66000. MACD bullish energy temporarily prevails but watch for bottom divergence after a pullback! A price pullback with momentum not making a new low is a short-term stop-loss or even reversal warning signal! If the subsequent MACD histogram continues to expand and maintains a golden cross, bullish momentum will restart, and rebound space will open up; if the DIF turns downward and the histogram shrinks, one must be wary of the risk of a false breakout and subsequent pullback.
Short-Term Practical Strategy (Liying's Personal Instruction, Precise Targeting of the Market)
Long Strategy: If it breaks upward past 71914, you can lightly chase long with the target at 74050 and a stop-loss at 71000.
Short Strategy: If it breaks downward past 70246, you can lightly chase short with the target at 68000 and a stop-loss at 71000.
Finally, Liying wants to tell everyone:
Wealth in the coin circle always belongs to those who "understand signals, maintain discipline, and dare to take action." The current "Bollinger Bands narrowing + MACD bottom divergence" of BTC is the "last signal before the big market starts." Are you ready to welcome the storm?

Risk Warning: The above analysis by Liying is based on real-time market data and is for reference only, not constituting investment advice. Trade at your own risk.
免责声明:本文章仅代表作者个人观点,不代表本平台的立场和观点。本文章仅供信息分享,不构成对任何人的任何投资建议。用户与作者之间的任何争议,与本平台无关。如网页中刊载的文章或图片涉及侵权,请提供相关的权利证明和身份证明发送邮件到support@aicoin.com,本平台相关工作人员将会进行核查。